Part 2 Master Candlestick PatternKey Terms in Options Trading
Before diving into strategies, let’s master some core concepts:
Underlying Asset: The stock/index/commodity on which the option is based.
Strike Price: The price at which the option can be exercised.
Expiration Date: The date on which the option contract ends.
Premium: The price paid by the option buyer to the seller (writer) for the contract.
In-the-Money (ITM): Option has intrinsic value (profitable if exercised).
At-the-Money (ATM): Underlying price = Strike price.
Out-of-the-Money (OTM): Option has no intrinsic value yet (not profitable to exercise).
Lot Size: Options are traded in lots (e.g., Nifty option has a fixed lot of 50 units).
Leverage: Options allow control of large positions with smaller capital.
How Options Work
Options are like insurance. Imagine you own a house worth ₹50 lakh and buy insurance. You pay a small premium so that if the house burns down, you can recover your value. Similarly:
A call option is like paying for the right to buy a stock cheaper later.
A put option is like insurance against stock prices falling.
Harmonic Patterns

Part 1 Master Candlestick PatternIntroduction to Options Trading
Options trading is one of the most powerful tools in the financial markets. Unlike traditional stock trading, where you buy or sell shares directly, options allow you to control an asset without owning it outright. This gives traders flexibility, leverage, and a wide range of strategies for both profits and risk management.
At its core, an option is a contract that gives the buyer the right, but not the obligation, to buy or sell an underlying asset at a specific price (called the strike price) on or before a certain date (the expiration date).
The beauty of options lies in choice: you can profit whether markets are rising, falling, or even staying flat—if you know how to use them.
What is an Option?
An option is a derivative instrument, meaning its value is derived from the price of another asset (the “underlying”), such as:
Stocks (e.g., Reliance, Apple)
Indexes (e.g., Nifty, S&P 500)
Commodities (e.g., Gold, Oil)
Currencies
Two Main Types of Options:
Call Option – Gives the right to buy the underlying asset.
Put Option – Gives the right to sell the underlying asset.
Example:
A call option on Reliance with a strike price of ₹2500 expiring in one month gives you the right (not the obligation) to buy Reliance shares at ₹2500, regardless of the market price.
A put option with a strike of ₹2500 gives you the right to sell at ₹2500.

Common Mistakes New Traders Make1. Jumping into Trading Without Education
Many beginners dive into trading after watching a few YouTube videos, following tips from social media, or hearing success stories of others. But trading isn’t about luck — it’s about skill, discipline, and strategy.
Mistake: Believing trading is just buying low and selling high.
Reality: Trading requires understanding technical analysis, risk management, psychology, and market structure.
Example: A new trader hears about a stock that doubled in a week. They buy without research, but by the time they enter, the stock has already peaked. The price crashes, and they lose money.
Solution: Treat trading like a profession. Just as a doctor or engineer studies for years, a trader needs structured learning — books, courses, simulations, and practice before putting real money at risk.
2. Trading Without a Plan
Imagine playing a cricket match without a game plan — chaos is guaranteed. Similarly, trading without a clear plan leads to impulsive decisions.
Mistake: Buying and selling based on emotions or news without rules.
Reality: Successful traders have a written trading plan that defines entries, exits, position size, and risk per trade.
Example: A beginner sees a stock rising sharply and enters. But when it drops, they don’t know whether to cut losses or hold. Confusion results in bigger losses.
Solution: Build a trading plan that answers:
What markets will I trade?
What timeframes will I use?
What setups will I look for?
How much capital will I risk?
When will I exit with profit/loss?
3. Overtrading
New traders often fall into the trap of taking too many trades, thinking more trades mean more profits. In reality, overtrading drains both money and mental energy.
Mistake: Trading every small market move, chasing excitement.
Reality: Professional traders wait patiently for high-probability setups.
Example: A trader makes 15 trades in a single day, paying high brokerage and making impulsive decisions. Even if a few trades win, commissions and losses wipe out gains.
Solution: Quality over quantity. Focus on one or two good setups a day/week instead of chasing every move.
4. Lack of Risk Management
This is perhaps the biggest mistake new traders make. They risk too much on a single trade, hoping for quick riches.
Mistake: Betting 30–50% of capital on one stock/option.
Reality: Risk per trade should usually be 1–2% of total capital.
Example: A trader with ₹1,00,000 puts ₹50,000 into one stock. The stock falls 20%, wiping out ₹10,000 in one trade. After a few such losses, the account is destroyed.
Solution: Use stop-loss orders, risk only small amounts per trade, and accept losses as part of the game.
5. Revenge Trading
After a loss, beginners often feel the need to “make back money quickly.” This emotional reaction leads to revenge trading — entering bigger trades without logic.
Mistake: Trading emotionally after a loss.
Reality: Losses are normal; chasing them increases damage.
Example: A trader loses ₹5,000 in the morning. Angry, they double their position size in the next trade. The market goes against them again, and they lose ₹15,000 more.
Solution: Step away after a loss. Review what went wrong. Never increase position size just to recover money.
6. Lack of Patience
Trading rewards patience, but beginners crave fast profits. They exit winners too early or hold losers too long.
Mistake: Taking profits too soon, cutting winners; holding losers, hoping they turn.
Reality: Let profits run, cut losses quickly.
Example: A stock moves up 2%, and the trader books profit, missing a 10% rally. But when a trade goes down 5%, they refuse to sell, and the loss grows to 20%.
Solution: Trust your trading system. Follow stop-loss and target levels.
7. Following Tips & Rumors
Many new traders blindly follow WhatsApp tips, Twitter posts, or “friend’s advice” without analysis.
Mistake: Relying on others for buy/sell calls.
Reality: Tips may work occasionally but are not reliable long-term.
Example: A trader buys a “hot stock” from a group. The stock spikes briefly but crashes because big players offload positions.
Solution: Do your own research. Build conviction based on analysis, not rumors.
8. Ignoring Trading Psychology
The market is a battle of emotions — fear, greed, hope, and regret. Beginners often underestimate psychology.
Mistake: Thinking trading is 100% about strategy.
Reality: Psychology is often more important than strategy.
Example: Two traders have the same system. One sticks to rules, the other panics and exits early. The disciplined trader profits; the emotional one doesn’t.
Solution: Practice emotional control. Meditation, journaling, and self-awareness help.
9. No Record Keeping
Many beginners don’t track their trades, so they repeat mistakes.
Mistake: Trading without keeping a log.
Reality: A trading journal reveals strengths and weaknesses.
Example: A trader keeps losing in intraday trades but doesn’t realize it because they don’t track results.
Solution: Maintain a trading journal with details: entry, exit, reason for trade, result, and lessons learned.
10. Unrealistic Expectations
Movies, social media, and success stories create a false impression of overnight riches. Beginners expect to double their account in weeks.
Mistake: Believing trading is a shortcut to wealth.
Reality: Trading is a long-term skill, and returns grow with discipline.
Example: A trader starts with ₹50,000 and expects to make ₹10,000 a day. They take huge risks, lose capital, and quit.
Solution: Aim for consistent small profits. Even 2–3% monthly growth compounds into wealth.
11. Poor Money Management
Beginners often don’t allocate capital wisely. They put most money in risky trades, leaving nothing for better opportunities.
Solution: Diversify across trades, keep emergency funds, and never put all money into one asset.
12. Not Understanding Market Conditions
Markets change — trending, ranging, or volatile. Beginners apply the same strategy everywhere.
Example: A breakout strategy may work in trending markets but fail in sideways ones.
Solution: Learn to read market context (volume profile, trend, volatility). Adapt strategies accordingly.
13. Overconfidence After Wins
A few successful trades can make beginners feel invincible. They increase position sizes drastically, only to face big losses.
Solution: Stay humble. Stick to your plan regardless of wins or losses.
14. Fear of Missing Out (FOMO)
FOMO is powerful in trading. Beginners see a stock rallying and jump in late, only to catch the top.
Solution: Accept that missing trades is normal. The market always offers new opportunities.
15. Lack of Continuous Learning
Markets evolve. Strategies that worked last year may fail now. Beginners often stop learning after early success.
Solution: Keep learning — read books, backtest strategies, and follow market news.
16. Mixing Investing with Trading
Beginners often hold losing trades, calling them “long-term investments.” This blurs strategy.
Solution: Separate trading and investing accounts. Stick to timeframes and plans.
17. Ignoring Risk-Reward Ratio
Many beginners take trades where the potential reward is smaller than the risk.
Example: Risking ₹1,000 for a possible profit of ₹200. Even if right most times, losses eventually dominate.
Solution: Take trades with at least 1:2 or 1:3 risk-reward ratio.
18. Not Practicing in Simulation
Jumping into live markets without demo practice is costly.
Solution: Use paper trading or demo accounts first to build skills without losing money.
19. Not Respecting Stop-Loss
Beginners often remove or widen stop-losses, hoping the trade will reverse.
Solution: Treat stop-loss like a safety belt. It protects you from disasters.
20. Quitting Too Soon
Many traders quit after a few losses, never giving themselves a chance to grow.
Solution: Accept that trading mastery takes years. Losses are tuition fees for market education.
Conclusion
Trading is not a sprint but a marathon. Almost every beginner repeats these mistakes: overtrading, poor risk management, revenge trading, following tips, and ignoring psychology. The good news is that mistakes are stepping stones to mastery — if you learn from them.
By approaching trading with education, discipline, patience, and humility, new traders can avoid the traps that wipe out most beginners and build a path toward consistent profits.

Trading Plan & JournalingIntroduction
The financial markets are often described as a battlefield where only the disciplined survive. Traders from all walks of life enter this arena, each armed with different strategies, mindsets, and risk appetites. However, history shows that the majority of traders lose money in the long run—not because the markets are unbeatable, but because they lack structure and discipline.
Two of the most powerful tools for achieving consistency and long-term profitability are:
A Trading Plan – the strategic blueprint that guides every action in the market.
A Trading Journal – the mirror that reflects one’s behavior, decisions, and growth as a trader.
Together, they form the foundation of professional trading. Without them, traders are prone to emotional decision-making, impulsive trades, and recurring mistakes.
This guide will deeply explore both concepts in detail, breaking them into digestible parts, supported by examples, techniques, and psychological insights.
Part I – The Trading Plan
1. What is a Trading Plan?
A trading plan is a written, structured framework that outlines how a trader will approach the market. It defines entry and exit strategies, risk management rules, trading goals, and performance evaluation metrics.
Think of it as the business plan of a trader. Just like a company can’t run without a business plan, a trader cannot succeed long term without a trading plan.
2. Why Do You Need a Trading Plan?
Eliminates guesswork – prevents random or impulsive trades.
Brings consistency – ensures that you execute your strategy the same way every time.
Controls emotions – reduces the impact of fear and greed.
Improves risk management – avoids catastrophic losses.
Helps evaluation – allows you to track results and refine your strategy.
Without a trading plan, traders end up chasing tips, rumors, and news blindly—leading to inconsistent results.
3. Components of a Trading Plan
A solid trading plan should cover the following areas:
A. Personal Assessment
Before crafting strategies, a trader must understand themselves.
Risk tolerance – how much can you afford to lose per trade?
Time availability – are you a full-time day trader, part-time swing trader, or long-term investor?
Psychological strengths and weaknesses – are you patient, disciplined, or easily distracted?
B. Market Selection
Define which markets and instruments you will trade:
Equities (large-cap, mid-cap, small-cap)
Forex
Commodities
Indices
Options & derivatives
Focusing on a limited set of instruments helps you specialize rather than becoming a jack of all trades.
C. Trading Strategy
This section answers the “How” of trading.
Technical approach (candlestick patterns, moving averages, volume profile, market structure).
Fundamental analysis (earnings reports, macroeconomic data).
Hybrid approach (combining both).
Each setup should be clearly defined:
Conditions for entry.
Stop-loss placement.
Profit targets or trailing stops.
Position-sizing rules.
D. Risk & Money Management
The most crucial element. Decide:
Maximum risk per trade (commonly 1–2% of account size).
Maximum daily/weekly drawdown before stopping.
Position sizing formula (e.g., fixed percentage, volatility-based sizing).
Risk-reward ratio (minimum 1:2 or better).
E. Trade Management
Scaling in and out of trades.
Adjusting stop-loss as price moves in your favor.
Handling trades that gap overnight.
F. Trading Schedule
Decide when you’ll trade:
Day trading → during market hours.
Swing trading → end-of-day analysis.
Long-term investing → weekly/monthly review.
G. Performance Evaluation
Set measurable goals:
Win rate (%)
Average profit per trade
Risk-reward ratio
Monthly return target
Maximum acceptable drawdown
4. Example of a Simple Trading Plan
Trader Type: Swing trader
Market: Nifty 50 stocks
Strategy: Trade only bullish engulfing & hammer candlestick patterns near support zones.
Entry Rule: Buy at confirmation candle with above-average volume.
Stop-loss: Below support or candle low.
Target: 2x risk.
Risk Management: 1% per trade, max 3 trades per day.
Review: Weekly journal analysis to refine entries/exits.
5. Mistakes Traders Make with Trading Plans
Not writing it down (keeping it “in the head”).
Overcomplicating strategies.
Ignoring rules when emotions take over.
Constantly changing the plan after small losses.
A plan only works if you follow it with discipline.
Part II – The Trading Journal
1. What is a Trading Journal?
A trading journal is a written or digital record of all trades taken, along with notes on reasoning, emotions, and outcomes. It’s like a diary for traders, where every action in the market is logged for review.
2. Why Keep a Trading Journal?
Identifies strengths & weaknesses – shows what’s working and what isn’t.
Tracks emotional state – helps detect patterns of impulsive trades.
Improves accountability – forces you to justify every trade.
Sharpens discipline – prevents repeating mistakes.
Boosts confidence – reinforces good habits by showing progress.
3. Components of a Trading Journal
A good journal records both quantitative and qualitative data.
Quantitative Data (Numbers):
Date & time of trade
Asset traded
Entry price, exit price, stop-loss, target
Position size
Profit/loss in % and amount
Risk-reward ratio
Qualitative Data (Thoughts & Emotions):
Reason for taking trade
Market conditions (trend, volatility, news)
Emotional state (confident, fearful, greedy)
Mistakes made (if any)
Lessons learned
4. Tools for Trading Journaling
Excel/Google Sheets – customizable, easy to analyze.
TradingView screenshots – annotate charts for visual learning.
Dedicated software – Edgewonk, TraderSync, or simple Notion templates.
Pen & paper – traditional, but effective for emotional notes.
5. Example Trading Journal Entry
Date: 20 Aug 2025
Stock: Infosys
Setup: Bullish engulfing near 200 DMA + support zone.
Entry: ₹1550
Stop-loss: ₹1530
Target: ₹1590 (2:1 RR)
Result: Exited at ₹1585, profit ₹35/share.
Emotion: Felt confident but exited early due to fear of reversal.
Lesson: Stick to plan; don’t book profits too soon.
6. Reviewing Your Journal
The real power of journaling lies in reviewing it regularly.
End of week → review all trades taken.
End of month → calculate win rate, average RR, emotional mistakes.
Quarterly → refine strategy based on data.
Patterns will emerge. For example:
You may find most profits come from trend-following trades, while counter-trend trades lose money.
You may notice losses increase when you trade after 3 consecutive wins (overconfidence).
You may realize that impulsive entries happen more often when you skip morning preparation.
7. Common Mistakes with Journals
Not recording losing trades (only writing about wins).
Writing vague reasons (“felt good about this trade”).
Not reviewing the journal frequently.
Treating it as a chore instead of a learning tool.
Part III – Psychology, Discipline & Growth
A trading plan and journal are useless without the right mindset.
1. Emotional Control
Markets constantly test patience, greed, and fear. A plan provides structure, while a journal helps spot recurring psychological pitfalls.
2. The Role of Discipline
Discipline is simply the act of sticking to your plan regardless of temptation. The journal is your accountability partner.
3. Growth Mindset
Losses are inevitable. Journaling turns losses into lessons, making them investments in education rather than failures.
4. The Feedback Loop
Execute trades according to plan.
Record them in the journal.
Review & identify improvements.
Refine the trading plan.
This cycle creates continuous improvement.
Part IV – Practical Tips for Success
Start simple – don’t overload your plan/journal with unnecessary data.
Use screenshots – visual memory is stronger than written notes.
Reward yourself – celebrate when you stick to your plan, even on losing trades.
Keep emotions in check – note them honestly, even if embarrassing.
Backtest strategies – before adding to your plan, test them historically.
Conclusion
A trader without a plan and journal is like a ship sailing without a compass—drifting aimlessly in stormy seas. The combination of a well-structured trading plan and a disciplined journaling practice transforms trading from a gamble into a business.
The plan gives direction.
The journal provides feedback.
Together, they create consistency, accountability, and growth.
Successful trading is not about predicting the market perfectly—it’s about managing risk, executing with discipline, and learning continuously.
If you dedicate yourself to creating and following your trading plan, while diligently maintaining a journal, you’ll find yourself ahead of 90% of traders who rely solely on intuition.

Part3 Trading MasterclassOption Trading vs Stock Trading
Stocks = Ownership, long-term growth, dividends.
Options = Contracts, leverage, flexible strategies.
Stocks = Simpler, but capital-intensive.
Options = Complex, but require less capital and offer hedging.
For example:
Buying 100 shares of Reliance at ₹2500 = ₹2,50,000.
Buying 1 call option of Reliance at ₹100 premium with lot size 250 = only ₹25,000.
This leverage makes options attractive—but also riskier.
Real-Life Examples & Case Studies
Case 1: Bull Market
A trader buys Nifty 20000 Call at ₹200 premium. Nifty rallies to 20500. Profit = ₹300 (500 – 200). Huge return on a small premium.
Case 2: Bear Market
Investor holds TCS shares but fears a fall. Buys a protective put. When stock drops, put increases in value, reducing losses.
Case 3: Neutral Market
Trader sells an Iron Condor on Bank Nifty, betting price will stay range-bound. Premium collected = profit if market stays sideways.

Part 1 Trading MasterclassRisks & Rewards in Option Trading
Option trading can be thrilling, but it’s not without risks.
For Buyers:
Maximum loss = premium paid.
Maximum profit = potentially unlimited (for calls) or huge (for puts).
For Sellers:
Maximum gain = premium received.
Maximum loss = unlimited (for calls) or very large (for puts).
Risks also come from:
Time decay (options lose value daily).
Volatility crush (sudden drop in implied volatility can reduce premiums).
Liquidity issues (wide bid-ask spreads can hurt execution).
That’s why risk management (stop-losses, proper sizing, hedging) is crucial.
Option Trading vs Stock Trading
Stocks = Ownership, long-term growth, dividends.
Options = Contracts, leverage, flexible strategies.
Stocks = Simpler, but capital-intensive.
Options = Complex, but require less capital and offer hedging.
For example:
Buying 100 shares of Reliance at ₹2500 = ₹2,50,000.
Buying 1 call option of Reliance at ₹100 premium with lot size 250 = only ₹25,000.
This leverage makes options attractive—but also riskier.

Divergence SecretsRisks & Rewards in Option Trading
Option trading can be thrilling, but it’s not without risks.
For Buyers:
Maximum loss = premium paid.
Maximum profit = potentially unlimited (for calls) or huge (for puts).
For Sellers:
Maximum gain = premium received.
Maximum loss = unlimited (for calls) or very large (for puts).
Risks also come from:
Time decay (options lose value daily).
Volatility crush (sudden drop in implied volatility can reduce premiums).
Liquidity issues (wide bid-ask spreads can hurt execution).
That’s why risk management (stop-losses, proper sizing, hedging) is crucial.
Option Trading vs Stock Trading
Stocks = Ownership, long-term growth, dividends.
Options = Contracts, leverage, flexible strategies.
Stocks = Simpler, but capital-intensive.
Options = Complex, but require less capital and offer hedging.
For example:
Buying 100 shares of Reliance at ₹2500 = ₹2,50,000.
Buying 1 call option of Reliance at ₹100 premium with lot size 250 = only ₹25,000.
This leverage makes options attractive—but also riskier.

Option Trading Option Pricing & The Greeks
Options are not priced randomly. Their value comes from several factors:
Intrinsic Value: The real, tangible value (difference between stock price and strike).
Time Value: Extra premium paid for the possibility of future movement.
Volatility: The higher the uncertainty, the higher the option premium.
Option Greeks – the essential toolkit:
Delta – Measures how much an option’s price changes with a change in stock price. (Think: sensitivity to price).
Gamma – Measures how much Delta itself changes.
Theta – Time decay. Shows how much an option loses value each day as expiration approaches.
Vega – Sensitivity to volatility. Higher volatility = higher option price.
Rho – Sensitivity to interest rates (less relevant for short-term traders).
Understanding Greeks is like knowing the gears of a car—they help control risk.
Option Trading Strategies
Here’s where things get exciting. Options are like Lego blocks—you can combine them in different ways to create powerful strategies.
A. Basic Strategies
Buying Calls – Bullish bet.
Buying Puts – Bearish bet.
Covered Call – Holding a stock and selling calls to earn income.
Protective Put – Owning stock and buying puts to insure against loss.
B. Intermediate Strategies
Straddle – Buy a call + put at same strike, betting on big movement (either direction).
Strangle – Similar to straddle but different strikes, cheaper.
Bull Call Spread – Buy one call, sell a higher strike call. Profits capped but cheaper.
Bear Put Spread – Buy a put, sell lower strike put.
C. Advanced Strategies
Iron Condor – Selling an OTM call spread + OTM put spread, betting on low volatility.
Butterfly Spread – Combining multiple options to profit if stock stays near a target price.
Calendar Spread – Exploiting time decay by selling short-term and buying long-term options.
Each strategy has a risk-reward profile and works best in specific market conditions.

Part 2 Support and ResistanceHow Options Work
Let’s break it down simply:
If you buy a call, you are betting that the price of the stock will go up.
If you buy a put, you are betting that the price of the stock will go down.
If you sell (write) a call, you are taking the opposite bet—that the stock won’t rise much.
If you sell (write) a put, you are betting that the stock won’t fall much.
Here’s a quick example:
Stock XYZ trades at ₹100.
You buy a 1-month call option with a strike price of ₹105 by paying a ₹5 premium.
If the stock rises to ₹120, your option is worth ₹15 (120 – 105). Since you paid ₹5, your profit = ₹10.
If the stock stays below ₹105, the option expires worthless, and you lose your premium of ₹5.
This example shows that options can magnify profits if you’re right, but they can also cause losses (limited to the premium paid for buyers, unlimited for sellers).
Types of Options
A. Call Options
Right to buy.
Used when you expect prices to rise.
Buyers have limited risk (premium) but unlimited upside.
Sellers (writers) have limited gain (premium received) but unlimited risk.
B. Put Options
Right to sell.
Used when you expect prices to fall.
Buyers have limited risk but big upside if stock falls sharply.
Sellers have limited gain (premium) but large risk if stock collapses.

Part 1 Support and Resistance1. Introduction to Options
In the world of financial markets, traders and investors use various tools to manage risk, speculate on price movements, or generate additional income. One of the most powerful and flexible tools is options trading.
An option is a financial derivative, which means its value is derived from another underlying asset. This underlying asset could be a stock, an index, a commodity, or even a currency. Unlike stocks, where you own a piece of the company, an option is a contract that gives you certain rights related to buying or selling the underlying asset at a specific price and within a specified time.
Options are incredibly versatile. Traders use them for hedging (protection against loss), speculation (betting on future price moves), or income generation (selling options for premiums). But with great flexibility comes complexity, and that’s why understanding option trading deeply is essential before jumping in.
2. Basic Terminology in Option Trading
Before diving deep, let’s clear some essential terms:
Call Option: A contract giving the right (not obligation) to buy an asset at a predetermined price (strike price) before expiration.
Put Option: A contract giving the right (not obligation) to sell an asset at a predetermined price before expiration.
Strike Price: The fixed price at which the option holder can buy (for calls) or sell (for puts) the underlying.
Premium: The cost of purchasing an option contract. This is the price paid upfront by the buyer to the seller (writer).
Expiration Date: The date when the option contract expires. After this, the option becomes worthless if not exercised.
In the Money (ITM): An option that has intrinsic value. For calls, when the stock price > strike price. For puts, when stock price < strike price.
Out of the Money (OTM): An option with no intrinsic value (only time value). For calls, stock price < strike price. For puts, stock price > strike price.
At the Money (ATM): When the stock price and strike price are roughly equal.
Option Writer: The seller of the option contract. They receive the premium but take on obligation.
Lot Size: Options are traded in fixed quantities called lots (e.g., 50 or 100 shares per contract depending on the market).
Understanding these terms is like learning the alphabet before writing sentences—you need them to progress.

Money and Mind in Trading1. Introduction
Trading is often viewed as a battle between the trader and the market. But in reality, the market is neutral—it doesn’t care about you, your opinions, or your predictions. The true battle is internal, between your money (how you manage your capital) and your mind (how you handle emotions and psychology).
Think about this:
A trader with a brilliant strategy but poor money management will eventually lose all capital.
A trader with enough money but a weak mindset will panic and make irrational moves.
Only when money management and psychological discipline align, can trading become consistently profitable.
Thus, the formula for success in trading can be summarized as:
Trading Success = Money Management × Mind Management × Strategy
2. The Role of Money in Trading
a) Importance of Capital
Money is the fuel of trading. Without adequate capital, even the best strategies can fail.
Undercapitalized traders often take excessive risks to make meaningful returns.
Well-capitalized traders can afford patience, better position sizing, and discipline.
For example, if you only have ₹10,000, risking ₹5,000 on a single trade feels tempting but dangerous. With ₹10 lakh, you can risk just 1% per trade and still earn consistently without emotional stress.
b) Risk Management
Risk management is about protecting capital first and focusing on profits second.
Golden rules:
Never risk more than 1-2% of capital per trade.
Always set a stop-loss before entering.
Diversify trades instead of going “all in.”
This ensures survival. Because in trading, survival = opportunity to win tomorrow.
c) Position Sizing
Position sizing determines how much to trade given your account size and risk tolerance.
Formula example:
If you have ₹1,00,000 capital and risk 1% per trade (₹1,000), and your stop-loss is ₹10 per share, you can buy 100 shares (₹1,000 ÷ ₹10).
This systematic approach removes emotional guessing.
d) Compounding and Capital Growth
The real wealth in trading comes from compounding small gains consistently.
A trader making 1% per week can grow capital by over 67% annually (with compounding).
Patience + consistency beats “get rich quick.”
e) Common Money Mistakes in Trading
Over-leverage (borrowing excessively to trade).
No risk/reward planning.
Chasing losses (“revenge trading”).
Putting all money in one stock/option.
Trading without capital backup (no emergency funds).
Money mistakes often lead to psychological pressure, which worsens decision-making.
3. The Role of Mind in Trading
If money is the fuel, then the mind is the driver. Even with perfect capital management, a weak mindset can wreck results.
a) Psychology of Decision-Making
Trading decisions are influenced by:
Fear – “What if I lose?”
Greed – “Let me hold longer for bigger profit.”
Hope – “Maybe it will recover.”
Regret – “I should’ve sold earlier.”
These emotions distort rational thinking.
b) Common Psychological Biases
Overconfidence Bias – After a few wins, traders feel invincible.
Loss Aversion – People hate losing ₹1 more than they enjoy gaining ₹1.
Confirmation Bias – Seeking news that supports your view while ignoring opposite evidence.
Gambler’s Fallacy – Believing a losing streak must end soon.
Recognizing these biases helps neutralize them.
c) Discipline Factor
Discipline = Following your trading plan no matter what.
Without discipline, traders exit winners too early and hold losers too long.
With discipline, traders follow stop-loss, stick to risk per trade, and wait for setups.
d) Patience vs Impulsiveness
Great trades don’t appear daily. Impulsive traders overtrade, while patient traders wait for high-probability setups.
As Jesse Livermore said: “It was never my thinking that made me money. It was always my sitting.”
e) Building Mental Resilience
Trading is stressful because of uncertainty. To build resilience:
Accept that losses are part of the game.
Detach ego from trades.
Focus on the process, not outcome.
Develop habits outside trading (exercise, meditation, journaling).
4. The Money-Mind Connection
Money and mind are deeply linked in trading:
Lack of money → stress, fear, over-leverage.
Too much greed for money → reckless decisions.
Emotional mind → bad money management.
Example: A trader with ₹20,000 risks ₹10,000 in a single option trade. Why? The mind says: “I need quick profits.” But when the trade goes against him, fear takes over and he exits at maximum loss. This is the money-mind trap.
Thus, the solution is balance:
Adequate capital.
Strict money management.
Calm psychology.
5. Practical Framework: Money + Mind Balance
Here’s a practical blueprint:
Step 1: Define Capital Rules (Money)
Risk per trade: 1% of account.
Risk per day: 3% max.
Keep emergency funds separate.
Step 2: Define Psychological Rules (Mind)
Accept losses without revenge trading.
No overtrading after big wins.
Stick to trading hours and avoid burnout.
Step 3: Journaling
Keep a trading journal tracking not just trades, but also your emotions. Example:
“Exited early due to fear.”
“Didn’t follow plan because of greed.”
This self-awareness improves both money and mind management.
6. Case Studies & Examples
Case 1: The Undisciplined Trader
Rahul starts with ₹50,000. He risks ₹20,000 on a single option trade. It fails. Capital halves. In desperation, he doubles down and loses everything.
Lesson: Poor money management + emotional revenge trading = wipeout.
Case 2: The Disciplined Trader
Meera starts with ₹1,00,000. She risks only 1% per trade. She loses 5 trades in a row, but her account is still ₹95,000. On the 6th trade, she wins 5R (₹5,000). Net balance: profit.
Lesson: Risk control and patience protect the trader until a winning streak comes.
7. Conclusion: The Balanced Trader’s Blueprint
Trading is not just charts, patterns, or strategies. It is a test of two inner resources:
Money – How you allocate, risk, and grow your capital.
Mind – How you manage emotions, discipline, and psychology.
Without money, you can’t trade. Without the right mind, you can’t trade successfully. Together, they form the foundation of long-term trading success.
The secret is not to chase quick riches, but to survive, grow steadily, and let compounding work. And survival comes only when your money rules protect your capital and your mind rules protect you from yourself.
In short: Master the money, master the mind, and the market will reward you.
Difference Between Investing and TradingIntroduction
In the world of finance, two of the most common approaches people take to grow their wealth are investing and trading. At first glance, these two activities may look similar—both involve putting money into financial instruments like stocks, bonds, mutual funds, or derivatives with the aim of making a profit. However, when we look deeper, the philosophies, time horizons, risk appetites, strategies, and outcomes of investing and trading are very different.
To put it simply:
Investing is about building wealth steadily over time, often with a long-term horizon.
Trading is about taking advantage of short-term opportunities in the market to generate quick returns.
Understanding the difference is essential because choosing the wrong path for your personality, goals, and risk tolerance can not only hurt your financial performance but also cause emotional stress.
This essay will take you through a detailed journey into what investing and trading mean, their similarities, differences, strategies, risks, psychology, and real-world examples, so you can decide which path (or combination) best suits you.
What is Investing?
Investing is the act of committing money for the long term with the expectation of receiving returns in the future. Investors typically focus on assets that are expected to grow steadily over years or decades, such as:
Stocks (Equities) – Shares in companies that appreciate over time and may pay dividends.
Bonds – Fixed-income securities that provide interest.
Mutual Funds/ETFs – Diversified portfolios managed by professionals.
Real Estate – Property investments that generate rental income and appreciate.
Commodities & Precious Metals – Gold, silver, etc., often used as hedges.
The core philosophy of investing is wealth accumulation through compounding. Albert Einstein famously called compounding the "eighth wonder of the world," and investors rely on this principle.
For example:
If you invest ₹1,00,000 at a 12% annual return (average Indian equity market return), in 20 years it grows to over ₹9,64,000. That’s the power of compounding without needing to buy and sell constantly.
Types of Investing
Value Investing – Buying undervalued stocks (e.g., Warren Buffett).
Growth Investing – Focusing on high-growth companies (e.g., tech firms).
Dividend Investing – Choosing companies with steady dividend payouts.
Index/Passive Investing – Investing in index funds for market-average returns.
Mindset of an Investor
Patient, long-term focused.
More concerned with company fundamentals than short-term price moves.
Sees market downturns as opportunities.
“Buy and hold” is the mantra.
What is Trading?
Trading is the act of buying and selling financial instruments within shorter timeframes to capture profits from market fluctuations. Unlike investing, traders don’t usually care about the long-term potential of an asset; they focus on short-term movements driven by demand-supply, news, or technical patterns.
Common Trading Styles
Scalping – Holding positions for seconds to minutes.
Day Trading – Buying and selling within a single trading day.
Swing Trading – Holding for days or weeks to capture medium-term trends.
Position Trading – Holding for weeks to months (a mix between trading and investing).
Tools Traders Use
Technical Analysis: Chart patterns, indicators (RSI, MACD, Bollinger Bands).
Volume Analysis: Understanding buying/selling pressure.
News & Events: Earnings announcements, Fed decisions, global crises.
Risk Management: Stop-loss, position sizing, leverage control.
Mindset of a Trader
Short-term profit focused.
Quick decision-making and adaptability.
High tolerance for risk and volatility.
Needs discipline and emotional control.
Strategies in Investing vs Trading
Investing Strategies
Buy and Hold – Holding quality stocks for decades.
SIP (Systematic Investment Plan) – Regular investments in mutual funds.
Portfolio Diversification – Reducing risk by spreading across assets.
Rebalancing – Adjusting portfolio periodically.
Trading Strategies
Momentum Trading – Riding strong trends.
Breakout Trading – Entering when price breaks support/resistance.
Mean Reversion – Betting price will revert to its average.
Options Strategies – Using derivatives like straddles, spreads, iron condors.
Risks in Investing vs Trading
Investing Risks
Market crashes (e.g., 2008, 2020).
Inflation risk eroding returns.
Poor stock selection (choosing weak companies).
Overconcentration in one asset.
Trading Risks
High volatility losses.
Leverage amplifying both gains and losses.
Overtrading and emotional decisions.
Sudden news shocks (war, government bans).
Key difference: Investors lose slowly, traders can lose instantly.
Psychology of Investing vs Trading
Investor Psychology: Requires patience, belief in long-term growth, ability to ignore short-term volatility. Successful investors avoid panic-selling.
Trader Psychology: Requires emotional discipline, quick thinking, sticking to risk limits, and accepting frequent small losses. Greed and fear are dangerous here.
Both require discipline, but in different ways.
Case Studies
Case Study 1: Investor Success
Warren Buffett invested in Coca-Cola in 1988.
Initial investment: $1.3 billion.
Today’s value: Over $25 billion plus billions in dividends.
Lesson: Patience and compounding create massive wealth.
Case Study 2: Trader Success
Paul Tudor Jones, a famous trader, predicted the 1987 crash.
He shorted the market and earned around $100 million in one day.
Lesson: Quick action, timing, and risk management can lead to big rewards.
Case Study 3: Investor Loss
Many who invested in companies like Enron or Yes Bank without research faced near-total losses.
Case Study 4: Trader Loss
Retail traders using high leverage during COVID crash wiped out accounts overnight.
Which is Better – Investing or Trading?
There’s no universal answer—it depends on your goals:
If you want steady long-term wealth → Choose Investing.
If you want active income and thrill → Choose Trading (but master risk control).
Many professionals do a mix: 80% long-term investing, 20% trading for extra income.
Conclusion
The difference between investing and trading lies in time horizon, mindset, risk tolerance, and strategy. Investing is like planting a tree and waiting for it to grow into a forest. Trading is like surfing waves—you ride them quickly, but must always be alert.
Both paths can be profitable, but both come with risks. The key is knowing yourself: Are you patient and disciplined for long-term gains, or energetic and risk-tolerant for short-term opportunities?
Ultimately, wealth creation often comes from investing, while trading can generate active cash flow if done with discipline. The wisest approach may be blending the two—secure your future with investments, and fuel your present with well-managed trading.
Day Trading vs Swing Trading: A Deep-Dive ComparisonIntroduction
When it comes to trading in the stock market, there are countless strategies, styles, and approaches that traders adopt. Two of the most popular methods among retail and professional traders are day trading and swing trading. Both strategies aim to generate profits from short-term price fluctuations in stocks, forex, commodities, or cryptocurrencies, but they differ significantly in execution, mindset, risk, and lifestyle requirements.
Choosing between day trading and swing trading is like choosing between sprinting and middle-distance running. Both involve running, but the pace, stamina, and strategies differ. Similarly, both day traders and swing traders thrive on short-term price moves, but the way they participate in the market is fundamentally different.
This article explores day trading vs swing trading in depth, covering definitions, key characteristics, advantages, risks, required skills, tools, psychology, and a balanced conclusion to help traders decide which style suits them best.
Chapter 1: Understanding Day Trading
What is Day Trading?
Day trading is the practice of buying and selling financial instruments within the same trading day, often closing all positions before the market closes. The objective is to capture small but frequent price movements. Day traders rarely hold trades overnight, minimizing exposure to overnight risks such as gaps, earnings announcements, or global events.
Characteristics of Day Trading
High Trade Frequency – Dozens or even hundreds of trades per day.
Small Profit Margins – Aim for a few points, ticks, or basis points per trade.
Intra-Day Charts – 1-minute, 5-minute, 15-minute, and sometimes hourly charts are heavily used.
Fast Execution – Requires speed, precision, and often advanced trading software.
Capital Requirement – Higher margins or regulatory requirements (e.g., pattern day trading rule in the U.S.).
Typical Day Trader Workflow
Pre-market preparation: Analyzing news, earnings reports, and economic data.
Identifying setups: Using technical indicators, price action, or order flow.
Executing trades: Entering and exiting within minutes or hours.
Risk control: Using tight stop-losses, rarely risking more than 1-2% per trade.
Closing all positions: No overnight holdings.
Example
A day trader sees a stock break above a pre-market resistance level. They buy 500 shares at ₹200, sell them within 15 minutes at ₹202, making ₹1,000 profit. They repeat this process multiple times daily.
Chapter 2: Understanding Swing Trading
What is Swing Trading?
Swing trading is the practice of holding trades for several days to weeks to capture medium-term market moves. Swing traders exploit market “swings” caused by supply-demand imbalances, news-driven momentum, or technical setups.
Characteristics of Swing Trading
Lower Trade Frequency – A few trades per week or month.
Larger Profit Targets – Aim for 5–20% moves, sometimes more.
Daily & Weekly Charts – Focus on higher timeframes like 1D, 4H, or weekly charts.
Overnight Exposure – Positions are held through overnight gaps, earnings, or news.
Capital Efficiency – Can trade with smaller accounts due to lower frequency and lower transaction costs.
Typical Swing Trader Workflow
Scanning markets: Identifying trends, consolidations, or breakouts.
Entry timing: Using technical levels (support/resistance, moving averages).
Position holding: Holding trades for days/weeks until targets are hit.
Risk management: Stop-losses wider than day trading, but risk per trade is carefully calculated.
Review & rebalance: Adjusting positions based on new data or chart setups.
Example
A swing trader notices a stock forming a bullish cup-and-handle pattern. They buy at ₹200 with a stop-loss at ₹190 and a target of ₹230. The trade takes 10 days to hit the target, yielding a 15% profit.
Chapter 3: Advantages & Disadvantages
Advantages of Day Trading
No Overnight Risk – No exposure to after-hours events.
Daily Income Potential – Consistent profits if disciplined.
Leverage Opportunities – Brokers often provide higher intraday leverage.
Skill Development – Sharpens quick decision-making and execution.
Disadvantages of Day Trading
High Stress & Intensity – Demanding lifestyle, mentally exhausting.
High Transaction Costs – Frequent trades increase brokerage and taxes.
Steep Learning Curve – Requires years of practice.
Capital Restrictions – Some markets impose minimum balances (e.g., $25,000 in U.S. for PDT rule).
Advantages of Swing Trading
Flexibility – Suitable for part-time traders with jobs.
Bigger Profit Margins – Larger gains per trade.
Less Stress – No need to watch every tick.
Lower Costs – Fewer transactions, lower fees.
Disadvantages of Swing Trading
Overnight & Weekend Risk – Gap risk due to news or global events.
Slower Results – Waiting days/weeks for trade resolution.
Discipline Required – Avoiding emotional exits during volatility.
Dependence on Trends – Works best in trending markets, struggles in choppy sideways markets.
Chapter 4: Required Skills
Skills for Day Traders
Technical Mastery: Reading candlestick patterns, order flow, momentum indicators.
Execution Speed: Entering/exiting trades instantly.
Emotional Control: Avoiding overtrading, revenge trading.
Adaptability: Quickly adjusting strategies based on market conditions.
Skills for Swing Traders
Patience: Waiting for setups and letting trades play out.
Chart Reading: Spotting longer-term patterns, support/resistance.
Risk Management: Wider stops and position sizing.
Fundamental Awareness: Earnings reports, economic cycles, sectoral strength.
Chapter 5: Lifestyle Differences
Day Trader’s Lifestyle
Rigid schedule, glued to screens.
Highly stressful, like a high-pressure job.
Potentially lucrative but exhausting.
Swing Trader’s Lifestyle
Flexible, allows another job or business.
More relaxed, less screen time.
Profit cycles are slower, requiring patience.
Chapter 6: Risk & Money Management
Both day trading and swing trading require strict risk management.
Day Traders: Use very tight stop-losses (0.5–1%). Since trades are frequent, even small losses can add up quickly. They usually risk 1% or less of capital per trade.
Swing Traders: Use wider stop-losses (2–5%), but since trade frequency is lower, they can size positions accordingly.
Golden Rule: In both styles, protecting capital is more important than chasing profits.
Chapter 7: Tools & Technology
Day Trading Tools:
Advanced brokers with fast execution.
Real-time scanners and news feeds.
Level 2 market data and order book.
1-min to 15-min charts with volume analysis.
Swing Trading Tools:
Stock screeners and scanners (fundamental + technical).
End-of-day charting platforms.
Alerts for breakouts or moving averages.
Daily/weekly trend analysis.
Chapter 8: Psychology of Day vs Swing Traders
Day Trader Mindset:
Thrives under pressure.
Short attention span but sharp reflexes.
Accepts small wins and small losses.
Needs strong discipline against greed/fear.
Swing Trader Mindset:
Patient and long-term thinker.
Comfortable with delayed gratification.
Can handle volatility and avoid panic exits.
Strong analytical temperament.
Chapter 19: Which One is Better?
There’s no “better” strategy universally—it depends on the trader’s goals, personality, and lifestyle.
Choose Day Trading if:
You can dedicate full-time hours.
You enjoy fast action and adrenaline.
You have sufficient capital to meet margin requirements.
You’re disciplined and thrive in high-stress environments.
Choose Swing Trading if:
You have a job/business and can’t sit in front of screens all day.
You prefer patience over speed.
You’re looking for bigger gains per trade.
You can handle overnight risk.
Conclusion
Day trading and swing trading are like two sides of the same coin. Both aim to capture short-term profits but differ in approach, holding period, required skills, and lifestyle impact. Day trading is fast, stressful, and capital-intensive but offers quick returns. Swing trading is slower, less stressful, and more flexible but comes with overnight risk.
Ultimately, the best trading style is the one aligned with your personality and goals. Many traders experiment with both before settling into the strategy that suits them. Whether you choose the sprint of day trading or the steady stride of swing trading, success depends less on the strategy itself and more on discipline, risk management, and consistency.

Risk Smart, Grow Fast: Survival Guide for Small Account TradersIntroduction
Trading is an arena that excites many with the promise of financial freedom, rapid wealth creation, and independence from traditional jobs. But the harsh truth is that most new traders lose money, especially those starting with small accounts. A small account brings its own set of challenges: limited capital, strict margin restrictions, emotional pressure, and the risk of blowing up quickly. Yet, history and countless success stories prove that small accounts can grow into big ones—if approached with discipline, risk management, and strategy.
This survival guide is written with one mission: to help small account traders trade smart, protect their capital, and accelerate growth without succumbing to the pitfalls that destroy most beginners.
Chapter 1: The Reality of Trading Small Accounts
Trading with a small account is different from trading with a large one. With limited funds, every decision matters. A small loss feels heavy, a bad trade can wipe out days or weeks of progress, and transaction costs hurt more.
Key challenges small account traders face:
Capital Constraint – With only ₹10,000–₹50,000 (or a few hundred dollars), position sizing becomes tricky. You cannot afford large drawdowns.
Emotional Pressure – Fear of losing and greed for doubling the account often drive impulsive trades.
Leverage Temptation – Brokers offer leverage, but small traders misuse it, leading to margin calls.
Risk of Ruin – One or two bad trades with no stop-loss can blow up the account completely.
Survival begins with accepting this reality: your first goal isn’t to make money fast—it’s to not lose money unnecessarily.
Chapter 2: The Mindset of a Survivor
Most traders fail not because of poor strategies, but because of poor psychology. Small account traders must adopt a “capital preservation” mindset before thinking about profits.
Think Like a Risk Manager – Ask: How much can I lose? before asking How much can I make?
Detach from Ego – Your account size doesn’t define your skill. Stay humble, focus on learning.
Play the Long Game – Compounding works wonders, but only if you survive long enough.
Embrace Boring Consistency – Avoid chasing thrill trades. Professional traders trade boring setups repeatedly.
Chapter 3: Risk Management is Your Lifeline
With a small account, risk management is the difference between survival and destruction.
1. The 1% Rule
Risk no more than 1–2% of your capital on a single trade.
Account: ₹25,000
1% Risk: ₹250
If your stop-loss is 5 points away, you can only take 50 shares.
This way, even after 10 losing trades, you lose only 10% of capital, not the whole account.
2. Stop-Loss is Non-Negotiable
Never enter a trade without a predefined stop-loss. Markets are unpredictable. Stop-loss is your insurance.
3. Position Sizing Formula
Position Size = (Account Risk × % Risk per Trade) ÷ Stop-Loss Distance
This ensures you don’t oversize.
4. Risk/Reward Ratio
Take trades only when reward is at least 2x the risk. Example: risking ₹500 to make ₹1,000.
5. Avoid Overtrading
Chapter 4: Strategies That Work for Small Accounts
Not all strategies are suitable for small traders. Complex multi-leg option spreads, long-term positional trades, or capital-heavy setups may be unfit. Instead, focus on high-probability, low-risk strategies.
1. Scalping with Discipline
Small, quick trades capturing 0.3–1% moves.
Works best in liquid instruments like Nifty, BankNifty, Reliance, HDFC Bank.
Needs strict stop-loss, otherwise one bad trade kills multiple small wins.
2. Breakout Trading
Enter when price breaks strong support/resistance.
High risk/reward if you wait for confirmed breakout with volume.
3. Intraday Option Buying
Cheap premiums, limited risk (premium paid), unlimited potential.
Works best with momentum days after news, events, or opening range breakouts.
4. Swing Trading
Holding positions for 2–10 days with stop-loss.
Helps small traders avoid intraday noise and transaction costs.
5. Volume Profile + Price Action
Identify where institutions are active.
Trade only when market structure supports your bias.
Avoid random entries.
Chapter 5: The Power of Compounding – From Small to Big
Growing a small account requires patience. Let’s see how small consistent returns compound:
₹25,000 with 5% monthly growth → ₹52,700 in 1 year → ₹1.11 lakh in 2 years → ₹2.36 lakh in 3 years.
Compounding turns modest returns into life-changing results.
The key: Protect the downside. Without survival, compounding is impossible.
Chapter 6: Tools & Tactics for Small Account Traders
Broker Selection – Choose brokers with low commissions, no hidden charges, and seamless platforms.
Charting Platforms – Use TradingView or equivalent for better analysis.
Journaling – Record every trade: entry, exit, stop-loss, reasoning. This builds discipline.
Avoid F&O Overexposure – Don’t jump into naked futures without experience.
Cash is Also a Position – Sometimes the best trade is no trade.
Chapter 7: Common Mistakes Small Traders Make
Over-leverage – Blowing up accounts by using margin excessively.
Revenge Trading – Doubling down after a loss to “recover fast.”
No Risk Plan – Trading without stop-loss or risk limits.
Following Tips Blindly – Copying Telegram/WhatsApp calls without analysis.
Impatience – Expecting to turn ₹10,000 into ₹1 lakh in 1 month.
Chapter 8: Building Discipline & Routine
Trading success isn’t about finding a “holy grail strategy.” It’s about developing habits.
Morning Preparation – Identify levels, mark support/resistance.
Defined Trading Hours – Trade only when market is active.
Post-Market Review – Log trades, analyze mistakes.
Mental Fitness – Meditation, walks, or journaling to control emotions.
Consistency in routine = Consistency in profits.
Chapter 9: Scaling Up – When to Increase Lot Size
Don’t rush. Scale gradually.
Rule: Increase position size only when account grows by 25–30%.
Example: If you start with ₹25,000, increase lot size only after reaching ₹32,500+.
Never double size overnight—it kills accounts.
Chapter 10: The Trader’s Code of Survival
To grow fast while being risk smart, every small account trader should follow this code:
Protect capital first, profits second.
Trade only setups with favorable risk/reward.
Never risk more than 1–2% per trade.
Keep emotions in check—stick to plan.
Journal trades, learn continuously.
Compound with patience, scale gradually.
Conclusion
Trading a small account is like sailing a fragile boat in stormy waters—you must be extra cautious, disciplined, and skillful to survive. Many traders fail because they chase fast riches, ignore risk management, and trade emotionally. But those who respect risk, stay patient, and stick to disciplined strategies can not only survive but thrive.
Remember: Your small account isn’t a limitation—it’s your training ground. Survive long enough, grow consistently, and one day, the small account you’re protecting today will be the large account that gives you freedom tomorrow.
Part 4 Institutional Trading Types of Option Strategies
Here’s the heart of the discussion: strategies.
Single-Leg Strategies (Simple & Beginner-Friendly)
a) Long Call (Buying a Call)
View: Bullish
Risk: Limited to premium paid
Reward: Unlimited (theoretically)
Example: Buy Reliance 2800 CE @ ₹50 → If Reliance goes to 2900, profit = ₹50.
b) Long Put (Buying a Put)
View: Bearish
Risk: Limited to premium paid
Reward: Large downside profit potential
Example: Buy Nifty 22,000 PE → If Nifty falls, profit rises.
c) Covered Call
View: Neutral to mildly bullish
How it works: Hold stock + Sell a Call option
Goal: Earn income from option premium
Risk: Stock falls significantly.
d) Cash-Secured Put
View: Neutral to bullish
How it works: Sell a Put with enough cash to buy stock if assigned.
Goal: Collect premium or buy stock cheaper.

Part 2 Ride The Big MovesBasics of Options
Before jumping into strategies, let’s revisit some fundamentals:
Call Option: Gives the buyer the right to buy the asset at a specific strike price.
Put Option: Gives the buyer the right to sell the asset at a specific strike price.
Option Premium: The price paid to buy an option.
Strike Price: The price at which the underlying can be bought/sold.
Expiry Date: The last date the option can be exercised.
ITM (In-the-Money): Option has intrinsic value (profitable if exercised).
OTM (Out-of-the-Money): Option has no intrinsic value (not profitable if exercised).
ATM (At-the-Money): Strike price is very close to current market price.
💡 Quick Example:
Nifty is at 22,000. You buy a 22,000 Call Option for ₹200 premium. If Nifty rises to 22,500, your option has value (ITM). If Nifty stays flat or goes down, you may lose the premium.
Now, depending on whether you buy or sell Calls/Puts, you can build hundreds of strategies.
Why Traders Use Options
Options are powerful because they can serve three main purposes:
Hedging – Protecting an existing portfolio from adverse price moves.
Example: A long-term investor holding Infosys shares may buy a Put option to protect against a fall.
Speculation – Betting on market direction with limited capital.
Example: Buying a Call if you expect bullish momentum.
Income Generation – Selling options to collect premium regularly.
Example: Writing Covered Calls on stocks you own.
The same instrument (options) can be used very differently by traders with different goals. That’s why strategies matter.

Part 2 Candle Stick Pattern Introduction to Options Trading
In the world of financial markets, traders are always looking for ways to manage risk, generate income, or profit from price movements. Stocks, bonds, and futures are common instruments, but options trading adds a completely new layer of flexibility.
An option is a financial contract that gives the buyer the right, but not the obligation, to buy or sell an underlying asset at a specific price (called the strike price) on or before a certain date (called the expiry date).
Unlike stocks, which represent ownership in a company, options are derivative contracts—their value is derived from the movement of an underlying asset such as Nifty, Bank Nifty, Reliance Industries, Tesla, Gold, Crude Oil, etc.
The beauty of options is that they allow traders to benefit in bullish, bearish, or even sideways markets, depending on the strategy used. That’s why understanding option trading strategies is like learning the different moves in a chess game—you pick the right one for the right situation.
Basics of Options
Before jumping into strategies, let’s revisit some fundamentals:
Call Option: Gives the buyer the right to buy the asset at a specific strike price.
Put Option: Gives the buyer the right to sell the asset at a specific strike price.
Option Premium: The price paid to buy an option.
Strike Price: The price at which the underlying can be bought/sold.
Expiry Date: The last date the option can be exercised.
ITM (In-the-Money): Option has intrinsic value (profitable if exercised).
OTM (Out-of-the-Money): Option has no intrinsic value (not profitable if exercised).
ATM (At-the-Money): Strike price is very close to current market price.
💡 Quick Example:
Nifty is at 22,000. You buy a 22,000 Call Option for ₹200 premium. If Nifty rises to 22,500, your option has value (ITM). If Nifty stays flat or goes down, you may lose the premium.
Now, depending on whether you buy or sell Calls/Puts, you can build hundreds of strategies.

Option Trading Option Greeks – The Core of Option Pricing
Options are complex instruments whose prices change with many factors. To understand price behavior, traders rely on Option Greeks.
Delta (Δ)
Measures sensitivity of option price to underlying asset movement.
Call delta ranges 0 to +1; Put delta ranges 0 to -1.
Example: If Delta = 0.5, a ₹10 stock move increases option price by ₹5.
Theta (Θ)
Time decay. Options lose value as expiry approaches.
Bad for buyers, good for sellers.
Vega (ν)
Sensitivity to volatility. Higher volatility increases option premium.
Gamma (Γ)
Measures change in Delta when the stock price moves.
Rho (ρ)
Sensitivity to interest rate changes (less relevant in short-term trading).
👉 Mastering Greeks is key for professional option traders because they help predict how option premiums will behave under changing conditions.

PCR Trading How Option Trading Works
Let’s simplify with an example:
Stock Price: ₹1000
Call Option Strike: ₹1050
Premium: ₹20
Lot Size: 100 shares
If you buy the call option:
Break-even = Strike Price + Premium = ₹1070
If stock goes to ₹1100 → Profit = (1100-1050-20) × 100 = ₹3000
If stock stays below ₹1050 → You lose only the premium = ₹2000
If you sell (write) the call option:
You collect ₹2000 premium upfront.
If stock stays below 1050, you keep the entire premium as profit.
But if stock goes to ₹1100, you face unlimited loss: (1100-1050-20) × 100 = -₹3000.
👉 This shows: Option buyers have limited risk but unlimited profit potential, while sellers have limited profit but unlimited risk.

Part 1 Support And ResistanceIntroduction to Option Trading
The stock market offers multiple instruments to trade and invest—stocks, futures, commodities, currencies, and derivatives. Among these, Options have gained tremendous popularity worldwide because they give traders flexibility, leverage, and strategies to profit in all types of market conditions—bullish, bearish, or even sideways.
At its core, an Option is a contract that gives a buyer the right but not the obligation to buy or sell an asset at a predetermined price (called the strike price) before or on a specific date (called the expiry date).
This right comes at a cost, known as the premium, which is paid by the option buyer to the option seller (also called the writer).
Options are widely traded on stocks, indices, commodities, and currencies. In India, for example, options on Nifty 50, Bank Nifty, Sensex, and individual stocks are among the most liquid contracts.
Why Options Exist?
Options exist to manage risk and to create trading opportunities. Think of them as financial insurance. Just like you pay a premium for car insurance to protect against damage, in options trading, investors pay a premium to protect themselves against adverse price moves.
For Hedgers: Options act as insurance. A stock investor can buy a put option to protect his portfolio if the market falls.
For Speculators: Options provide leverage. With small capital, traders can take large directional bets.
For Arbitrageurs: Options open opportunities to exploit price inefficiencies between the spot, futures, and options markets.

Day Trading Techniques1. Introduction to Day Trading
Day trading is one of the most exciting and challenging forms of trading in the financial markets. Unlike long-term investors who hold stocks for months or years, day traders aim to open and close trades within the same trading session. The idea is to capitalize on intraday price movements, whether they are tiny scalps of a few seconds or larger moves over a few hours.
Day trading requires speed, precision, and discipline. It’s not just about clicking buy and sell—it’s about having a structured approach, using the right techniques, and applying strict risk management rules.
Some of the biggest advantages of day trading include:
No overnight risk (you close positions the same day).
Frequent opportunities due to constant price fluctuations.
Ability to compound profits quickly.
But there are also challenges:
High stress and fast decision-making.
Need for strong technical knowledge.
Risk of large losses if discipline is weak.
Now, let’s dive into the core principles that govern successful day trading.
2. Core Principles of Day Trading
Before learning the techniques, every day trader must master these principles:
a) Liquidity
Choose highly liquid stocks or instruments (e.g., Nifty, Bank Nifty, top NSE stocks, S&P500, EUR/USD forex pair) so that you can enter and exit quickly without much slippage.
b) Volatility
Day traders thrive on price volatility. Without movement, there’s no profit. Stocks with daily volatility above 2-3% are ideal.
c) Timeframes
Most day traders use 1-minute, 5-minute, and 15-minute charts for entries, while higher timeframes (30-min, hourly) help in understanding the bigger trend.
d) Risk-Reward Ratio
A golden rule is never to risk more than 1-2% of capital on a single trade. Good setups should ideally have a risk-reward ratio of 1:2 or higher.
e) Discipline
Consistency matters more than one big win. Even professional traders lose trades daily, but their discipline helps them win over the long run.
3. Popular Day Trading Techniques
Now let’s discuss the main strategies and techniques used by day traders:
3.1 Scalping
Scalping is the fastest form of day trading, where traders take multiple trades within seconds or minutes. The goal is to profit from tiny price movements.
Example: Buying Nifty Futures at 24,500.50 and selling at 24,502.00 for a small 1.5-point gain, repeated multiple times.
Tools: 1-min chart, VWAP, Level 2 order book.
Best Suited For: Highly liquid markets (Bank Nifty, Nasdaq, EUR/USD).
Pros: High frequency, quick profits.
Cons: Stressful, requires excellent execution speed.
3.2 Momentum Trading
Momentum traders look for strong moves backed by high volume and ride the trend until momentum weakens.
Example: A stock breaking 5% up with strong volume after positive earnings, and you ride it for another 3-4%.
Tools: RSI, MACD, VWAP, Volume Profile.
Best Suited For: Trending markets.
Pros: Large profits in trending conditions.
Cons: Risk of sudden reversals.
3.3 Breakout Trading
Breakout traders wait for a key support/resistance level to break with volume. They enter in the direction of the breakout.
Example: Reliance stuck between ₹2,900–₹3,000 for hours, then breaking ₹3,000 with high volume → buy for upside momentum.
Tools: Bollinger Bands, Volume analysis, Price Action.
Best Suited For: Stocks consolidating before big moves.
Pros: High reward trades if trend follows through.
Cons: Fake breakouts (false signals).
3.4 Reversal Trading
Reversal trading involves spotting exhaustion in a trend and betting against it.
Example: Bank Nifty rallies from 50,000 → 50,800, forms a double top, RSI diverges → short for pullback to 50,500.
Tools: RSI divergence, Candlestick patterns (hammer, shooting star).
Best Suited For: Overextended moves.
Pros: Excellent risk-reward (small risk, large reward).
Cons: Dangerous if trend continues.
3.5 Range-Bound Trading
Some stocks don’t trend—they move sideways. Traders exploit this by buying at support and selling at resistance.
Example: HDFC Bank bouncing between ₹1,600–₹1,620. Buy near ₹1,600, sell at ₹1,620.
Tools: RSI, Bollinger Bands, Pivot Points.
Best Suited For: Low-volatility phases.
Pros: Works well in sideways markets.
Cons: Breakouts can cause losses.
3.6 News-Based Trading
Markets react violently to news—earnings, economic data, government policies, mergers. News traders take positions immediately after such events.
Example: RBI cuts repo rate unexpectedly → banking stocks rally → enter quickly for intraday gains.
Tools: Live news feeds, Economic calendar.
Best Suited For: High-impact events.
Pros: Big profits in minutes.
Cons: Extremely risky if market overreacts.
3.7 Tape Reading & Order Flow
This old-school technique uses the order book and time & sales data to judge buying/selling pressure.
Example: Sudden increase in bid size at support level → sign of accumulation → go long.
Tools: DOM (Depth of Market), Footprint charts.
Best Suited For: Professional scalpers.
3.8 Algorithmic & Quantitative Day Trading
Algo traders use automated systems and mathematical models to scalp or trade intraday moves.
Example: A mean-reversion algo that buys when RSI < 20 and sells when RSI > 80.
Tools: Python, TradingView Pine Script, MT5 bots.
Best Suited For: Traders with coding/quant skills.
4. Technical Tools for Day Trading
Some essential indicators and tools:
VWAP (Volume Weighted Average Price): Institutional benchmark, used for intraday trend bias.
Moving Averages (EMA 9/20/50): Short-term trend signals.
RSI & MACD: Momentum indicators.
Volume Profile: Shows price levels where heavy trading occurred.
Candlestick Patterns: Pin bars, engulfing candles for entries/exits.
Pivot Points & Fibonacci: Intraday support/resistance.
5. Risk Management & Position Sizing
Without risk control, even the best technique fails. Key rules:
Never risk more than 1-2% of total capital per trade.
Use stop-loss orders strictly.
Apply position sizing formulas based on account size.
Keep risk-reward ratio > 1:2.
6. Trading Psychology
Day trading success is 80% psychology, 20% strategy.
Control emotions—fear and greed kill traders.
Don’t overtrade after losses (revenge trading).
Accept that losses are part of the game.
Stay patient and wait for A+ setups.
7. Practical Example Walkthrough
Imagine you’re day trading Infosys on results day:
Stock opens at ₹1,500, rallies to ₹1,540 with strong volume.
You spot momentum buildup and enter long at ₹1,542.
Place stop-loss at ₹1,530 (12 points risk).
Target ₹1,566 (24 points reward).
Stock hits ₹1,566 → you book profits → 1:2 risk-reward achieved.
This is how disciplined execution works.
8. Common Mistakes in Day Trading
Over-leveraging with margins.
Ignoring stop-loss.
Trading low-volume illiquid stocks.
Following tips blindly.
Emotional decision-making.
9. Advanced Tips & Best Practices
Trade only 2–3 best setups per day.
Maintain a trading journal to track progress.
Specialize in a few instruments instead of chasing everything.
Use hotkeys and advanced charting software for speed.
Always review trades post-market.
10. Conclusion
Day trading is a thrilling but demanding profession. The right combination of techniques, discipline, risk management, and psychology is what separates winners from losers.
Whether you prefer scalping, momentum trading, or breakouts—the key lies in sticking to a plan, managing risk, and learning continuously. Success in day trading doesn’t come overnight—it’s a journey of skill, patience, and persistence.

Option Chain Analysis1. Introduction
In modern trading, derivatives like options have become one of the most powerful instruments. Among the many tools available to option traders, Option Chain Analysis stands out as the backbone of decision-making. If stock market trading is like a battlefield, then an option chain is the detailed map of that battlefield – showing where buyers and sellers are positioned, where the pressure lies, and where opportunities may emerge.
An option chain (also called an options matrix) is simply a table that displays all available option contracts for a particular underlying asset (stock, index, commodity, etc.) along with their respective prices, volumes, and open interest. But, when we say option chain analysis, we mean much more than just reading a table – it’s about interpreting the data to understand market sentiment, possible support & resistance levels, and probable future price movements.
This guide will walk you through everything: from the basics of an option chain, the meaning of each data point, to advanced strategies for trading with option chain insights.
2. What is an Option Chain?
An Option Chain is a list of all the option contracts (both calls and puts) for a specific security across different strike prices and expiration dates.
For example, if you look at the Nifty 50 Option Chain for the current expiry, you’ll find:
All Call Options (CE) on one side.
All Put Options (PE) on the other side.
Strike prices in the middle column.
Alongside each strike, you’ll see key data like Last Traded Price (LTP), Volume, Open Interest (OI), Change in OI, Implied Volatility (IV), etc.
An option chain is essentially a snapshot of trader positioning. By reading it carefully, one can figure out where big institutions, retailers, and market makers are betting.
3. Structure of an Option Chain
A typical option chain table contains:
Strike Price: The agreed price at which the option holder can buy (Call) or sell (Put) the underlying.
Call Options (CE):
OI (Open Interest)
Change in OI
Volume
LTP (Last Traded Price)
Bid/Ask prices
Implied Volatility (IV)
Put Options (PE):
Same set of data points but for Puts.
Let’s break each down:
3.1 Strike Price
The reference price levels at which options can be exercised. Traders often focus on strike prices close to the current underlying price (ATM – At The Money).
3.2 Open Interest (OI)
Definition: Number of outstanding contracts not yet squared off.
Importance: High OI indicates strong trader participation.
Example: If the Nifty 20000CE has very high OI, it means many traders expect resistance around 20,000.
3.3 Change in OI
Tells you whether positions are being built (fresh contracts added) or unwound (closed).
Rising OI with rising price → Long build-up.
Rising OI with falling price → Short build-up.
3.4 Volume
Shows trading activity in a contract for the day. High volume indicates short-term interest.
3.5 Implied Volatility (IV)
Market’s expectation of future volatility.
High IV = Expensive options (market expects big moves).
Low IV = Cheaper options (market expects stability).
3.6 Bid/Ask Prices
The demand and supply levels at which traders are willing to buy/sell options.
4. Key Concepts in Option Chain Analysis
Before diving into strategies, you must understand how traders interpret option chain data.
4.1 Support and Resistance via OI
Support: Identified at Put strikes with highest OI (traders selling puts expect the market to stay above).
Resistance: Found at Call strikes with highest OI (call sellers expect the market to stay below).
Example:
If Nifty is at 19,800:
Highest PE OI at 19,500 → Support at 19,500.
Highest CE OI at 20,000 → Resistance at 20,000.
4.2 Put-Call Ratio (PCR)
Formula: PCR = Total Put OI ÷ Total Call OI
Interpretation:
PCR > 1 → Bullish (more puts sold, traders expect market to rise).
PCR < 1 → Bearish (more calls sold, traders expect market to fall).
4.3 Long/Short Build-ups
Long Build-up = Price ↑ + OI ↑
Short Build-up = Price ↓ + OI ↑
Long Unwinding = Price ↓ + OI ↓
Short Covering = Price ↑ + OI ↓
These patterns show real-time trader behavior.
4.4 Max Pain Theory
The strike price where option sellers (who are usually big players) would face the least loss at expiry.
This level often acts like a magnet as expiry approaches.
5. Step-by-Step Approach to Option Chain Analysis
Let’s build a systematic approach:
Step 1: Check Underlying Price
Find the current price of the stock/index.
Step 2: Identify ATM Strike
Pick the strike closest to the current price. That’s the most active zone.
Step 3: Check OI Levels
Look at which strikes have highest Call OI (resistance) and Put OI (support).
Step 4: Study OI Change
Fresh build-up of OI tells you the immediate sentiment.
Step 5: Watch PCR
Get a sense of whether market is leaning bullish or bearish.
Step 6: Note Implied Volatility
Rising IV before events (like results, Fed meeting, Budget) means traders expect big moves.
Step 7: Confirm with Price Action
Always validate OI data with charts. If price is near resistance and call OI is rising, chances of breakout are less.
6. Practical Example (Nifty Option Chain)
Imagine Nifty is trading at 19,800.
Option Chain shows:
CE 20,000 OI = 3 lakh contracts (highest) → Major Resistance at 20,000.
PE 19,500 OI = 2.8 lakh contracts (highest) → Major Support at 19,500.
PCR = 1.2 → Market slightly bullish.
IV rising → Expect big move soon.
Interpretation:
Market likely to trade between 19,500 – 20,000 until a breakout occurs.
7. Advanced Insights from Option Chain
7.1 Shift in OI
If highest Put OI shifts upward (e.g., from 19,500 to 19,700), it means support is moving higher – bullish sign.
7.2 Unwinding
If traders start exiting positions (OI ↓), it signals they no longer trust that level.
7.3 Short Squeeze
If market breaks resistance, call writers may panic and cover, leading to a sharp rally.
7.4 Volatility Skew
Sometimes, IV is higher for certain strikes – indicates market expects asymmetric movement.
8. Option Chain Analysis for Traders
8.1 For Intraday Traders
Use OI changes on a 5-15 min basis.
Spot short-term resistance & support zones.
Quick scalping opportunities.
8.2 For Swing Traders
Focus on weekly/monthly option chains.
Watch how supports/resistances are shifting.
Combine with price action to ride bigger moves.
8.3 For Investors
Use chain data to hedge portfolios.
Writing options around high OI levels generates premium income.
9. Common Mistakes in Option Chain Analysis
Relying only on OI without price confirmation.
Ignoring global events (Fed policy, crude oil prices, earnings, etc.).
Misinterpreting PCR extremes (too high PCR can signal overbought).
Forgetting expiry dynamics – option data changes rapidly.
10. Real-Life Scenarios
Scenario 1: Budget Day
IV shoots up before budget.
Once budget is announced, IV crashes (IV Crush).
Traders who only looked at option prices without IV understanding lose heavily.
Scenario 2: Expiry Day
Market tends to move toward Max Pain strike.
Options near ATM decay the fastest.
Sellers dominate expiry trades.
Conclusion
Option Chain Analysis is like reading the pulse of the market. It tells you what the majority of traders believe, where the market might face obstacles, and where it could find strength. For intraday traders, swing traders, or even long-term investors, option chain is an essential skill to master.
By carefully analyzing OI, IV, PCR, and Max Pain, and aligning them with price action, traders can significantly improve accuracy. But remember – option chain doesn’t predict the future with certainty; it only provides probabilities and market sentiment. The real edge comes when you combine it with risk management and discipline.
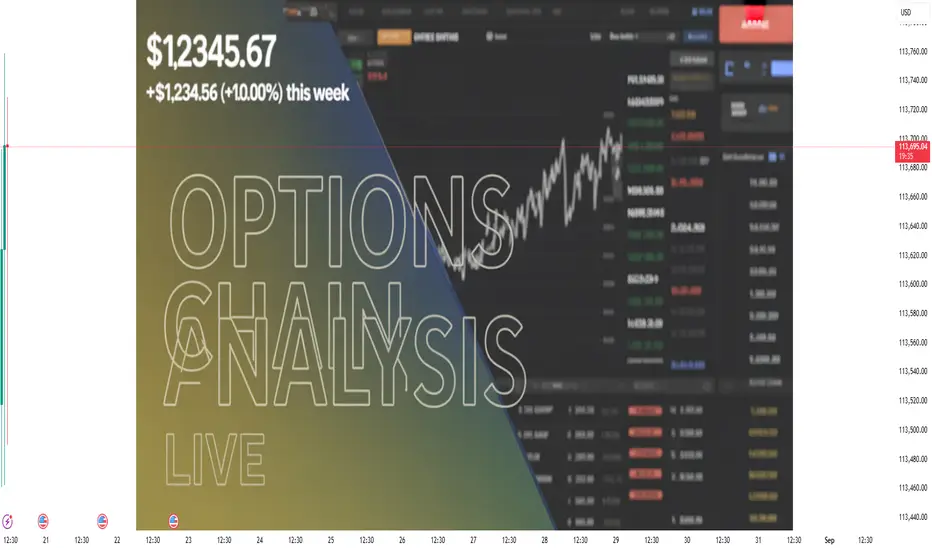
Identifying Swing Trading Opportunities in the Market1. Introduction to Swing Trading
Swing trading is a powerful trading style that sits between day trading and long-term investing. Unlike day traders who open and close trades within the same day, swing traders hold positions for a few days to a few weeks. The main goal is to capture "swings" in price—upward or downward movements caused by market momentum, technical patterns, or news.
The beauty of swing trading lies in its balance:
Less stressful than day trading since you don’t need to watch charts all day.
More active and potentially higher returns than passive investing.
Works well for people with jobs or businesses who can’t spend 8 hours glued to a screen.
But to succeed, you need to identify the right opportunities. Not every chart or stock is suitable for swing trading. Spotting opportunities requires understanding market structure, technical analysis, fundamentals, and timing.
2. Core Principles of Swing Trading Opportunities
Before diving into strategies, let’s build the foundation. Swing traders look for:
Trend Direction – Is the stock in an uptrend, downtrend, or sideways range?
Momentum – Is there enough force behind the move to sustain swings?
Risk-to-Reward – Can you set a stop-loss at a reasonable level and aim for a bigger target?
Liquidity – Is the stock or index liquid enough to avoid slippage?
Catalysts – News, earnings, or events that can trigger short-term moves.
These principles act as a filter. Out of thousands of stocks, only a few will pass through this funnel as swing trading candidates.
3. Tools to Identify Swing Trading Opportunities
Swing traders rely on a mix of technical, fundamental, and sentiment analysis. Let’s break them down:
a) Technical Analysis
Price Action: Reading candlesticks, support/resistance, breakouts, and patterns.
Indicators:
Moving Averages (20, 50, 200 EMA) for trend direction.
RSI (Relative Strength Index) for overbought/oversold signals.
MACD for momentum shifts.
Volume Profile for demand-supply zones.
Chart Patterns:
Bullish: Cup and Handle, Ascending Triangle, Flag, Double Bottom.
Bearish: Head & Shoulders, Double Top, Descending Triangle.
b) Fundamental Analysis
While swing traders don’t dive deep like long-term investors, some fundamentals matter:
Earnings reports (positive surprises can fuel rallies).
Sector rotation (money flowing from one sector to another).
Macro data (inflation, interest rates affecting sentiment).
c) Sentiment Analysis
News Flow: Mergers, product launches, government policies.
Options Data: Unusual call/put activity showing institutional interest.
Market Mood: Fear vs greed index, retail participation.
4. Step-by-Step Approach to Spot Opportunities
Here’s a structured approach swing traders can follow daily or weekly:
Step 1: Market Scan
Use screeners (TradingView, Chartink, Finviz, Screener.in).
Filter by:
Strong relative strength vs index.
Stocks near 52-week highs/lows.
Breakout setups (above resistance or trendline).
High volume spikes.
Step 2: Trend Confirmation
Use 20/50 EMA to confirm if stock is trending.
Avoid stocks in choppy sideways ranges.
Step 3: Entry Triggers
Look for:
Breakout with volume.
Pullback to support after an uptrend.
Reversal signals at oversold levels.
Step 4: Risk Management
Place stop-loss below swing low (for long trades).
Aim for 1:2 or higher risk-to-reward.
Step 5: Monitor & Exit
Trail stop-loss as trade moves in your favor.
Exit at resistance, fib levels, or when momentum fades.
5. Swing Trading Opportunities Based on Market Structure
Market structure is the heartbeat of swing trading. Let’s break it:
a) Uptrend Opportunities
Look for higher highs & higher lows.
Entry: After a pullback to moving average/support.
Example: IT or Pharma stocks in a bullish cycle.
b) Downtrend Opportunities
Look for lower highs & lower lows.
Entry: After a bounce into resistance.
Example: Weak financial stocks in a rate-hike cycle.
c) Range-Bound Opportunities
Stocks consolidating in a range.
Entry: Buy at bottom support, sell at top resistance.
Example: Sideways PSU stocks before breakout.
d) Breakout & Breakdown Opportunities
Consolidation followed by strong volume breakout.
Entry: Just above breakout level.
Example: Midcap stocks after results.
6. Swing Trading Setups That Work
Different traders prefer different styles. Here are proven setups:
1. Pullback in Trend
Identify a strong uptrend.
Wait for stock to dip near 20/50 EMA.
Enter on bullish reversal candle.
Example: Nifty IT stocks after profit booking.
2. Breakout Trading
Stock consolidates under resistance.
Breaks with high volume.
Enter above breakout candle.
Example: Midcap infra stock crossing 200-day high.
3. Support & Resistance Bounce
Buy near strong support, sell near resistance.
Example: Bank Nifty bouncing at 45,000 level.
4. RSI Divergence
Price makes lower lows but RSI makes higher lows.
Signals reversal opportunity.
Example: Metal stocks reversing after deep selloff.
5. Gap Trading
Stock gaps up/down after news.
Trade in the direction of the gap with stop-loss.
Example: Earnings-driven gaps in large caps.
7. Sector & Thematic Opportunities
Swing traders benefit from sectoral rotation:
When IT outperforms, focus on Infosys, TCS, TechM.
When Banking leads, focus on HDFC Bank, ICICI, SBI.
When Energy/Metals rally, look at ONGC, Coal India, Hindalco.
Themes also create opportunities:
EV (Tata Motors, M&M).
Renewable energy (Adani Green, NTPC).
Defense (HAL, BEL).
8. Real-Life Examples
Let’s take two examples from Indian markets:
Example 1: Tata Motors (2024 EV Story)
Setup: Broke out of a long consolidation near ₹600 with heavy volume.
Entry: At ₹610 (after breakout).
Stop-Loss: ₹580 (below support).
Target: ₹700+ (based on swing projection).
Result: Delivered 15% in 2 weeks.
Example 2: Bank Nifty Swing
Setup: Pullback to 45,000 after sharp rally.
Entry: Reversal candle with volume at support.
Stop-Loss: 44,600.
Target: 46,500.
Result: Quick 3% move in 4 sessions.
9. Common Mistakes in Identifying Swing Trades
Trading illiquid stocks with low volume.
Chasing trades after a big rally (late entries).
Ignoring stop-loss, leading to capital erosion.
Overloading portfolio with too many trades.
Trading without checking broader market trend.
10. Advanced Filters for Identifying Opportunities
For serious traders:
Relative Strength Analysis: Compare stock vs index.
Volume Profile & Market Structure: Identify institutional footprints.
Fibonacci Retracement: Look for 38.2% or 61.8% pullback levels.
Options Data: OI build-up for short-term direction.
Conclusion
Identifying swing trading opportunities is both art and science. You need:
The science of technicals, fundamentals, and scanning.
The art of reading market psychology, momentum, and timing.
The key takeaway:
Not every stock is worth trading. The best swing traders wait for high-probability setups, manage risk strictly, and ride short-term momentum.
Swing trading is not about catching every move, but about catching the right moves. With practice, patience, and structured analysis, anyone can master the skill of spotting profitable opportunities in the market.