Institutional Trading Strategies🔍 What Is Institutional Trading?
Institutional trading refers to how large financial institutions, such as hedge funds, investment banks, mutual funds, insurance companies, and pension funds, buy and sell large volumes of stocks, options, futures, and other financial instruments in the market.
Unlike retail traders (individual traders), institutions trade with massive capital, often in millions or billions of dollars. Their actions can move the market, and they use advanced tools, data, and strategies to protect their capital and maximize profit.
🏦 Who Are the Institutional Players?
Here are examples of institutional traders:
BlackRock
Vanguard
JP Morgan
Goldman Sachs
Citadel
Morgan Stanley
HDFC AMC / SBI MF (India context)
These entities manage huge portfolios for clients or for themselves and use highly strategic methods to execute trades.
⚙️ Why Are Their Strategies Different?
Institutional traders have several advantages over retail traders:
Access to better data (real-time order flow, economic models)
Advanced technology (high-frequency trading algorithms)
Lower transaction costs (thanks to bulk volume deals)
Connections (direct access to liquidity providers, brokers)
Skilled teams (analysts, quant traders, risk managers)
But there’s a big challenge: Their trades are so large, they can’t buy or sell in one go. If they do, they’ll cause huge price moves (called slippage). So they use smart strategies to enter and exit positions quietly without alerting the market.
🧠 Core Institutional Trading Strategies
Here are the most important trading strategies used by institutions:
1. 📊 Volume-Based Trading (Accumulation & Distribution)
Institutions use a strategy of accumulating large positions over time (buying slowly) and later distributing (selling slowly). This is done to hide their true intent from the market.
Accumulation Phase: Buying gradually in small chunks to avoid price spikes.
Distribution Phase: Selling in a quiet way so they don’t crash the price.
They might accumulate shares for weeks or months, often using dark pools or algorithms to keep their activity hidden.
2. 🏦 Order Flow Analysis / Tape Reading
Institutional traders track real-time order flow — meaning they study the buy/sell pressure using tools like:
Level 2 (market depth)
Time & sales (ticker tape)
Footprint charts
Delta volume
They watch where large orders are being placed, pulled, or spoofed, giving insight into what other big players are doing.
3. 💻 Algorithmic & High-Frequency Trading (HFT)
Institutions use algorithms (algos) to place thousands of trades per second. These bots follow specific rules based on:
Market trends
Arbitrage opportunities
Statistical models
HFT strategies are extremely fast, aiming to profit from tiny price differences in milliseconds.
4. 🧱 Quantitative Trading
Quant funds like Renaissance Technologies or D.E. Shaw use math, coding, and machine learning to create models that predict price movements.
They may build systems that factor in:
Price action history
News sentiment
Economic indicators
Correlation between assets
Volatility, interest rates
These are not human trades – the models execute trades based on data patterns.
5. 🧩 Options-Based Hedging Strategies
Institutions use options to hedge, speculate, or generate income.
Common techniques:
Protective Puts (insurance for falling stocks)
Covered Calls (collect premium for sideways movement)
Calendar Spreads, Iron Condors, etc. (advanced strategies for theta/gamma/vega exposure)
They often create multi-leg options positions to reduce risk and take advantage of implied volatility.
6. 🏰 Dark Pools Trading
Institutions often trade through dark pools, which are private exchanges not visible to the public. These are used to place large orders without revealing size, so other traders don’t front-run their positions.
Example: An institution may buy 1 million shares through a dark pool instead of a public exchange like NSE or NYSE.
7. 📍 Sector Rotation Strategy
Institutions frequently rotate their capital between sectors based on economic cycles.
In recession: move to defensive stocks (FMCG, Pharma)
In recovery: switch to cyclicals (automobile, banking, infrastructure)
They allocate billions of dollars based on macro themes, earnings cycles, and geopolitical shifts.
8. 🔁 Rebalancing Portfolios
Large funds constantly rebalance their portfolios — buying/selling assets to maintain target allocations. This causes monthly/quarterly flows in stocks or ETFs, which can influence price significantly.
Traders often try to anticipate these flows and trade in the same direction.
📉 How Institutional Traders Enter Positions Quietly
Let’s break down a common stealth strategy:
📘 Step-by-Step Accumulation Example:
Stock ABC trades at ₹100.
Institution wants to buy 5 lakh shares.
If they buy all at once, the price may jump to ₹110+.
So they:
Break order into 5,000 share blocks
Buy at different times of day
Use different brokers/accounts to hide volume
Buy some shares in dark pool
Use algorithm to monitor market depth
After 2 weeks, they complete the buy at an average price of ₹101.
Once they have the position, they might release news or earnings upgrades to support the price.
They hold till price hits their target (say ₹130), then start distributing in small blocks again.
👁 How to Spot Institutional Activity as a Retail Trader?
While you can’t directly see them, you can learn to follow the footprints:
🔍 Clues of Smart Money Activity:
Unusual volume on low-news days
Breakout with high volume but small price move
Price holding key levels repeatedly (support/resistance)
Option open interest buildup
Low volatility periods followed by volume spike
Multiple rejections from the same price zone (indicating accumulation/distribution)
🧠 Mindset of Institutional Traders
What makes institutions successful is not just tools or money — it’s their discipline, planning, and patience. Key principles:
Capital preservation first
Risk-to-reward must be favorable
Avoid emotional decisions
Backtesting before executing strategies
Long-term consistency over short-term wins
📌 Summary – What Can We Learn?
Institutional trading is not magic — it’s structured, logical, and data-driven. As a retail trader, you can’t beat them in speed or capital, but you can:
✅ Learn how they operate
✅ Use similar risk management
✅ Follow the smart money
✅ Avoid emotional trades
✅ Focus on long-term skill building
🏁 Final Thought
The goal isn’t to copy institutional trades, but to understand their footprint and align your trades with their flow. Most successful retail traders grow by observing how smart money moves, then reacting wisely.
You don’t need ₹100 crore to trade like an institution — you need a strategic mindset, discipline, and a plan.
Harmonic Patterns

Options Trading Strategies📌 What Are Options in Trading?
Before we get into strategies, let’s understand what options actually are.
In the simplest form, options are contracts that give a trader the right, but not the obligation, to buy or sell an asset (like a stock, index, or commodity) at a specific price before or on a specific date.
There are two main types of options:
Call Option – Gives you the right to buy something at a set price.
Put Option – Gives you the right to sell something at a set price.
These tools can be used to hedge, speculate, or generate income. Now that you know what options are, let’s go deeper into strategies.
🎯 Why Use Options Strategies?
Options trading is not just about buying Calls and Puts randomly. It’s about smart combinations and planned risk management. With the right strategies, you can:
Profit in up, down, or sideways markets
Limit your losses
Leverage small capital
Hedge your stock or portfolio
Earn regular income
Let’s now dive into some popular options trading strategies—from basic to advanced—with examples.
✅ 1. Covered Call Strategy
💡 Use When: You own a stock and expect neutral or slightly bullish movement.
You own shares of a stock and you sell a Call Option on the same stock. You receive a premium from selling the Call, which gives you extra income even if the stock doesn’t move.
📘 Example:
You own 100 shares of Reliance at ₹2800. You sell a 2900 Call Option and receive ₹30 per share as premium.
If Reliance stays below ₹2900 – You keep your stock and the premium.
If Reliance goes above ₹2900 – Your stock gets sold (you deliver), but you still profit from stock rise + premium.
✅ Pros:
Earn extra income
Lower risk than buying naked calls
❌ Cons:
Limited upside
Need to own stock
✅ 2. Protective Put Strategy
💡 Use When: You own a stock but want to protect from downside risk.
Here, you buy a Put Option along with owning the stock. It acts like insurance – if the stock crashes, the Put will rise in value.
📘 Example:
You buy HDFC Bank shares at ₹1700 and buy a 1650 Put Option for ₹25.
If HDFC drops to ₹1600 – Your stock loses ₹100, but your Put may gain ₹50–₹75.
If HDFC goes up – You lose only the premium ₹25.
✅ Pros:
Protects your portfolio
Peace of mind in volatile markets
❌ Cons:
You pay a premium (like insurance)
Can eat into profits
✅ 3. Bull Call Spread
💡 Use When: You are moderately bullish on a stock.
You buy a Call Option at a lower strike and sell another Call Option at a higher strike (same expiry). This reduces your cost and risk.
📘 Example:
Buy Nifty 22500 Call at ₹100
Sell Nifty 23000 Call at ₹50
Your net cost = ₹50
Max profit = ₹500 (if Nifty ends above 23000)
✅ Pros:
Lower cost than naked Call
Defined risk and reward
❌ Cons:
Limited profit potential
✅ 4. Bear Put Spread
💡 Use When: You are moderately bearish.
You buy a Put at higher strike and sell another Put at lower strike. This is just like Bull Call, but for falling markets.
📘 Example:
Buy Bank Nifty 50000 Put at ₹120
Sell 49500 Put at ₹60
Net Cost = ₹60
Max Profit = ₹500
✅ Pros:
Risk-managed way to profit in downtrend
❌ Cons:
Limited profits if market crashes heavily
✅ 5. Iron Condor
💡 Use When: You expect the market to stay sideways or within a range.
It’s a neutral strategy involving four options:
Sell 1 lower Put, Buy 1 far lower Put
Sell 1 upper Call, Buy 1 far upper Call
📘 Example:
Sell 22500 Put
Buy 22200 Put
Sell 23000 Call
Buy 23300 Call
You receive a net premium. If the index stays between 22500–23000, you make full profit.
✅ Pros:
Profits in range-bound market
Low risk, fixed reward
❌ Cons:
Requires margin
Complicated setup
✅ 6. Straddle Strategy
💡 Use When: You expect a big move in either direction, but not sure which.
Buy both a Call and a Put at the same strike price and expiry. One side will definitely move.
📘 Example:
Buy Nifty 23000 Call at ₹80
Buy Nifty 23000 Put at ₹90
Total cost = ₹170
If Nifty makes a big move (up or down), one side can explode in value.
✅ Pros:
Unlimited potential if market breaks out
Great for news events
❌ Cons:
Expensive to enter
Needs big movement to profit
✅ 7. Strangle Strategy
💡 Use When: You expect a big move, but want to reduce cost compared to straddle.
Buy an Out-of-the-Money Call and Put.
📘 Example:
Buy Nifty 23200 Call at ₹40
Buy Nifty 22800 Put at ₹50
Total cost = ₹90
You still profit from big movement, but cheaper than a straddle.
✅ Pros:
Lower cost
Profits from big moves
❌ Cons:
Requires even larger movement than straddle
✅ 8. Short Straddle (for experts)
💡 Use When: You think the market will stay flat (low volatility).
Sell a Call and a Put at the same strike. You earn double premium.
⚠️ Risk: Unlimited risk if market moves too much!
This strategy is not for beginners. You need tight stop losses or hedges.
🔐 Risk Management Is Key
No matter which strategy you use:
Always define your maximum risk and reward.
Avoid taking naked positions without hedging.
Use stop losses and trailing SLs.
Don’t bet your whole capital – use position sizing.
Avoid trading right before major events unless you understand the risks.
Strangle
🤔 Real-Life Example (Simple Breakdown)
Let’s say the market is range-bound and Nifty is stuck between 22500–23000 for weeks. You can go with an Iron Condor:
Sell 22500 Put at ₹80
Buy 22200 Put at ₹40
Sell 23000 Call at ₹70
Buy 23300 Call at ₹35
Net Premium = ₹75
If Nifty expires between 22500–23000, you get full ₹75 profit per lot. If it breaks the range, losses are capped due to hedges.
💬 Final Thoughts
Options trading strategies are like different weapons in your trading arsenal. But using them without understanding or discipline is dangerous. Always know:
What is your market view?
What is your max risk?
How will you manage losses?
The smartest traders don’t gamble—they plan. They treat options like a business, not a lottery ticket.
So whether you’re trading with ₹5000 or ₹5 lakhs, always use a strategy with:
✔ Proper Risk-Reward
✔ Defined Exit Plan
✔ Strong Logic (not emotion)
Intraday Breakouts & FakeoutsIntroduction
If you’ve been trading for any length of time, you've probably heard of the term “breakout”. It sounds exciting—and it is. A breakout can be the start of a big move and massive profits. But what’s less talked about (yet very common) is the “fakeout”—a breakout that doesn’t hold and traps traders on the wrong side.
In the world of intraday trading, understanding breakouts and fakeouts is critical. Many traders lose money not because they don’t spot the breakout, but because they get caught in fakeouts. In this guide, we’re going to deeply understand what breakouts are, how fakeouts trick traders, and how you can trade both effectively.
Let’s dive in.
Part 1: What is a Breakout in Intraday Trading?
In simple words, a breakout happens when the price of a stock or asset moves outside a defined support or resistance level with increased volume.
Imagine the price is stuck between ₹100 (support) and ₹110 (resistance). It keeps bouncing in this range for hours. If suddenly, the price jumps above ₹110, that’s a breakout to the upside. If it drops below ₹100, that’s a breakdown (downward breakout).
Types of Breakouts
Price Breakout
Breaks key support/resistance levels.
Can happen on charts like 5-min, 15-min, or hourly.
Example: Nifty breaking above the day’s high at 10:30 AM with a strong green candle.
Volume Breakout
Price breaks with strong volume. Volume confirms that the breakout is real.
No volume = high risk of fakeout.
Time-Based Breakout
Usually happens during market opening (9:15-10:00 AM) or after lunch session (1:30-2:30 PM).
Institutions are active during these times.
Why Do Breakouts Happen?
A breakout indicates fresh buying or selling interest.
It reflects market consensus that price is ready to move beyond its old limits.
Often driven by news, earnings, or technical pressure (like stop-loss hunting).
Part 2: What is a Fakeout?
A fakeout (fake breakout) occurs when:
Price appears to break a level.
Traders jump in expecting a big move.
But price immediately reverses and traps them.
Fakeouts are deliberate traps—usually set by big players (institutions, smart money) to grab liquidity.
Retail traders often become the liquidity providers for institutions.
Why Do Fakeouts Happen?
Institutions want to fill large orders.
They push prices above resistance to trigger buy orders and stop-losses of short sellers.
Then they reverse the move, causing panic.
End result: Retail traders are left holding losses.
Part 3: Intraday Breakout Trading Strategies
Let’s look at some practical breakout strategies for intraday traders.
1. Opening Range Breakout (ORB)
Define the first 15–30 minutes range after market opens.
Place buy order above the high and sell order below the low.
Wait for confirmation candle and volume spike.
Common in indices like Nifty, Bank Nifty.
Tip: Always avoid trading in sideways markets using ORB. Use it when there’s strong news or momentum.
2. Flag or Pennant Breakout
Price consolidates in a tight flag or triangle after a sharp move.
Breakout of the pattern gives second entry into the trend.
Ideal for stocks showing momentum (e.g., high volume gainers).
3. Break and Retest Strategy
Wait for price to break a level.
Let it come back and retest the breakout point.
If retest holds and reverses in the breakout direction → enter.
Safer than blind breakout entries.
4. Trendline or Channel Breakout
Draw intraday trendlines on 5-min or 15-min chart.
Break of the trendline with good volume = possible entry.
Works well when the price breaks a descending or ascending channel.
Part 4: How to Avoid Fakeouts
Let’s be honest—you can’t avoid fakeouts 100%. But you can reduce them by being smart:
✅ Wait for Confirmation
Don’t enter on the first candle.
Wait for a closing candle above/below the breakout zone.
✅ Use Volume
No volume = No trade.
Use volume bars to check if breakout is real.
✅ Check Higher Time Frame
If 5-min shows breakout, check 15-min or hourly chart.
Are those timeframes supporting the move?
✅ Avoid Trading in Newsless/Sideways Markets
Breakouts in a consolidating or low-volume market are usually traps.
✅ Don’t Chase Breakouts
If price already moved too far from level, skip it.
Chasing leads to bad entries and panic exits.
Part 5: Stop Loss & Risk Management
Even the best setups fail. So risk management is king.
🔹 Where to Place Stop Loss?
Just below breakout candle (for long).
Just above breakdown candle (for short).
Or below the last swing low/high.
Example:
If a stock breaks out at ₹210 and breakout candle low is ₹205, place SL at ₹204.50.
🔹 How Much to Risk?
Risk only 1–2% of your total capital per trade.
Never add to a losing breakout trade.
Use position sizing wisely.
Part 6: Mindset – Stay Neutral, Not Emotional
Fakeouts hurt more mentally than financially.
After 2–3 fakeouts, you may start doubting every breakout.
The key is to follow a process, not feelings.
Keep notes of what works and what doesn’t. Learn from each setup.
Part 7: Bonus – Common Breakout Traps
Breakout Without Volume
Looks tempting, but lacks power.
Almost always fails.
Midday Breakout in Low Volatility
Low chance of success unless news-driven.
Breakouts Near Big Events (like Fed meetings, RBI policy)
Markets often reverse after whipsawing.
Extended Breakouts (after 4-5 green candles in a row)
Usually too late to enter.
Conclusion
Trading intraday breakouts and avoiding fakeouts is both art and science.
Yes, it’s risky. Yes, it’s fast. But with the right knowledge, experience, and discipline, you can turn it into a powerful edge.
To succeed:
Focus on volume, price action, and context.
Have patience to wait for the right setup.
And most importantly, protect your capital using risk management.
Breakouts can give you explosive gains—but only if you avoid the traps that come with them. So stay sharp, stay calm, and trade with a plan.
Trading Master Class With Experts🎓 Trading Master Class With Experts
Join a premium learning experience led by real market experts and institutional-level traders.
This is not just theory—it's real-world strategy, live insights, and powerful execution.
🔥 What You’ll Learn:
Advanced Price Action – Master structure, trends & breakouts
Institutional Trading Tactics – Learn how the big players move
Options & Derivatives – Trade with smart setups & defined risk
Strategy Building – From scalping to swing setups
Trader Psychology – Build discipline, mindset & consistency
Risk Management – Professional capital protection strategies
💡 Why Join?
✅ Learn from real experts
✅ Get access to institutional methods
✅ Trade with confidence, clarity & control
✅ Perfect for intraday, swing, and option traders
📌 Learn. Apply. Profit.
This is your step toward trading like a pro.

Master Institutional Trading🏛️ Master Institutional Trading
Unlock the secrets of how the smart money dominates the market
Learn to think, plan, and trade like top institutions and hedge funds.
What You’ll Master:
Advanced Market Structure – Breakouts, fakeouts & liquidity grabs
Smart Money Concepts – Accumulation & distribution like a pro
Order Flow & Volume Logic – Follow the real money
Entry & Exit Precision – Based on logic, not guesswork
Institutional Risk Management – Capital protection & scaling
Trader Psychology – Discipline, patience & strategy
No more random trades. No more emotional decisions.
This is structured, high-level trading built for serious traders.
📌 Master the mindset. Read the market. Trade like institutions.

Institutional Intraday option Trading🏛️ Institutional Intraday Option Trading
Trade like the big players — with speed, strategy, and smart money precision.
This is high-level intraday options trading the way institutions do it — not with guesswork, but with structure, volume, and calculated risk.
🔥 What You’ll Learn:
Smart Money Concepts – Recognize institutional footprints & price manipulation
Intraday Market Structure – Breakouts, fakeouts, traps & liquidity zones
High-Volume Option Levels – Trade where institutions act
Scalp-to-Swing Entries – Fast setups with defined risk
Tight Risk Management – Stop loss placement like a pro
Time & Premium Decay Tactics – Trade with Theta on your side
💼 Perfect For:
✅ Intraday Option Traders
✅ Scalpers & Index Traders (Nifty/BankNifty )
✅ Anyone ready to follow the real momentum
📌 Fast markets need smart strategies.
Learn to dominate intraday moves with institutional logic.

Learn Institutional Trading🏛️ Learn Institutional Trading
Step into the world of smart money and learn how the big players trade!
Institutional Trading isn’t about following indicators—it’s about understanding market structure, liquidity, and smart money moves.
🔍 What You’ll Learn:
Market Structure – Trends, ranges, and liquidity zones
Smart Money Concepts – Accumulation , distribution , and manipulation traps
Volume & Order Flow – See what the institutions see
Precision Entries – No guessing, just calculated moves
Risk Management – Trade like a pro, protect your capital
💡 Why It Matters:
Retail traders often get trapped 🚧 by institutional strategies. When you learn how institutions think and operate, you stop reacting and start predicting market behavior.
🚀 Final Thought:
Think like a pro. Trade like an institution. 🏛️ Win with structure.
Learn Institutional Trading and transform the way you see the market—forever

Option Trading💼 Option Trading 📉📈
Leverage. Flexibility. Strategic Advantage.
Option Trading is a powerful segment of the financial markets where traders and investors use derivative contracts—known as options—to speculate, hedge, or generate income. Unlike traditional stock trading, options give you the right (but not the obligation) to buy or sell an asset at a predetermined price, within a specific time frame.
It’s a strategic tool used by everyone from retail traders to hedge funds to gain exposure with limited risk and amplified potential.
🔍 Key Concepts:
✅ Call Option – Gives the right to buy an asset at a fixed price (strike)
✅ Put Option – Gives the right to sell an asset at a fixed price
✅ Premium – The price paid to buy the option contract
✅ Strike Price – The level at which the option can be exercised
✅ Expiry Date – The date on which the contract expires
✅ In-the-Money / Out-of-the-Money – Describes the moneyness of a position relative to current price
⚙️ Why Trade Options?
🔹 Leverage – Control larger positions with smaller capital
🔹 Flexibility – Bullish, bearish, neutral—there’s a strategy for every view
🔹 Defined Risk – Max risk = premium paid (in buying options)
🔹 Income Generation – Sell options (covered calls, credit spreads) for passive income
🔹 Hedging – Protect existing stock positions from volatility or loss
Option trading isn’t gambling—it’s a game of precision, risk management, and market insight. To succeed, you need to master:

Institutional Trading🏛️ Institutional Trading 📊
Trade Like the Smart Money
Institutional Trading refers to the high-volume, data-driven buying and selling of financial assets by large entities such as hedge funds, banks, mutual funds, insurance companies, pension funds, and proprietary trading firms. Unlike retail traders, institutional traders have access to advanced tools, deep liquidity, insider networks, and strategic research that give them a significant edge in the market.
These market participants don’t chase price—they move it. Their trades are structured, well-researched, and often hidden from the public eye through techniques like iceberg orders, dark pools, and algorithmic execution.
🔍 Key Features of Institutional Trading:
✅ Volume & Scale: Trades are executed in massive quantities, often spread across multiple venues to avoid detection.
✅ Market Influence: Institutions drive trends and liquidity. Their positioning can define entire market cycles.
✅ Strategic Execution: Every move is planned, including accumulation, distribution, and fakeouts to trap retail participants.
✅ Advanced Tools: They use sophisticated algorithms, AI-based models, high-frequency data, and institutional-grade charting.
✅ Focus on Risk-Reward: Strict risk management and portfolio balancing govern every trade decision.
🚀 Elevate Your Trading:
Learning Institutional Trading isn’t about copying big players—it’s about thinking like them, reading the market through their lens, and upgrading your strategy with smart money logic.
📈 Trade with structure. Trade with logic. Trade like an institution.

Ride The Big Moves🚀 Ride The Big Moves 📈
"Ride The Big Moves" is a powerful trading strategy and mindset that focuses on capturing large, high-probability market moves—rather than chasing small, uncertain fluctuations. It’s about positioning yourself with the trend, identifying institutional footprints, and holding trades with discipline and conviction for maximum reward.
This concept is rooted in smart money principles: letting your winners run, minimizing overtrading, and waiting for momentum-backed breakouts instead of guessing tops and bottoms. Whether you're trading options, stocks, or futures, the goal is simple—enter with precision, and ride the wave to its full potential.
👉 Perfect for:
✅ Swing Traders
✅ Intraday Momentum Traders
✅ Institutional-Style Traders
✅ Traders seeking fewer but higher-quality setups
🔍 Key Components:
Identifying high-volume breakout zones
Trend confirmation using price action
Entry triggers aligned with momentum shifts
Risk management for extended holds
Avoiding noise & false signals
Stop settling for crumbs — Ride The Big Moves and trade like the pros.

Technical Analysis vs Fundamental AnalysisWhat’s the Difference?
When people analyze stocks or any tradable asset, they usually follow one of two main approaches: Technical Analysis or Fundamental Analysis. Each one is like using a different lens to look at the same object. Both methods try to answer the same question:
“Should I buy, sell, or avoid this stock?”
But how they arrive at that answer is completely different.
1️⃣ What is Technical Analysis?
Technical Analysis is all about reading charts. It’s based on the belief that everything that affects a stock's price is already reflected in the stock price itself.
So instead of reading about a company's earnings or business strategy, technical analysts look at price movements, trading volumes, and patterns on charts to try to guess what might happen next.
How It Works:
Technical traders believe that history repeats itself.
Price moves in trends — up, down, or sideways.
Patterns like flags, triangles, and head-and-shoulders are seen as hints.
Indicators like RSI (Relative Strength Index), MACD (Moving Average Convergence Divergence), and moving averages are used to make decisions.
Key Concepts in Technical Analysis:
Candlestick Patterns: These show how the price moved in a given time — whether buyers or sellers were in control.
Support & Resistance: Support is a price level where a stock tends to stop falling. Resistance is where it often stops rising.
Volume: Helps you understand the strength behind a price movement.
Breakouts & Reversals: Important signals that indicate possible trend changes.
Real-Life Example:
Let’s say Stock A is trading at ₹500. It has bounced from this price three times before. That level becomes a support. If it suddenly jumps above ₹550 with high volume, that could be seen as a breakout, and a trader might enter a short-term position.
Pros of Technical Analysis:
Helpful for short-term trading like intraday or swing trades.
Fast decision-making based on visual cues.
Doesn’t require knowledge of a company’s financials.
Can be used across all asset classes (stocks, forex, commodities, crypto).
Cons of Technical Analysis:
It doesn’t look at what the company actually does.
False signals can mislead.
It works on probability — not certainty.
Can be overwhelming with too many indicators.
2️⃣ What is Fundamental Analysis?
Fundamental Analysis is like doing background research on a company before deciding whether to invest in it. Instead of looking at charts, you look at the company’s financial health, industry conditions, economic trends, and management quality.
The main goal is to find the true value (intrinsic value) of a stock and compare it with the current market price.
How It Works:
If the intrinsic value is more than the market price, the stock is considered undervalued and worth buying.
If the market price is more than the intrinsic value, it’s seen as overvalued, and better to avoid or sell.
Key Tools of Fundamental Analysis:
Financial Reports: Balance Sheet, Income Statement, Cash Flow Statement.
Ratios: PE (Price-to-Earnings), ROE (Return on Equity), Debt-to-Equity, EPS (Earnings Per Share).
Company's Business Model: What the company does, how it earns, and whether it's sustainable.
Management Quality: Experience and vision of the leadership.
Industry & Economy: Is the industry growing? Are economic conditions favorable?
Pros of Fundamental Analysis:
Ideal for long-term investment.
Helps understand the actual business you’re putting money into.
Less affected by short-term volatility.
Encourages rational decision-making.
Cons of Fundamental Analysis:
Takes time and effort to study.
May not tell you when exactly to buy or sell.
Requires understanding of finance, economics, and accounting.
Stock may stay undervalued for a long time despite good fundamentals.
✅ Which One Should You Choose?
It all depends on your personality, goals, and time commitment.
Go for Technical Analysis if:
You’re active and want to trade daily or weekly.
You like working with patterns and visuals.
You want to time your entry and exit precisely.
You are okay with taking risks for quick gains.
Go for Fundamental Analysis if:
You think long-term and want to build wealth.
You want to invest in solid companies.
You have patience and a stable mindset.
You prefer logic and numbers over charts.
⚖️ Can You Combine Both?
Yes, and that’s what many experienced market participants do.
This combined approach is called techno-fundamental analysis.
For example:
You use fundamentals to select a good company.
You use technicals to find the right entry point.
This way, you get the best of both worlds.
🧠 Final Thought
There’s no universal rule that says one method is always better. It’s all about what suits your style and objective.
If you’re building a portfolio for retirement or wealth over 10+ years, fundamental analysis is your friend.
If you want to trade actively and spot market opportunities daily or weekly, technical analysis is the way to go.
Over time, learning both will make you a more flexible and better-informed market participant.
Institutional Trading🏦 Institutional Trading
Institutional Trading refers to the buying and selling of large volumes of financial assets by big organizations such as banks 🏛️, hedge funds 📊, mutual funds 💼, pension funds 💰, and proprietary trading firms. These trades are typically high in value and are executed with sophisticated strategies, tools, and market access that retail traders don’t have.
Institutional traders use:
📈 Advanced algorithms
🧠 Data-driven analysis
💹 Block orders
🔍 Deep market research
🛡️ Strong risk management systems
Because of their size and influence, institutional trades can impact market prices, create liquidity zones, and often set the trend for retail traders to follow.
📌 In simple words:
Institutional Trading is how the "big players" move the markets — strategically, in high volume, and with professional precision.

Option Trading📘 Option Trading
Option Trading is a type of trading where you buy and sell contracts called options, instead of directly buying stocks. These contracts give you the right (but not the obligation) to buy or sell an asset at a set price within a specific time.
There are two main types:
🟢 Call Option – Right to buy the asset
🔴 Put Option – Right to sell the asset
Traders use options to:
📈 Make profits from price movements
🛡️ Hedge their investments
💰 Generate consistent income
⚖️ Manage risk with limited capital
Options are powerful because they offer leverage (small investment, big potential), but they also come with higher risks if not used carefully.
📌 In simple words:
Option Trading lets you bet on whether a stock will go up 📈 or down 📉, without owning it — and helps smart traders manage risk and reward like a pro.

Learn Advanced Institutional Trading🎓 Learn Advanced Institutional Trading
Advanced Institutional Trading is the high-level skill of trading financial markets the way professional institutions do — using big data, smart tools, and strategic decision-making to consistently win in the market. 💼📊
Learning this means going beyond basic charts or trendlines. It’s about understanding how big money moves, and how to:
🧠 Read institutional order flow
📉 Trade with algorithms and dark pools
📈 Use volume, liquidity zones & smart money indicators
🛡️ Apply institutional-level risk management
⚙️ Trade options, futures, and other derivatives at scale
💬 Interpret economic data like banks and funds do
You’ll learn to:
Identify entry and exit points based on institutional footprints
Use macro and micro market analysis
Build a trading system with logic and consistency
React to live news, earnings, and global events the way hedge funds do
📌 In simple words:
Learning Advanced Institutional Trading gives you the mindset, tools, and strategies used by the top 1% of traders — so you can trade smart, calculated, and professional just like the big players.

Master Institutional Trading🎯 Master Institutional Trading
Master Institutional Trading means learning to trade like the top financial institutions – with precision, strategy, and data-driven decisions. It’s the highest level of trading where you think and act like banks 🏦, hedge funds 📊, and investment firms 💼.
This mastery involves:
🔍 Understanding how smart money moves
📈 Analyzing volume, liquidity zones, and order flow
💹 Executing large trades without impacting the market
🛡️ Applying risk-controlled option & futures strategies
🧠 Using advanced tools, indicators, and market depth
🔄 Adapting to news, events, and institutional triggers
To master this skill, traders must develop:
📊 Strong technical + fundamental analysis
🧘 Discipline and emotion control
🧾 A solid, backtested trading system
💬 Knowledge of macroeconomic impacts
🧮 Command over greeks, derivatives, and hedging
📌 In simple words:
Mastering Institutional Trading means stepping into the shoes of the pros – learning how the big money operates, and trading with structure, edge, and confidence.

Institutional Intraday option Trading🏦 Institutional Intraday Option Trading
Institutional Intraday Option Trading is the practice of trading options contracts within the same trading day by large financial institutions such as hedge funds 📊, proprietary trading firms 💼, banks 🏛️, and asset managers 💰.
These trades are high-speed, high-volume, and data-driven, designed to capitalize on short-term price movements in the market.
🔧 How It Works:
Institutions use:
⚙️ Advanced algorithms & HFT (High-Frequency Trading)
📉 Options Greeks (Delta, Theta, Vega) to manage risk precisely
🔍 Market depth, volume flow, and order book analysis
🧠 Technical patterns + real-time news feeds
🛡️ Hedging strategies to protect larger positions
🧩 Key Objectives:
💰 Generate quick profits from intraday volatility
📈 Use options premium decay (Theta) to their advantage
📊 Adjust positions rapidly as market conditions change
🧾 Create delta-neutral or gamma-scalping strategies
🧠 What Makes It Different From Retail Intraday Trading?
🚫 No guesswork – it's all data-backed decisions
💼 Huge capital allows for tight spreads and custom contracts
📍 Institutional traders don’t chase trades – they create liquidity
📌 In simple words:
Institutional Intraday Option Trading is how the smart money uses options to profit from minute-to-minute market moves, while controlling risk and maintaining strategic precision.

Small Account Scalping / Challenge Trading🔍 What is Small Account Scalping?
Scalping means taking very short, quick trades — entering and exiting the market in a matter of seconds to a few minutes — to capture small price moves.
Now combine this with a small account — typically ₹1,000 to ₹10,000 (or $100 to $500). You're looking at a trading style where:
Tiny profits are taken quickly
High discipline and speed are critical
Risk-to-reward ratios are tight
Compounding is the core idea (small wins stack up)
Scalping with a small account is not just about earning big money quickly — it's often done as a "challenge" to prove skill, build discipline, or simply to show that trading isn’t about how much money you have, but how well you manage it.
🎯 What is Challenge Trading?
Challenge Trading is when a trader publicly sets a goal, like:
Turning ₹5,000 into ₹50,000
Growing $100 to $1,000 in 30 days
Doubling capital in 10 trades
These challenges are usually:
Documented daily (on YouTube, Telegram, or Instagram)
Done with full transparency
Focused on scalping or intraday setups
Built around strict rules and money management
Why do people do it?
For credibility
To learn discipline
To inspire beginners
To prove skill without needing big capital
📉 Why Most Traders Fail with Small Accounts
Let’s be honest — 90% of small account traders blow their capital within days or weeks.
Here’s why:
1. Overleveraging
Trying to turn ₹1,000 into ₹5,000 in one day? Most traders overtrade, use max quantity, and take unnecessary risks.
2. No Risk Management
They don’t respect stop-losses. One bad trade wipes 50% or more of their account.
3. Emotional Trading
Small capital = High emotions. Losing ₹300 from ₹1,000 hurts more than ₹3,000 from ₹1,00,000.
4. No Consistency
They jump from strategy to strategy. From breakout trading to option buying to indicator-based setups — nothing sticks.
5. Trying to Get Rich in One Day
Small accounts are not magic lamps. Trying to “flip money” quickly always backfires without a strong base strategy.
✅ How to Actually Win at Small Account Scalping
Let’s now focus on how to do it right — step by step.
✳️ Step 1: Choose the Right Market Instrument
For scalping with small capital, you want:
High liquidity (easy entries & exits)
Fast movement
Low capital requirement
Some good choices:
Index options like Nifty/BankNifty Weekly
FinNifty (Tuesday expiry)
Micro lots in Futures (if margin allows)
USDT/INR scalping on crypto exchanges (Binance, CoinDCX)
Stocks like Reliance, Tata Motors, SBIN – but be cautious
Avoid:
Illiquid stocks
High lot-size contracts
Multi-leg option strategies with high cost
✳️ Step 2: Pick a Scalping Setup That Works
You don’t need 10 strategies. Just 1-2 that work well on a small timeframe.
Examples:
Breakout on 1-min chart
Mark consolidation
Wait for breakout candle with volume
Enter with tight SL, book in 1:1.5 or trail
VWAP Rejection Entry
Wait for price to test VWAP
If rejected, enter in the opposite direction
Small risk, quick reward
Fakeout Trap
Market fakes breakout → reverses
Enter with confirmation of reversal
Common in BankNifty scalping
News-Based Scalping
RBI decisions, GDP data, Budget day
Extreme volatility → use strict stop-loss
✳️ Step 3: Master Position Sizing
Golden rule: Never lose more than 2-3% in one trade.
With ₹2,000 capital:
Risk max ₹40–₹60 per trade
Use option buying, not futures
Focus on quantity control
If you're using 50% of capital in one trade, you’re doing it wrong. That’s not scalping — that’s gambling.
✳️ Step 4: Use a Simple Tool Setup
Keep your charts clean.
Timeframe: 1-min or 3-min
Indicators: VWAP, EMA (9 or 20), Volume
Levels: Draw basic support/resistance
Avoid: Overloaded charts with 6 indicators
✳️ Step 5: Take Only 1–3 Trades a Day
In small account scalping, overtrading kills faster than losing.
Max 3 trades per day
Win 2 out of 3 = Green Day
Lose 2 = Stop trading
Stick to the plan. Live to trade another day.
✳️ Step 6: Focus on % Growth, Not ₹ Profit
Don’t compare yourself to traders making ₹20K/day
If you make ₹150 on ₹2,000 → that’s 7.5% gain
Make 5% a day for 20 days = 100% monthly compounding!
Small wins matter. They build discipline, confidence, and capital.
🧠 Psychology Behind Challenge Trading
To win the small account game, your mindset matters more than your strategy.
Mental Rules:
Treat every rupee as if it’s ₹1,000
Never chase revenge trades
Accept red days calmly — they’re part of the game
Celebrate consistency more than profit
📌 Tracking Your Progress
Make a Trading Journal:
Entry/Exit time
Setup used
Why you entered
How you felt
Profit/Loss
Over 30 days, this builds emotional and strategic control.
🚫 Mistakes to Avoid in Small Account Scalping
❌ Averaging in loss
❌ Trading without stop-loss
❌ Copying random Telegram tips
❌ Overtrading after losses
❌ Ignoring brokerage and slippage
❌ Expecting daily profits
🏁 Final Words: Is Small Account Scalping Worth It?
✅ YES — if:
You want to build confidence and discipline
You want to master trading with risk management
You like fast-paced, quick decision-making
❌ NO — if:
You’re in a hurry to make big profits
You trade emotionally
You don’t journal your trades or follow structure
It’s a journey — not a race.
With patience and process, your ₹2,000 account can one day fund your ₹2 Lakh trading journey.
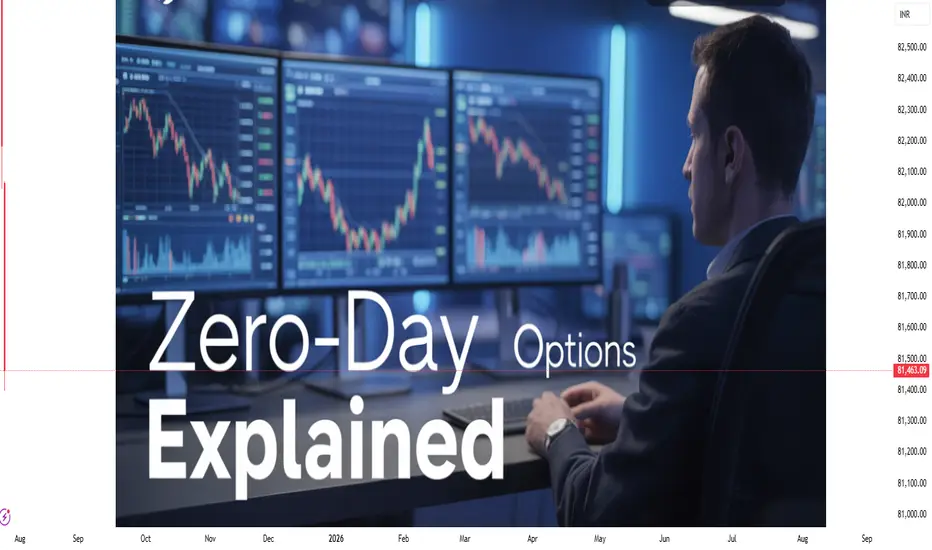
Zero-Day Options (0DTE)🔍 What Are Zero-Day Options (0DTE)?
The term “0DTE” stands for Zero Days to Expiration. These are options contracts that expire on the same day you buy or sell them.
In simple words, if today is Thursday and you’re trading a weekly Nifty or BankNifty option that expires today — you're trading a 0DTE option.
This type of option:
Has no time left beyond today.
Is highly sensitive to price movement.
Is extremely risky and extremely rewarding.
Earlier, we only had Thursday expiry for weekly options. But now, due to growing popularity, exchanges have introduced:
Nifty 50 expiry: Monday to Friday (Daily)
Bank Nifty expiry: Tuesdays and Thursdays
Fin Nifty expiry: Tuesdays
Sensex expiry: Fridays
This means 0DTE trading can now happen almost every day!
📈 Why 0DTE Trading Has Become So Popular
Zero-Day Options are now one of the most actively traded instruments — both by retail and institutional traders. Here’s why:
1. Small Premiums, Big Potential
Since the option expires today, its price (premium) is very low — sometimes just ₹5 or ₹10. If the market moves in your favor, that ₹10 option can quickly become ₹50 or ₹100.
That’s a 5x to 10x return, sometimes in just 15-30 minutes.
2. No Overnight Risk
You’re in and out the same day. No gap-ups, no global tension ruining your position overnight.
3. Scalping Friendly
Perfect for intraday traders who don’t want to hold positions for long.
4. Lots of Movement Near Expiry
Prices jump fast because time is running out. This gives more opportunities — but also more chances to get trapped.
5. Better Tools & Platforms
With modern brokers offering real-time data, scalping tools, and fast execution — more traders are trying 0DTE.
💼 How Do 0DTE Options Work?
Let’s take a simple example:
Today is Thursday, and Nifty is trading around 22,000.
You think it will rise, so you buy a 22,100 Call Option (CE) at 11 AM for ₹15.
If Nifty rises 50 points in the next 30 minutes, your option may become ₹45.
That’s 200% return.
But… if Nifty remains flat or falls, your option may go to ₹0 by the end of the day.
What Makes Them Move So Fast?
There are 3 reasons:
Time Decay (Theta): Since it's the last day, every minute that passes reduces the option's value if there's no movement.
Volatility: Even small market moves can cause big percentage changes in premium.
Greeks Sensitivity: Delta, Gamma, and Vega — all move faster near expiry.
🔁 Most Common 0DTE Strategies
1. Directional Option Buying
Buy a Call or Put based on price action.
Works best when there's momentum or breakout.
Example: Buy 22,100 CE at ₹10 → Nifty moves up → Exit at ₹50.
👍 High reward
👎 High risk (can go to zero)
2. Straddle/Strangle Selling (Non-Directional)
Sell both Call and Put at the same or nearby strikes.
You win if the market stays in range.
Example: Sell 22,000 CE and 22,000 PE → Market closes at 22,000 → Both go to zero.
👍 Profit from time decay
👎 If market breaks out in any direction, huge loss
3. Iron Condor
Sell OTM Call and Put spreads to capture decay in a defined range.
Lower risk, but also lower return.
👍 Safer than naked straddle
👎 Limited reward
4. Scalping with 1-2 Candle Momentum
Monitor breakouts on 1-min or 3-min chart.
Take quick entries and exits with small quantities.
👍 Quick gains
👎 Requires sharp execution and discipline
🏦 Who Uses 0DTE — Institutions or Retail?
🔹 Institutions:
Use algos to sell options in range.
Make profit from premium decay.
Use 0DTE to hedge portfolios or capture intraday IV changes.
🔹 Retail Traders:
Use for quick profits or gambling.
Often go for cheap out-of-the-money options.
Tend to overtrade without understanding risk.
⚠️ Risks Involved in 0DTE Trading
Let’s be honest — 0DTE options are not safe for everyone.
Here are the major dangers:
1. Time Decay (Theta Burn)
Every minute, the option loses value unless the market moves.
2. Fast Premium Erosion
Flat markets = quick loss. A ₹10 option can go to ₹0 in 15 minutes.
3. No Margin for Error
You need to be right on direction, timing, AND speed. All three.
4. Emotional Stress
Prices jump fast. Without discipline, you’ll end up revenge trading.
5. Overtrading
Traders often re-enter after loss without a plan — increasing risk.
🎯 Real-World Example of a 0DTE Trade
Let’s say it's Tuesday, and you’re trading BankNifty (expires today).
10:00 AM: BankNifty at 47,200
You buy 47,300 CE at ₹12
10:30 AM: BankNifty jumps 80 points
Your CE becomes ₹42
You exit — 250% return
But…
If BankNifty remained flat or dropped, that ₹12 option may go to ₹3 or even ₹0.
Same day. Same strike. Two opposite outcomes.
💡 Tips for Beginners to Trade 0DTE Safely
Start with Small Capital
Never risk your full capital on one trade.
Set Hard Stop-Loss
Exit if your option loses 40-50%. No second thoughts.
Trade in Breakout Zones
Avoid choppy ranges — they kill premiums.
Watch Open Interest + Price Action
See where the buyers/sellers are active.
Trade First Hour or Last Hour
That’s when you get big movements and clear setups.
Avoid Trading Just for Fun
0DTE is not for boredom. It’s for precision and skill.
Do Not Hold Till 3:30 PM
If you’re an option buyer, premiums usually die in the last 15 minutes.
🧠 Should You Trade 0DTE Options?
✅ YES — if:
You have solid technical analysis
You understand risk management
You can stick to a strict plan
You are okay with losing 100% on a bad trade
❌ NO — if:
You are emotionally reactive
You don’t track charts closely
You trade with borrowed or large capital
You don’t know how option Greeks work
🏁 Final Words
Zero-Day Options are not just another strategy. They are a whole new mindset of trading.
If used with the right knowledge, strict rules, and patience, they can become a powerful weapon in your trading toolbox. But if misused, they are the fastest way to drain your account.
Respect the instrument. Learn the rules. Start small. Scale with confidence.
Meme Stocks & Retail MomentumIn the last few years, the world of stock markets has witnessed something unusual. Stocks of struggling companies suddenly skyrocketed, not because of strong fundamentals or big institutional investments, but because of... memes, social media posts, and retail trader hype.
Welcome to the world of Meme Stocks and Retail Momentum.
This isn’t traditional investing. It’s the new-age, internet-powered way of moving markets — often driven more by emotion and community than by earnings reports or financial analysis.
They are not driven by traditional factors like strong balance sheets, industry leadership, or earnings growth. Instead, they’re driven by community hype and retail investor activity.
Key Features of Meme Stocks:
Sudden, dramatic price surges 🚀
Lots of trading activity by small/retail investors
Heavy buzz on social media & forums
High volatility (prices can jump or crash in hours)
Often targeted by short-sellers
🎯 Real-Life Examples of Meme Stocks
1. GameStop (GME) – USA
In early 2021, GME went from $17 to nearly $483 in weeks. Why?
It was heavily shorted by hedge funds.
Reddit users decided to push back and caused a short squeeze.
Retail investors coordinated buying, sending the price to the moon.
This was a social movement, not just a trade. It became a battle between “small traders” and “Wall Street giants.”
2. AMC Entertainment (AMC)
A struggling cinema chain during COVID saw its stock go up over 1000% in months.
Why?
Meme hype
Reddit army
FOMO (Fear of Missing Out)
3. Bed Bath & Beyond, Blackberry, Nokia
All had their moment as meme stocks even if their business fundamentals were weak.
4. Indian Examples
While India hasn’t seen the exact same meme stock culture, we’ve seen similar retail momentum in:
Zee Entertainment (after merger news & social buzz)
Vodafone Idea (VI) – due to social campaigns and hopes
IRCTC – when people piled in during rapid rallies
👥 What is Retail Momentum?
Now let’s talk about retail momentum — the force behind meme stocks.
Retail Momentum means:
A sudden inflow of buying (or selling) from small, individual investors, usually following trends or hype.
This momentum is usually:
Fast-moving
Emotional
Trend-following
Influenced by influencers, YouTubers, or social forums
Retail traders often follow:
WhatsApp groups
YouTube tips
Trending stocks on Twitter
Telegram pump groups
When thousands (or lakhs) of people chase the same stock, price moves dramatically — even if there's no news or earnings change.
🤖 How Social Media Creates Market Movement
Social media has turned into a financial battleground.
Here’s how a meme stock or retail wave starts:
One user posts a chart, theory, or meme on Reddit, X, or Telegram.
It goes viral. Thousands like or comment.
YouTubers make videos explaining how it can go “5x”.
Traders start piling in.
Price moves rapidly.
News channels pick it up.
Even more retail investors join.
The price spikes even further.
At this point, the stock is not rising on logic. It's rising on human emotion and network effect.
📈 Why Do Meme Stocks Go Up So Fast?
Short Squeezes
Hedge funds or big players short the stock.
Retail investors aggressively buy.
Short sellers are forced to cover — which pushes the price up further.
FOMO (Fear of Missing Out)
When people see others making 100%, 200% in days, they panic and enter at any price.
Retail Buying Power
Today, thanks to apps like Zerodha, Robinhood, Upstox, Groww — it’s easy to buy a stock.
Even a small investor can join in with ₹500.
Community Psychology
People feel like part of a movement.
They hold, buy, and even defend the stock online — often calling it “diamond hands.”
💣 Why Do Meme Stocks Crash?
No Fundamental Support
Eventually, reality hits. The stock isn’t worth the inflated price.
Profit Booking
Early traders book profits → price falls → panic spreads → others sell.
Regulatory Actions
Exchanges might restrict buying (like Robinhood did in GME).
Dilution
Companies issue new shares to cash in on hype → lowers value per share.
🧠 Psychology Behind Meme Stocks
Meme stocks are a human behavior experiment in real-time.
They show:
The power of belief
Herd mentality
Rebellion against institutions
Internet unity
Addiction to risk and gambling thrill
It’s part social movement, part financial play, and part crowd psychology.
🧰 Tips for Trading Retail Momentum Stocks
Enter early or don’t enter at all
Don’t jump in when it's already trending on YouTube.
Use trailing stop-loss
Lock your profits as the stock climbs.
Book profits partially
Don’t wait for the “moon.” Sell in phases.
Avoid margin/leverage
You can be wiped out in one bad move.
Track social buzz
Use tools like Google Trends, Twitter hashtags, Reddit mentions.
Never invest your main capital
Treat it as a speculative side bet, not a long-term investment.
🏁 Final Thoughts: Meme Stocks Are a Mirror of Modern Markets
Meme stocks and retail momentum are not going away. They are part of the new-age investor culture:
Fast-paced
Emotionally charged
Social media influenced
Sometimes logical, often not
They’ve changed how people see the markets. Retail investors now know they can move prices. But with that power comes great risk.
If you want to explore meme stocks, do it with eyes wide open, a small budget, and full acceptance of the risk.

Divergence Secrets📌 What is Divergence?
Divergence occurs when the price action of a security moves in the opposite direction of a technical indicator or momentum oscillator.
There are two main types:
Regular Divergence – Signals potential reversal
Hidden Divergence – Signals trend continuation
🔍 1. Regular Divergence (Reversal Signal)
Occurs when:
Price makes a higher high, but the indicator makes a lower high (bearish divergence)
Price makes a lower low, but the indicator makes a higher low (bullish divergence)
✳️ Example:
Bearish divergence: Price is rising, but RSI is falling → Possible upcoming downtrend.
Bullish divergence: Price is falling, but MACD is rising → Possible upcoming uptrend.
This tells you the momentum is weakening, even though price appears strong.
🔍 2. Hidden Divergence (Trend Continuation)
Occurs when:
Price makes a higher low, but the indicator makes a lower low → Bullish hidden divergence
Price makes a lower high, but the indicator makes a higher high → Bearish hidden divergence
Hidden divergence shows that momentum is aligning with trend direction and suggests continuation.
📈 Indicators to Spot Divergence
RSI (Relative Strength Index)
Best for spotting overbought/oversold and divergences.
MACD (Moving Average Convergence Divergence)
Great for visualizing momentum divergence.
Stochastic Oscillator
Good for short-term divergence.
On-Balance Volume (OBV)
Helps spot divergence using volume behavior.
CCI (Commodity Channel Index)
🔐 Institutional Secret: Volume Divergence
Institutions look for divergence between price and volume:
Price making higher highs but volume falling? Institutions might be distributing (smart money exiting).
Price making lower lows but volume rising? Could be accumulation.
This is often missed by retail traders!
✅ How to Trade Divergence (Checklist)
🔸 Entry Strategy:
Wait for divergence confirmation on a strong indicator (RSI/MACD)
Use candlestick reversal patterns near divergence zones
Align with support/resistance or trendlines
🔸 Stop-Loss:
Always place below/above recent swing low/high (depending on long or short)
🔸 Take-Profit:
Use Fibonacci levels, previous structure, or trend-based targets
⚠️ Common Mistakes
Trading divergence without price confirmation
Forcing divergence on weak or flat trends
Ignoring higher timeframe context
Using only one indicator
Always confirm with price structure, volume, and multi-timeframe analysis.
🎯 Pro Tip: Combine with Institutional Tools
Use Order Blocks + Divergence = Strong reversal signal
Combine Liquidity Zones + Divergence = Catch smart money traps
Divergence + Imbalance zones = Laser-precise entries.

Learn Institutional Trading🔷 What is Institutional Trading?
Institutional Trading refers to how big players (institutions) like mutual funds, hedge funds, pension funds, insurance companies, and proprietary trading firms operate in financial markets—especially in stocks, futures, and options. These institutions trade with huge capital—often in crores or billions of rupees/dollars—and have access to advanced tools, data, and insider-level insights that retail traders (individual traders like us) do not.
They don’t trade based on tips, YouTube calls, or simple indicators like RSI or MACD. They trade based on order flow, liquidity zones, volume data, and macroeconomic models. Their strategies are often data-driven, algorithmic, and backed by deep research.
🔷 Why is it Important to Learn Institutional Trading?
Because retail traders often lose money by following surface-level analysis. If you want to play against or with the big boys, you need to understand how institutions think, trade, and manipulate the market to create liquidity and trap uninformed traders.
Once you start thinking like an institution, you’ll stop falling for fake breakouts, news-based traps, or retail patterns that no longer work.
🔷 How Do Institutions Trade?
Institutions don’t just click "buy" or "sell" like retail traders. They use strategic and layered approaches to build or unload positions without disrupting the market.
Let’s break down some techniques:
1. Accumulation and Distribution
Accumulation Phase: This is where institutions silently buy large quantities of a stock at lower prices without moving the market too much.
Distribution Phase: After pushing the price up (with smart buying), they start selling slowly to retail traders who are buying out of FOMO.
👉 Retail gets trapped at the top, institutions exit with profit.
2. Order Flow & Liquidity Grabs
Institutions need liquidity to enter or exit. That’s why they often:
Create fake breakouts or false signals to trap retailers.
Induce stop-loss hunting moves to trigger retail orders (that’s their liquidity).
Then, they reverse the market direction, moving it in their favor.
This is often called Smart Money Concepts.
3. Volume Weighted Trading
Institutions monitor VWAP (Volume Weighted Average Price) to decide their entries/exits. They break up large orders into small pieces and execute them using algorithms to stay unnoticed.
4. Use of Derivatives (Options & Futures)
They hedge their large cash market positions using options and futures, which allow them to manage risk efficiently while maximizing profit.
🔷 Institutional Trading Strategies
Here are some strategies that institutions commonly use (simplified for learning):
📌 1. Long/Short Equity
Long on undervalued stock
Short on overvalued stock in the same sector
Reduces risk, aims to profit from relative performance.
📌 2. Arbitrage Trading
Taking advantage of price differences in different markets (e.g., cash-futures arbitrage).
📌 3. Sector Rotation Strategy
Moving capital from underperforming sectors to upcoming ones based on macroeconomic analysis (e.g., rotating from IT to Pharma).
📌 4. Options Hedging
Buying call/put options to protect existing large positions.
Selling premium to generate income (covered calls, iron condors).
📌 5. Event-Driven Trades
Based on earnings, mergers, policy changes (institutions often trade heavily on such events, with better insight and preparation).
🔷 Signs of Institutional Activity
Watch for these clues:
Unusual volume with no news
Sudden reversals after stop-loss hits (classic liquidity grab)
Consolidation near support/resistance with rising volume (accumulation)
Breakouts with heavy volume follow-up (institutional buying confirmation)
Options OI buildup in a particular strike
🔷 How to Learn Institutional Trading (Step by Step)
Understand Market Microstructure
Learn how orders, bid-ask spreads, and liquidity actually work.
Master Price Action and Volume Analysis
Indicators lag. Institutions trade with price and volume.
Learn about Order Blocks, Fair Value Gaps
These are institutional concepts showing where smart money entered.
Study Smart Money Concepts (SMC)
Focus on concepts like:
Liquidity Sweep
Inducement
Mitigation
Imbalance zones
Market Structure Shift
Use TradingView Smart Tools
Explore order block indicators, volume profile, VWAP, etc.
Observe Options Open Interest (OI)
Track institutional options positions using OI analysis.
Backtest and Practice
Use market replay tools to simulate institutional strategies.
🔷 Myths About Institutional Trading
❌ "Institutions only invest, they don’t trade intraday."
→ Truth: They have high-frequency trading (HFT) algorithms that execute millions of trades daily.
❌ "You need crores to trade like an institution."
→ Truth: You can mirror their logic even with small capital—if you understand market structure, liquidity, and volume.
❌ "Retail traders can’t win."
→ Truth: You can’t win if you play their game with your rules. But if you learn how they play, you can follow their footprints.
🔷 Final Thoughts
Institutional Trading is not a “strategy,” it’s a mindset.
It's about understanding:
Where is smart money entering or exiting?
Where is retail being trapped?
Where is liquidity sitting?
Once you start focusing on market structure, volume behavior, price action, and liquidity zones, your trades will become more accurate, logical, and profitable.
Retail indicators lag. Institutions don’t follow them.
They create the moves, while indicators show what already happened.

Trading Master Class With Experts.
🔶 Who Are These "Experts"?
The “experts” in a trading master class are usually:
✅ Professional traders working with institutions, hedge funds, or prop firms
✅ Full-time independent traders with consistent profit history
✅ Option Greeks and derivatives specialists
✅ Technical and price action experts
✅ Economists and market analysts
They are people who have traded for years, been through different market cycles, and know what works and what fails in the real market.
🔷 What You Will Learn in a Trading Master Class With Experts?
Here is a detailed breakdown of what such a master class includes:
🧠 1. Trading Mindset & Psychology Mastery
“90% of trading is mindset, not charts.”
Experts teach you:
How to control emotions like fear, greed, FOMO
How to build discipline, patience, and consistency
How to handle losses without revenge trading
How to develop a winning mindset like a hedge fund trader
📊 2. Advanced Technical Analysis (Beyond Indicators)
Forget about just MACD, RSI, Bollinger Bands.
Experts teach:
Price Action Secrets
Multi-timeframe analysis
Structure-based trading (HH, HL, LL, LH)
Breakout vs Fakeout patterns
Volume analysis and hidden traps
🎯 You’ll learn to predict moves with logic, not luck.
📈 3. Institutional Concepts (Smart Money Approach)
This is a core part of the class. You will learn how institutions trade, including:
Liquidity Zones & Order Blocks
Stop Loss Hunting Techniques
Fair Value Gaps (FVG)
Break of Structure (BOS)
Mitigation Blocks
Imbalance trading
You’ll finally understand:
"Why price reverses after breakout?”
"Why your stop loss gets hit and then the market moves in your direction?”
Experts teach you how to track institutional footprints and follow their logic.
📉 4. Derivatives & Options Trading Mastery
For advanced traders, especially in India (Nifty/Bank Nifty), the class covers:
✅ Options Chain Interpretation
✅ Open Interest (OI) Strategy
✅ Option Greeks (Delta, Gamma, Theta, Vega)
✅ Directional & Non-Directional Trading
✅ Intraday Option Scalping Techniques
✅ Straddles, Strangles, Spreads, Iron Condors
✅ Event-based strategies (Budget day, RBI day, earnings)
Live examples are shown using tools like Sensibull, QuantsApp, TradingView.
🔐 5. Risk Management Like Professionals
Trading without risk control is gambling.
In the master class, you’ll learn:
Position Sizing Models
Risk-to-Reward (RRR) Strategies
How to protect capital in volatile markets
Importance of trade journaling
When not to trade (which is as important as trading)
🎯 You’ll be taught how to think like a fund manager, not a gambler.
🧾 6. Trading Plan and Strategy Building
By the end of the class, you will have your own trading system, built with guidance from the experts.
Includes:
Entry and exit rules
Setup confirmation techniques
Trade management
Backtesting
Live trading practice
🎯 You’ll no longer depend on Telegram groups or paid signals. You will have your own tested edge.
💡 7. Live Market Sessions and Analysis
One of the most powerful parts of a master class is live sessions with experts, where you:
✅ Watch experts analyze the market in real-time
✅ Learn how they decide trades
✅ Ask questions on-the-spot
✅ See how they manage losses and winners
✅ Get live updates on index, stocks, options strategies
This removes confusion like:
“Should I buy or sell now?”
“Is this a trap or breakout?”
🔧 8. Tools, Platforms & Market Scanners Training
Learn to use:
TradingView Pro with institutional indicators
Option Analytics Tools (Sensibull, Opstra, Quantsapp)
Volume & Order Flow Tools
How to read market depth (Level 2 data)
How to use backtesting software for strategy building
🎯 The goal is to make you fully independent and tool-savvy.
📁 What’s Included in a Master Class Package?
A typical premium expert trading master class includes:
📌 20-30 hours of recorded sessions
📌 Weekly live sessions (Q&A, market review)
📌 Real trade examples (screenshots or live trades)
📌 Market homework and trade journaling
📌 Access to private trading communities
📌 Lifetime access + updates
📌 Strategy PDFs, cheat sheets
📌 Certificate of Completion (optional)
🔑 Benefits of Taking This Master Class
✅ Get direct mentorship from people who actually trade
✅ Save years of trial & error
✅ Learn real strategies, not just theory
✅ Increase accuracy and reduce losses
✅ Learn why you lose money and how to fix it
✅ Build discipline, process, and patience
✅ Join a community of focused traders
👨🏫 Who Should Join?
This class is perfect for:
Traders who lose consistently and don’t know why
Those who want to learn institutional-style trading
Option traders who want to become premium sellers / scalpers
People ready to invest time and discipline—not chasing “quick money”
Anyone who wants to turn part-time trading into serious skill
🔁 Real Case Example:
Imagine a Bank Nifty trader who always loses during breakouts. He joins the master class.
He learns:
How institutions create false breakouts
How to identify order blocks & liquidity grabs
How to position sell options around key zones
How to protect his capital with hedging and RRR control
Now, instead of gambling, he trades with confidence and understands what’s happening behind the candles.
🎓 Final Words
A Trading Master Class With Experts is like getting a direct map to reach consistent profitability in the market.
It is not a magic formula, but it trains your brain to think like a professional, trade like an institution, and manage risk like a fund.
It teaches you to focus not on tips, indicators, or chasing, but on:
Process
Discipline
Data
Edge
Execution.

Institution Option Trading📌 1. Multi-leg Strategic Trades
Institutions rarely take single-leg naked options. They use advanced setups like:
✅ Vertical Spreads (Bull Call / Bear Put)
✅ Iron Condor / Iron Butterfly
✅ Calendar / Diagonal Spreads
✅ Ratio Spreads
✅ Box Spreads (riskless arbitrage)
These strategies offer:
Defined risk
Better reward-to-risk ratios
Controlled exposure to market direction and volatility
📌 2. Delta Hedging
Institutions holding large stock or futures positions hedge delta using options.
For example:
Holding ₹50 crore worth of Reliance shares
Buy Reliance PUT options to protect against fall
Or, dynamically sell call options as price rises to adjust exposure
This is called Delta Hedging, and it’s done in real-time using algorithms.
📌 3. Open Interest (OI) Tracking
Institutions use option chain OI to:
Spot support/resistance based on strike activity
Identify traps and short-covering zones
Detect institutional presence via unusual OI spikes
For example:
Sudden OI surge at 22,000 PE in Bank Nifty
Might indicate put writers protecting downside, expecting reversal
📌 4. Time Decay (Theta) Exploitation
Institutions are the real beneficiaries of theta decay.
They sell options (straddles, strangles, spreads) around key levels (like VWAP, CPR) and let time decay eat the premium.
Especially on:
Expiry day (Thursday in India)
After big moves
In range-bound markets
They deploy millions of rupees in premium-selling strategies to generate daily/weekly returns.
🔶 Institutional Option Strategies Explained
Let’s break down some common institutional strategies in real terms:
🔷 1. Short Straddle
Sell ATM Call and ATM Put at same strike
Works in sideways markets
Profits from time decay and low movement
✅ Used heavily by institutions on weekly expiry
✅ Risk: Sharp move in either direction
🔷 2. Bull Call Spread
Buy a lower strike Call
Sell a higher strike Call
Lower cost, limited risk & reward
✅ Used when institutions expect moderate bullish move
✅ Controlled exposure + reduced premium
🔷 3. Iron Condor
Sell OTM Call & Put
Buy further OTM Call & Put
Net credit strategy with limited risk
✅ Best in low volatility, non-trending markets
✅ Profitable if market stays between two levels
🔷 4. Calendar Spread
Sell near-term option
Buy far-month option (same strike)
Used when:
Near-term IV is high
Long-term view is neutral or unclear
✅ Profits from IV difference and time decay advantage
🔷 5. Protective Put
Holding equity or futures
Buy Put Option to insure position
Institutions use this to hedge large portfolios during high uncertainty (e.g., elections, war threats, Fed rate decisions)
🔶 Real Example – How an Institution Trades Nifty Options
Let’s say Nifty is at 22,000.
📊 Scenario:
IV is high
No major event ahead
OI buildup seen at 22000 PE and 22100 CE
📈 Institutional Strategy:
Sell 22000 PE and 22100 CE (Short Straddle)
Buy 21900 PE and 22200 CE (hedge legs)
Result:
If Nifty stays in range → theta decay = profit
If it breaks out → hedge legs protect loss
✅ Low-risk, smart premium capture strategy
🔶 Key Tools Institutions Use in Options Trading
Bloomberg Terminal (real-time global data)
Opstra / Sensibull / QuantsApp (for Greek/OI analysis)
Option Vega/IV scanners
Algo trading engines
Python/R-based custom backtesting engines
Retail traders can start by using TradingView + Sensibull/Opstra.
🔶 How to Learn Institutional Options Trading?
Here’s a step-by-step approach:
✅ Understand Options Basics – Calls, Puts, Moneyness
✅ Study Greeks Deeply – Delta, Theta, Vega, Gamma
✅ Learn Option Chain Analysis – OI, IV, Max Pain
✅ Explore Spreads & Multi-leg Setups
✅ Practice Risk Management & Position Sizing
✅ Track Institutional Behavior via OI shifts & volume
✅ Backtest Your Strategy before going live
🔶 Final Takeaways
Institutional Options Trading is not about guessing. It’s about data, structure, and risk.
Retail traders who try to copy institutions without understanding their objectives often get trapped.
But if you:
Study Smart Money behavior
Use strategic entries based on volume + volatility
Respect risk and capital preservation
…you can trade with the institutions, not against them.
