Part 8 Trading master Class Types of Option Trading Strategies
Options strategies are broadly divided into single-leg and multi-leg strategies.
Single-leg strategies: Involve buying or selling one option.
Multi-leg strategies: Combine two or more options (calls and puts) to create structured trades for specific market conditions.
Let’s discuss each category in detail.
Harmonic Patterns

XAUUSD Scalp Tape readingThese were my last two scalps on XAUUSD from the previous session (mid-NY). This is how I was reading the tape at that time.

Premium Chart Knowledge Strategy and Leverage
Option trading allows traders to speculate on price movements or hedge positions with limited capital, offering leverage and flexibility through calls (buy) and puts (sell) contracts.
Risk and Reward
Options carry high profit potential but significant risk due to time decay and volatility. Successful trading requires analysis, discipline, and understanding of premium pricing and expiry.

Candle Pattern Explained There are two primary types of options: Call Options and Put Options. A Call Option gives the buyer the right to purchase an underlying asset at a specific price (called the strike price) before or on a certain date (known as the expiry date). Traders buy calls when they expect the price of the asset to rise. Conversely, a Put Option gives the buyer the right to sell the asset at the strike price within a specific period. Traders buy puts when they anticipate the asset’s price will fall.

Part 6 Institutional Trading Option Trading in India
In India, option trading is available on major exchanges like NSE and BSE, primarily for:
Equity Options (Stocks)
Index Options (NIFTY, BANK NIFTY, FINNIFTY)
Contracts are settled in cash, and trading happens in defined lot sizes. Most retail traders prefer index options due to liquidity and low margin requirements.

Part 3 Institutional Trading Uses of Option Trading
Hedging: Protecting an existing portfolio from adverse price movements.
Example: Buying a Put Option to hedge a long stock position.
Speculation: Betting on price movement direction with limited capital.
Example: Buying Call Options if expecting a stock to rise.
Income Generation: Selling options to collect premiums in range-bound markets.
Example: Covered Call Writing.

Part 2 Ride The Big MovesUses of Option Trading
Hedging: Protecting an existing portfolio from adverse price movements.
Example: Buying a Put Option to hedge a long stock position.
Speculation: Betting on price movement direction with limited capital.
Example: Buying Call Options if expecting a stock to rise.
Income Generation: Selling options to collect premiums in range-bound markets.
Example: Covered Call Writing.
Types of Option Trading Styles
American Options: Can be exercised any time before expiry.
European Options: Can be exercised only on the expiry date.
(In India, most index and stock options are European style.)

Part 1 Ride The Big Moves Common Option Trading Strategies
Options can be used for various market views—bullish, bearish, or neutral. Some popular strategies include:
Bullish Strategies:
Long Call
Bull Call Spread
Cash-Secured Put Writing
Bearish Strategies:
Long Put
Bear Put Spread
Covered Call Writing
Neutral Strategies:
Iron Condor
Straddle
Strangle
These strategies help traders manage risk and reward depending on their outlook and volatility expectations.

Part 2 Intraday Master ClassParticipants in Option Trading
Option Buyers (Holders):
Pay premium to gain the right to buy/sell.
Risk limited to the premium.
Aim to profit from favorable price movement.
Option Sellers (Writers):
Receive premium from buyers.
Take on potential unlimited risk.
Often use strategies to generate income.

Intraday Scalping Tips: Mastering the Art of Fast Profits1. What Is Intraday Scalping?
Scalping is a subset of intraday trading, but with a much shorter time frame. Instead of holding trades for hours, scalpers enter and exit positions within seconds or minutes. The goal is to capture tiny price movements, often ranging from 0.1% to 0.5%, multiple times a day.
For example, if a stock moves from ₹500 to ₹501, a scalper may book a quick profit and repeat the process across different stocks or price levels. Over the course of the day, these small gains can accumulate into substantial profits if managed properly.
However, because scalping involves high trading frequency, transaction costs, timing, and execution speed become critical factors.
2. The Psychology of a Scalper
Scalping is not just about strategy—it’s about mindset. A successful scalper must be calm under pressure, quick in decision-making, and emotionally detached from wins or losses.
Unlike swing traders, scalpers can’t afford to wait for a market to “come back.” They must accept small losses quickly and move on to the next trade. Emotional control and discipline are therefore more important than technical knowledge alone.
Key psychological traits include:
Speed and decisiveness – No hesitation when an entry or exit signal appears.
Emotional neutrality – Avoid greed after profits or frustration after losses.
Discipline – Follow your plan and respect stop-loss limits, no matter what.
3. Essential Tools for Scalping
To succeed as a scalper, you need a professional setup that allows for precision and speed:
Fast Internet Connection: Delays of even a few seconds can affect profits.
Reliable Trading Platform: Choose brokers and platforms with low latency and fast execution (like Zerodha, Angel One, or Upstox for Indian markets).
Direct Market Access (DMA): Helps execute orders directly without delays.
High-Quality Charting Software: For real-time technical analysis (e.g., TradingView).
Level 2 Data / Market Depth: To understand bid-ask spreads and liquidity levels.
Having these tools in place ensures your decisions are based on real-time data and executed without technical lag.
4. Choosing the Right Stocks for Scalping
Not every stock is suitable for scalping. The best scalping stocks share certain characteristics:
High Liquidity: The stock should have high trading volume so you can enter and exit quickly.
Tight Spreads: A small bid-ask spread ensures that transaction costs remain low.
Volatility: Moderate price movement ensures enough opportunities without erratic swings.
Popular Stocks: Large-cap or index-based stocks like Reliance Industries, HDFC Bank, or Infosys are often good choices due to consistent volume.
Scalpers usually stick to 3–5 familiar stocks daily, mastering their price behavior instead of chasing every trending name.
5. Technical Indicators That Work for Scalping
Scalping relies heavily on technical indicators for quick decision-making. Some of the most effective tools include:
Moving Averages (MA): Short-term MAs like 5-EMA and 9-EMA help identify quick trends and crossovers.
VWAP (Volume Weighted Average Price): Acts as a dynamic support and resistance level; many institutional traders use it for intraday benchmarks.
Relative Strength Index (RSI): Helps identify overbought or oversold conditions (ideal range for scalpers: 5–15 RSI periods).
Bollinger Bands: Indicate volatility and possible breakout zones.
Volume Analysis: Volume spikes often precede major price movements—critical for timing entries.
The best scalpers combine 2–3 of these tools rather than cluttering charts with too many indicators.
6. Entry and Exit Strategies
Scalping thrives on timing and precision. Here are a few commonly used strategies:
a. Breakout Scalping
Scalpers wait for the price to break above resistance or below support with strong volume confirmation. Entry happens immediately after the breakout, and exits occur once quick profit targets (0.3%–0.5%) are achieved.
b. Range Scalping
When markets move sideways, scalpers buy near the lower boundary of the range and sell near the upper boundary. Stop-losses are placed just beyond the range.
c. Momentum Scalping
In this method, traders ride short bursts of momentum caused by news, earnings releases, or large market orders. Scalpers jump in with the trend and exit at the first sign of weakness.
Regardless of the method, stop-losses must be placed immediately—typically 0.25%–0.5% below the entry price—to control risk.
7. The Importance of Risk Management
Scalping without risk management is gambling. Since gains are small, even a few large losses can wipe out profits. Effective risk control ensures survival and consistency.
Position Sizing: Don’t risk more than 1%–2% of total capital per trade.
Tight Stop-Loss: Always use stop-loss orders to cap losses quickly.
Avoid Overtrading: Set a limit on the number of trades per day. Quality over quantity.
Keep Costs in Check: Brokerage and taxes can eat into profits. Use low-cost brokers.
Successful scalpers often say: “Protect your capital first; profits will follow.”
8. Trading Discipline and Routine
Consistency is key in scalping. Having a structured trading routine ensures focus and control.
Morning Preparation:
Review pre-market news, global cues, and technical setups.
Identify your watchlist of 3–5 liquid stocks.
Mark key intraday support and resistance zones.
During Trading Hours:
Trade only within your strategy and avoid impulsive trades.
Monitor volume surges and price reactions near key levels.
Book profits quickly; don’t aim for large moves.
Post-Market Review:
Analyze your trades to identify mistakes or strengths.
Maintain a journal recording entry/exit points, emotions, and results.
This continuous improvement mindset separates professional scalpers from amateurs.
9. Avoid Common Scalping Mistakes
Even experienced traders can fall into common traps. Be aware of these:
Over-leveraging: Using too much margin increases the risk of large losses.
Ignoring News Events: Sudden announcements can cause unexpected volatility.
Chasing Trades: Don’t enter trades just because of missed opportunities.
Neglecting Transaction Costs: Frequent trading magnifies brokerage and taxes.
Lack of Patience: Waiting for the right setup is part of the discipline.
Remember, in scalping, one bad trade can ruin ten good ones.
10. Building a Winning Scalping Mindset
Success in scalping is not about winning every trade—it’s about consistency. A skilled scalper understands that small, steady gains compound over time.
Focus on process over profit:
Stick to your rules.
Accept small losses gracefully.
Never revenge-trade after a loss.
Stay humble—markets reward patience and discipline.
Professional scalpers often compare their work to that of a surgeon: precise, focused, and unemotional.
Conclusion
Intraday scalping is an art that blends speed, strategy, and discipline. It may not suit everyone—its fast pace and emotional intensity demand exceptional control and focus. However, for those who master it, scalping can be one of the most consistent and lucrative trading styles.
By understanding market micro-movements, managing risk, and following a structured trading plan, traders can turn tiny price fluctuations into meaningful daily income. In the world of scalping, success doesn’t come from predicting the market—it comes from reacting to it faster and smarter than everyone else.
Part 1 Intraday Master ClassWhat Are Options?
An option is a financial contract that gives the holder the right, but not the obligation, to buy or sell an underlying asset (such as stocks, indices, or commodities) at a predetermined price (called the strike price) before or on a specific expiry date.
Options are classified into two types:
Call Option: Gives the right to buy an asset at a specific price.
Put Option: Gives the right to sell an asset at a specific price.
For this right, the buyer of an option pays a premium to the seller (writer) of the option.

Interest Rates Explained: Definition, Types and DeterminantsDefinition of Interest Rates
An interest rate is the cost of borrowing money or the reward for saving it, expressed as a percentage of the principal amount per period, typically per year. When you borrow money, you pay interest; when you lend or deposit money, you earn interest. Essentially, it represents the “price” of money — how much it costs to use someone else’s funds for a specific time.
For example, if you borrow ₹100,000 at an annual interest rate of 10%, you owe ₹10,000 as interest after one year. Conversely, if you deposit ₹100,000 in a bank account offering 6% interest, you earn ₹6,000 in a year.
Types of Interest Rates
Interest rates can be classified into several types depending on the context and application.
1. Nominal and Real Interest Rates
Nominal interest rate is the rate stated on financial instruments or loans without adjusting for inflation.
Real interest rate is the nominal rate minus the inflation rate.
Real Interest Rate = Nominal Rate − Inflation Rate
For example, if a bank offers 8% nominal interest and inflation is 5%, the real interest rate is 3%. Real rates reflect the true earning or cost of money in terms of purchasing power.
2. Fixed and Floating (Variable) Interest Rates
Fixed rate remains constant throughout the loan or investment term. This offers stability and predictability.
Floating or variable rate changes over time, often linked to a benchmark such as the repo rate or LIBOR (London Interbank Offered Rate). These rates fluctuate with market conditions.
3. Simple and Compound Interest
Simple interest is calculated only on the principal amount.
Simple Interest
=
𝑃
×
𝑅
×
𝑇
/
100
Simple Interest=P×R×T/100
Compound interest is calculated on both the principal and accumulated interest. It grows faster because of the compounding effect — interest on interest.
4. Short-term and Long-term Interest Rates
Short-term rates apply to loans or deposits with a maturity of less than a year.
Long-term rates apply to financial instruments with longer maturities, such as bonds or mortgages.
Determinants of Interest Rates
Interest rates are influenced by a combination of macroeconomic factors, government policies, and market dynamics. The key determinants include:
1. Central Bank Policy
The central bank (e.g., the Reserve Bank of India, or RBI) plays a crucial role in setting benchmark rates. In India, the repo rate — the rate at which banks borrow from the RBI — serves as the primary policy rate. When the repo rate rises, borrowing becomes more expensive, reducing liquidity and controlling inflation. Conversely, a lower repo rate stimulates borrowing and investment.
2. Inflation
Inflation has a direct relationship with interest rates. Higher inflation erodes the purchasing power of money, prompting central banks to raise rates to curb excessive spending. On the other hand, when inflation is low, rates are reduced to encourage consumption and investment.
3. Demand and Supply of Credit
When businesses and consumers demand more loans, the demand for credit rises, pushing interest rates up. If the supply of funds in the banking system is high, interest rates tend to fall.
4. Economic Growth
In a growing economy, investment opportunities expand, and demand for capital increases, often leading to higher rates. During recessions, central banks lower rates to revive growth.
5. Government Borrowing
When a government borrows heavily through bonds, it can increase the overall demand for credit, leading to higher interest rates, especially if private savings are limited.
6. Global Factors
Global interest rate trends, especially in major economies like the United States, influence domestic rates. For instance, if U.S. rates rise, investors might shift funds from emerging markets, prompting those countries to raise rates to retain capital.
Role of Interest Rates in the Economy
Interest rates act as a powerful lever of economic control, influencing spending, investment, inflation, and exchange rates. Their effects can be seen in several areas:
1. Consumption and Savings
High interest rates encourage people to save more and borrow less because the cost of loans increases and returns on savings rise. Low rates have the opposite effect — borrowing becomes cheaper, boosting consumption.
2. Business Investment
Companies often finance expansion through borrowed funds. When rates are low, borrowing costs decrease, encouraging investment in new projects, machinery, or technology. Higher rates discourage borrowing and can slow corporate growth.
3. Inflation Control
Central banks use interest rates to manage inflation. Raising rates helps reduce money circulation, cooling demand and lowering inflationary pressure. Lowering rates increases liquidity, stimulating spending when inflation is low.
4. Employment and Growth
When interest rates are low, investment rises, production expands, and employment increases. Conversely, high interest rates can slow down business activities, leading to reduced hiring and slower economic growth.
5. Exchange Rates and Foreign Investment
Higher interest rates attract foreign capital as investors seek better returns, strengthening the domestic currency. Lower rates can lead to currency depreciation but may boost exports by making goods cheaper abroad.
Interest Rates and Financial Markets
Interest rates have a profound impact on stock, bond, and real estate markets.
1. Bond Market
Bond prices and interest rates move inversely. When interest rates rise, existing bonds with lower yields become less attractive, causing their prices to fall. Conversely, when rates fall, bond prices rise.
2. Stock Market
Low interest rates usually lead to higher stock prices as companies benefit from cheaper financing and investors shift funds from low-yield savings to equities. High rates can depress stock prices due to higher borrowing costs and reduced profit margins.
3. Real Estate
Interest rates directly affect mortgage rates. Lower rates make housing loans cheaper, boosting demand for property. Rising rates, however, reduce affordability and slow down real estate growth.
Interest Rates and Personal Finance
For individuals, interest rates influence nearly every financial decision:
Loans and EMIs: Higher rates mean larger monthly payments for home, car, or education loans.
Savings and Investments: When rates are high, fixed deposits and bonds become more rewarding.
Credit Cards: Variable interest rates on credit cards can increase financial burden when rates rise.
Understanding interest rates helps individuals plan better, manage debt effectively, and optimize investment returns.
Recent Trends in Interest Rates
In recent years, global interest rates have fluctuated sharply due to economic disruptions like the COVID-19 pandemic, inflationary pressures, and central bank interventions. Many central banks, including the U.S. Federal Reserve and the RBI, initially cut rates to stimulate growth but later increased them to control rising inflation. The balancing act between growth and price stability continues to define interest rate trends worldwide.
Conclusion
Interest rates are much more than a number quoted by banks — they are a critical economic signal that affects every aspect of financial life. They determine the cost of credit, influence investment behavior, and serve as a tool for managing inflation and growth. Understanding how interest rates work enables individuals, businesses, and policymakers to make informed financial and economic decisions. In essence, interest rates reflect the heartbeat of an economy — when they change, the entire economic system responds.
Knowledge of Candle Pattern What a candlestick shows (quick)
Body = open → close (filled/green = close>open bullish, filled/red = close

Part 11 Trading Masster ClassRole of Implied Volatility (IV) and Open Interest (OI)
Implied Volatility (IV): Indicates expected market volatility. Rising IV increases option premiums. Traders buy options during low IV and sell during high IV.
Open Interest (OI): Reflects the number of outstanding option contracts. Rising OI with price indicates strong trend confirmation, while divergence signals reversals.
These metrics help traders assess market sentiment and build informed positions.

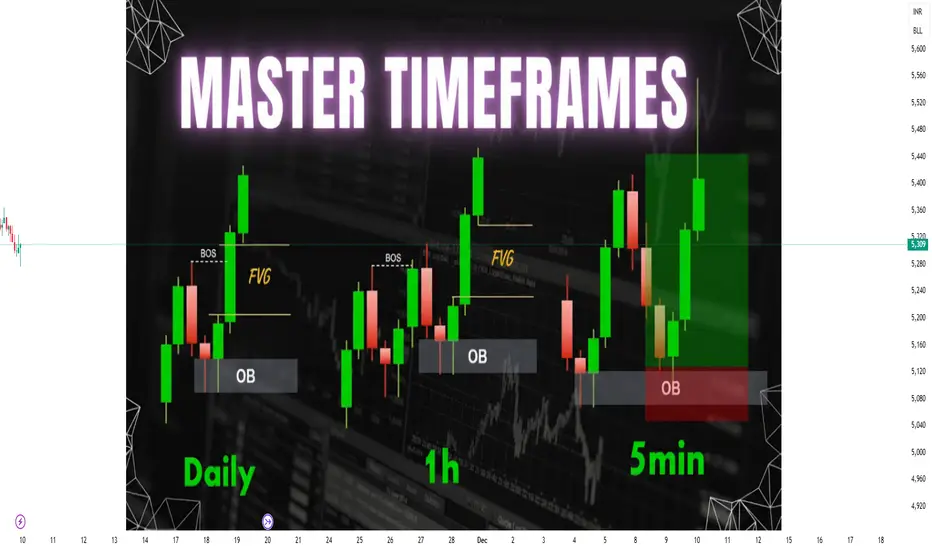
Multi-Timeframe Analysis (Intraday, Swing, Positional)1. Understanding Multi-Timeframe Analysis
Multi-Timeframe Analysis refers to the process of observing the same security across different timeframes to identify trend alignment, potential reversal zones, and optimal trading opportunities. Every timeframe provides unique insights:
Higher Timeframe: Defines the major trend and key support/resistance zones.
Intermediate Timeframe: Helps identify swing trends within the larger move.
Lower Timeframe: Provides precise entry and exit signals.
For example, a trader analyzing Nifty 50 might observe:
Daily Chart (Positional) for the overall trend direction.
Hourly Chart (Swing) for intermediate momentum.
15-Minute Chart (Intraday) for entry confirmation.
This top-down approach ensures that trades are placed in harmony with the broader market movement rather than against it.
2. The Logic Behind Multi-Timeframe Analysis
Financial markets are fractal in nature, meaning patterns repeat on various time scales. A breakout on a 5-minute chart might just be a retracement on a 1-hour chart, while a downtrend on a daily chart could appear as a bullish trend on a 15-minute chart.
MTA helps traders:
Identify dominant trends (macro view).
Spot short-term countertrends (micro adjustments).
Time entries with high probability setups.
Essentially, it synchronizes multiple layers of information to produce well-informed trading decisions.
3. Types of Traders and Timeframes
Each trader category operates within different time horizons:
A. Intraday Traders
Objective: Capture small price moves within a single trading day.
Timeframes Used: 1-minute, 5-minute, 15-minute, and 1-hour charts.
Holding Period: A few minutes to several hours.
Example: A trader identifies a bullish breakout on the 15-minute chart, confirms strength on the 5-minute chart, and exits before the market close.
B. Swing Traders
Objective: Ride short to medium-term trends lasting several days or weeks.
Timeframes Used: 1-hour, 4-hour, and daily charts.
Holding Period: 2 to 15 days typically.
Example: A bullish pattern on the daily chart confirmed by a 4-hour breakout helps the trader capture a multi-day price rally.
C. Positional Traders
Objective: Trade major trends that can last from weeks to months.
Timeframes Used: Daily, weekly, and monthly charts.
Holding Period: Several weeks to many months.
Example: A trader identifies a long-term uptrend on the weekly chart and holds positions through short-term fluctuations.
Each trader uses MTA to align smaller trends within the context of larger ones.
4. The Top-Down Approach
The Top-Down Approach is a systematic method of conducting multi-timeframe analysis. It involves starting with the highest relevant timeframe and drilling down to lower timeframes for precision.
Step 1: Identify the Major Trend (Higher Timeframe)
Use weekly or daily charts to determine the broader market direction.
Apply moving averages, trendlines, or price structure (higher highs and higher lows).
Example: On the weekly chart, Nifty 50 is in an uptrend.
Step 2: Confirm Momentum (Intermediate Timeframe)
Switch to a 4-hour or 1-hour chart to check if the momentum supports the higher timeframe trend.
Look for consolidation, breakouts, or pullbacks.
Step 3: Refine Entry and Exit (Lower Timeframe)
Use 15-minute or 5-minute charts to time entries and exits.
Identify short-term support, resistance, and candlestick patterns for precision.
This method ensures alignment between long-term direction and short-term trade execution, minimizing false signals and improving accuracy.
5. Example of Multi-Timeframe Analysis in Action
Let’s illustrate with an example:
Weekly Chart (Positional View): Shows a strong uptrend with price above 50-day moving average.
Daily Chart (Swing View): Reveals a bullish flag pattern forming after a rally.
Hourly Chart (Intraday View): Displays a breakout above the flag resistance with volume confirmation.
A positional trader may initiate a long position based on weekly strength, while a swing trader enters after the daily flag breakout. An intraday trader could use the hourly chart to time the exact breakout candle entry.
All three traders align their strategies to the same trend but operate on different time horizons.
6. Tools and Indicators Used in Multi-Timeframe Analysis
Several tools enhance the effectiveness of MTA:
Moving Averages (MA): Identify trend direction and alignment across timeframes (e.g., 20 EMA, 50 SMA).
Relative Strength Index (RSI): Helps confirm momentum consistency.
MACD: Detects shifts in momentum and crossovers aligning with major trends.
Support and Resistance Levels: Define crucial zones visible across charts.
Trendlines and Channels: Show structure of price swings.
Candlestick Patterns: Confirm entry signals on smaller timeframes.
Combining these tools across multiple frames builds confluence—an essential component of successful trading.
7. Advantages of Multi-Timeframe Analysis
Trend Confirmation:
Confirms whether short-term movements align with the long-term trend, improving accuracy.
Reduced False Signals:
Helps filter noise from smaller charts that may mislead traders.
Enhanced Entry Timing:
Allows traders to enter trades at precise moments when all timeframes agree.
Better Risk Management:
By aligning with larger trends, traders can define stop-loss and target levels more logically.
Adaptability Across Strategies:
Suitable for scalping, swing trading, or long-term investing.
8. Challenges in Multi-Timeframe Analysis
While MTA is powerful, it also presents certain difficulties:
Information Overload: Analyzing multiple charts can cause confusion or analysis paralysis.
Conflicting Signals: Short-term and long-term charts may show opposite trends, requiring trader judgment.
Execution Complexity: Managing entries and exits across multiple timeframes demands discipline and experience.
Emotional Bias: Traders may get biased by one timeframe and ignore contradictory evidence.
Therefore, consistency in analysis and clear trading rules are vital to prevent confusion.
9. Tips for Effective Multi-Timeframe Trading
Always start with higher timeframes before moving down.
Use a ratio of 1:4 or 1:6 between timeframes (e.g., daily → 4-hour → 1-hour).
Focus on key support/resistance levels visible across multiple frames.
Avoid overcomplicating; two or three timeframes are usually enough.
Maintain a trading journal to note observations from each timeframe.
Use alerts or automated tools to monitor price behavior when multiple charts are involved.
10. Conclusion
Multi-Timeframe Analysis is not just a technique but a strategic framework that enhances decision-making across trading styles—whether intraday, swing, or positional. By combining insights from different timeframes, traders gain a holistic view of the market, identify high-probability setups, and reduce the risk of false entries.
For intraday traders, MTA refines timing; for swing traders, it offers trend confirmation; and for positional traders, it ensures long-term alignment. When executed with discipline, proper analysis, and risk control, Multi-Timeframe Analysis becomes one of the most reliable methods to trade profitably in volatile markets like India’s NSE and BSE.
Real Knowledge of MarketCore Foundational Knowledge
Derivatives Basics: Options are derivative contracts, meaning their value is derived from an underlying asset (stocks, indices, commodities, etc.).
Key Terminology: A trader must be fluent in terms like call options (right to buy), put options (right to sell), strike price, premium, expiration date, intrinsic value, and time value.
Rights vs. Obligations: Understanding that option buyers have the right, but not the obligation, to exercise, while option sellers (writers) have the obligation if exercised, is fundamental to risk assessment.
Leverage: Options offer significant leverage, meaning a small amount of capital can control a large position in the underlying asset, which amplifies both potential profits and losses.

Part 2 Master Candle Stick Pattern Option Trading Styles
There are two primary styles of options:
American Options: Can be exercised at any time before the expiration date.
(Common in U.S. markets)
European Options: Can only be exercised on the expiration date.
(Common in index options and global markets)

Part 1 Master Candle Stick Pattern How Options Work
Each option represents a contract between a buyer and a seller. The buyer pays a premium to the seller (also called the writer) in exchange for certain rights:
The call option buyer has the right to buy the asset at the strike price.
The put option buyer has the right to sell the asset at the strike price.
If the market moves in favor of the buyer, they can exercise the option to make a profit. If the market moves against them, they can simply let the option expire, losing only the premium paid.

Part 2 Intraday Master ClassKey Concepts and Terminology
Before understanding how option trading works, it’s important to grasp some basic terms:
Call Option: Gives the holder the right to buy an asset at a specific price (called the strike price) before a set date.
Put Option: Gives the holder the right to sell an asset at a specific strike price before a set date.
Strike Price: The predetermined price at which the underlying asset can be bought or sold.
Premium: The price paid to purchase an option contract. It represents the cost of owning the right to buy or sell.
Expiration Date: The date on which the option contract expires. After this date, the option becomes void.
In-the-Money (ITM): When exercising the option would result in a profit.
Out-of-the-Money (OTM): When exercising the option would not be profitable.
At-the-Money (ATM): When the asset’s market price is equal (or nearly equal) to the strike price.
Underlying Asset: The financial instrument on which the option is based—commonly a stock, index, or commodity.

Volume Secrets in TradingThe Hidden Force Behind Price Movements
In the world of trading, price often grabs all the attention. Traders talk about chart patterns, moving averages, and candlestick formations — but behind every price move lies the true driving force: volume. Volume is the heartbeat of the market, showing how many participants are involved and how strong or weak a move really is. Understanding the secrets hidden in volume can dramatically improve your trading accuracy and timing.
1. What is Volume in Trading?
Volume represents the number of shares, contracts, or lots traded during a specific time period. For example, if 10 lakh shares of Reliance Industries are traded on a given day, its daily volume is 10 lakh.
In simple terms, volume tells you how active the market is. Higher volume means more participation, stronger conviction, and greater liquidity. Lower volume, on the other hand, indicates weaker interest and often signals indecision or the end of a move.
Volume can be applied to any market — equities, futures, forex, or cryptocurrencies — and remains one of the most reliable indicators of institutional activity.
2. The Relationship Between Price and Volume
The secret of volume lies in understanding how it interacts with price. Volume confirms price moves and gives hints about whether a trend is genuine or fake.
Here’s how different combinations reveal the market’s true intent:
Rising Price + Rising Volume → Bullish confirmation. This shows strong buying interest and supports a sustainable uptrend.
Rising Price + Falling Volume → Weak rally. The uptrend may lack conviction and could soon reverse.
Falling Price + Rising Volume → Bearish confirmation. Indicates strong selling pressure and continuation of a downtrend.
Falling Price + Falling Volume → Weak decline. The downtrend may be losing strength and nearing a reversal.
By observing these relationships, traders can filter out false breakouts and spot trend reversals early.
3. Volume as a Measure of Strength
Volume acts like a polygraph for price action — it tells you whether the price is lying. A breakout without volume is like a car without fuel — it won’t go far. When price moves on heavy volume, it shows genuine interest from big players.
For instance, suppose a stock breaks a long resistance level at ₹500. If the breakout happens with double or triple the average volume, it means large institutions are accumulating. But if it happens on thin volume, it’s often a trap to lure retail traders before reversing.
4. Volume Patterns that Reveal Market Intent
A. Volume Spikes (Climactic Volume)
A sudden and massive surge in volume often signals a turning point. This is called climactic volume. It occurs when a trend reaches an emotional extreme — everyone wants in or out.
At market tops, climactic volume shows buying exhaustion — smart money is selling while the crowd is buying.
At market bottoms, climactic volume signals selling exhaustion — smart money starts accumulating as others panic.
B. Volume Dry-Up (Low Volume Areas)
Periods of low or drying volume often precede big moves. When a market becomes quiet and volume contracts, it shows that volatility is compressing — energy is building for the next strong move.
C. Volume Divergence
When price continues to move in one direction but volume doesn’t confirm it, it’s a warning signal. For example, if price keeps rising but volume declines, it shows weakening demand — a potential reversal is near.
5. Using Volume with Technical Indicators
Volume can be combined with other indicators to strengthen your analysis.
A. On-Balance Volume (OBV)
OBV adds volume on up days and subtracts it on down days. It helps to identify whether money is flowing in or out of a stock. If OBV rises while price stays flat, it suggests accumulation before a potential breakout.
B. Volume Moving Average
This shows average traded volume over a period, such as 20 days. A sudden rise above the average volume indicates unusual activity — often a sign that smart money is taking positions.
C. Volume Profile
A more advanced tool, Volume Profile shows how much volume traded at different price levels (not over time). It reveals price zones of heavy activity, known as High Volume Nodes (HVN), where market participants agree on value, and Low Volume Nodes (LVN), where price tends to move quickly through.
6. Secrets of Institutional Volume
Big institutions like mutual funds and FIIs cannot buy or sell massive quantities at once — they leave footprints in volume. Smart traders watch these clues to trade alongside them.
Accumulation Phase: Price stays in a range, but volume slowly builds. Institutions are quietly buying without moving the price much.
Breakout Phase: Once accumulation is done, price breaks out sharply with a surge in volume.
Distribution Phase: After a rally, volume remains high but price stops rising. Institutions start selling gradually.
Recognizing these volume footprints helps traders spot where big money is flowing.
7. Volume in Intraday Trading
In day trading, volume gives instant clues about short-term momentum.
The first hour usually shows the highest volume — a reflection of overnight news and institutional action.
Sudden volume bursts during the day often precede strong intraday breakouts.
Traders use Volume-Weighted Average Price (VWAP) to gauge institutional participation. If price stays above VWAP with strong volume, buying pressure dominates.
8. Secrets of Volume Confirmation
The biggest mistake traders make is to ignore volume confirmation during entries. Before taking any trade:
Check if the move is supported by above-average volume.
Watch for volume spikes at support or resistance zones.
Look for divergence between price and volume to detect traps.
A trade backed by strong volume has a higher probability of success because it reflects real participation.
9. Practical Tips to Use Volume Effectively
Track Average Daily Volume: Avoid illiquid stocks where volume is too low — they can show false moves.
Compare Relative Volume: Look at current volume vs. the average to spot unusual activity.
Use Volume in Multiple Timeframes: Confirm whether daily volume supports weekly or monthly trends.
Watch Breakouts and Pullbacks: Real breakouts always occur on high volume; healthy pullbacks often show lower volume.
Combine with Price Action: Never analyze volume in isolation — always relate it to what price is doing.
10. Conclusion: The Hidden Language of the Market
Volume is not just a number on your chart — it is the language of the market’s heartbeat. It reveals the story behind every price movement — who is in control, where smart money is active, and when trends are about to reverse.
By learning to read volume, traders gain a major edge. Price tells you what is happening, but volume tells you why it’s happening and whether it will continue. Mastering this hidden dimension transforms trading from guesswork into intelligent market reading.
In short, price is the headline, but volume is the truth behind it.
Small-Cap Index Funds Volatility Explained1. Understanding Small-Cap Index Funds
Small-cap index funds track market indices composed of small-cap stocks—companies typically valued between ₹5,000 crore and ₹20,000 crore in India (or between $300 million and $2 billion globally). Examples include the Nifty Smallcap 100 in India or the Russell 2000 Index in the U.S.
Unlike actively managed funds, index funds do not attempt to pick specific stocks; they simply mirror the performance of a predefined index. This makes them cost-effective and diversified, offering investors exposure to a wide range of small companies in one investment vehicle.
While this diversification helps reduce the risk of individual company failure, it doesn’t eliminate market-level volatility, especially in the small-cap segment.
2. Why Small-Cap Stocks Are Volatile
The key reason behind small-cap fund volatility lies in the nature of the underlying small companies. They are in the growth or expansion phase of their business cycle, which makes their earnings, cash flows, and valuations less stable than those of large, established firms.
Let’s break down the main causes:
a) Limited Financial Resources
Small-cap companies often have restricted access to credit and lower cash reserves. During economic downturns or credit crises, they struggle more than large firms to raise funds or maintain operations, which can cause sharp price declines.
b) Low Liquidity
Shares of small-cap companies are traded less frequently. When investors rush to buy or sell, prices can swing widely because there are fewer buyers or sellers in the market. This low liquidity amplifies short-term price movements.
c) Higher Business Risk
Many small-cap firms operate in niche markets or rely on a limited set of products. This lack of diversification in business models means that any disruption—such as regulatory changes, technological shifts, or a key customer loss—can severely impact their earnings and, consequently, stock prices.
d) Sensitivity to Economic Cycles
Small caps are considered economic barometers. They perform strongly during expansions when demand and growth rise, but they can fall sharply during recessions or when interest rates rise. This cyclical nature adds to their volatility.
e) Market Sentiment
Investor perception plays a significant role in small-cap stock movements. In bullish phases, investors often become overly optimistic, driving prices to unsustainable levels. Conversely, during market corrections, fear can lead to steep declines. Hence, sentiment swings are more pronounced in small-cap segments.
3. Historical Perspective: Volatility Patterns
Looking at historical data, small-cap indices have shown higher annualized volatility compared to large-cap indices. For instance, over long periods, the Nifty Smallcap 100 has displayed greater short-term fluctuations compared to the Nifty 50, though it has also offered higher potential returns over a 10-year horizon.
Periods of extreme volatility often follow market corrections or macroeconomic uncertainty—like the 2008 global financial crisis or the 2020 pandemic. However, in recovery phases, small caps tend to rebound faster and outperform, as investors return to riskier growth opportunities.
4. Measuring Volatility in Small-Cap Funds
Volatility can be measured using several metrics:
a) Standard Deviation
It measures how much a fund’s returns deviate from its average over time. A higher standard deviation indicates greater volatility. Small-cap index funds typically have a higher standard deviation than mid- or large-cap funds.
b) Beta
Beta measures a fund’s sensitivity to the overall market. A beta greater than 1 indicates that the fund is more volatile than the market. Small-cap funds usually have betas ranging from 1.2 to 1.5, meaning they move more sharply in both directions compared to broader market indices.
c) Sharpe Ratio
This metric shows how much excess return a fund provides per unit of risk. Although small-cap funds may have high volatility, if they generate proportionately higher returns, they can still deliver a favorable Sharpe ratio.
5. Short-Term vs Long-Term Volatility
Volatility matters most in the short term. Over days, weeks, or months, small-cap index funds can experience large swings—sometimes 5–10% in a single session during turbulent times.
However, over long investment horizons (5–10 years), these fluctuations tend to average out. Historically, investors who remained invested through multiple market cycles often benefited from the compounding effect of growth in small companies that later became mid- or large-cap giants.
6. Benefits of Volatility: Hidden Opportunities
While volatility often sounds negative, it also presents opportunities for disciplined investors:
Higher Growth Potential: Small companies have more room to grow their earnings, and as their valuations expand, investors benefit from capital appreciation.
Mean Reversion: After sharp sell-offs, small-cap indices often recover quickly, offering attractive entry points.
Diversification Advantage: Adding a small-cap index fund to a portfolio primarily composed of large-cap stocks can improve overall portfolio returns and balance risk.
Thus, for long-term investors who can tolerate fluctuations, volatility can be a friend, not a foe.
7. Managing Volatility: Smart Investment Strategies
To navigate small-cap volatility effectively, investors can adopt several strategies:
a) Long-Term Approach
Holding investments for 7–10 years allows time for small-cap companies to grow and for short-term volatility to even out.
b) Systematic Investment Plan (SIP)
Investing through SIPs helps average out the cost of purchase across market cycles, reducing the impact of volatility.
c) Diversification
Balancing small-cap exposure with mid-cap and large-cap funds creates a more stable portfolio. This helps cushion against sudden declines in the small-cap space.
d) Regular Review
Monitoring fund performance relative to benchmarks ensures that the fund continues to align with your risk tolerance and financial goals.
e) Avoid Market Timing
Trying to predict highs and lows in volatile segments often backfires. Staying invested consistently usually yields better results than frequent trading.
8. Who Should Invest in Small-Cap Index Funds?
Small-cap index funds are not suitable for everyone. They best fit investors who:
Have a high risk tolerance
Seek long-term capital growth
Can withstand temporary market declines
Understand that volatility is part of the journey toward higher returns
For conservative investors or those nearing financial goals, it’s advisable to keep small-cap allocation limited (say 10–15% of the equity portfolio).
9. Real-World Example
Consider the Nifty Smallcap 100 Index. Between March 2020 and November 2021, it surged over 150%, reflecting a massive post-pandemic recovery. Yet, in 2022, the same index dropped around 25% due to global inflation concerns and rate hikes. This wide swing highlights the volatility inherent in small caps—but also their recovery power.
10. Conclusion
Volatility in small-cap index funds is not inherently bad—it’s a reflection of the growth potential and risk embedded in smaller businesses. These funds fluctuate more because they mirror the economic pulse of emerging companies—dynamic, ambitious, and vulnerable.
For patient, informed, and risk-tolerant investors, small-cap index funds can be powerful tools for long-term wealth creation. However, success requires discipline: understanding the market cycles, managing emotions during downturns, and staying invested long enough for volatility to transform into opportunity.
Part 12 Trading Master Class With Experts Risks in Option Trading
While options can enhance profits, they also carry risks:
Time Decay (Theta Risk) – Options lose value as they near expiration.
Volatility Risk – Sudden drops in volatility can erode option premiums.
Liquidity Risk – Illiquid options may have wide bid-ask spreads, leading to slippage.
Unlimited Loss Potential for Sellers – Writing naked options can result in huge losses.
Complexity – Understanding the interplay of Greeks and pricing models requires skill and experience.

Part 9 Trading Master Class With ExpertsTypes of Options
Options can be classified in different ways:
Based on Style:
European Options – can only be exercised on the expiry date.
American Options – can be exercised any time before expiry.
Based on Underlying Asset:
Stock Options – based on shares of companies.
Index Options – based on market indices like Nifty or Bank Nifty.
Commodity Options – based on commodities like gold or crude oil.
Currency Options – based on currency pairs like USD/INR.
