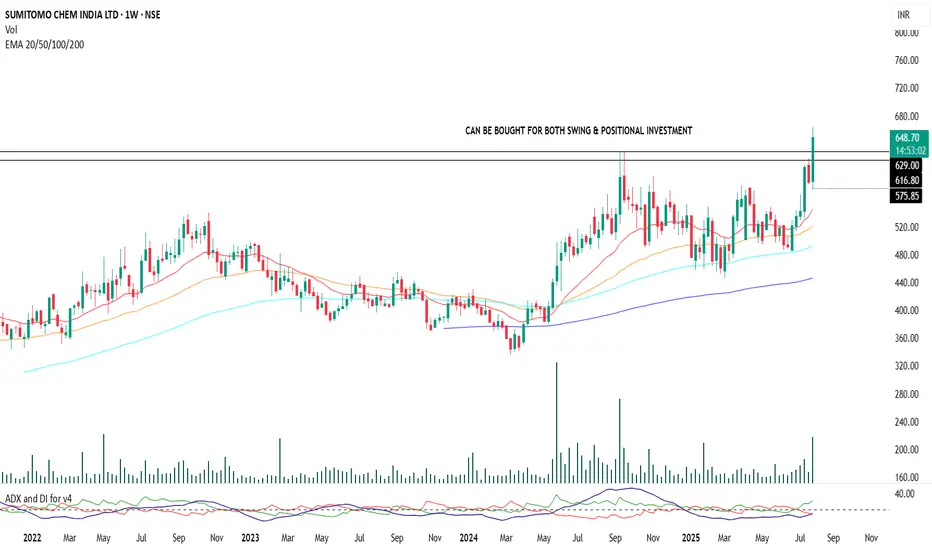
Sumitomo Chemical | Positional Swing Setup with Dynamic SLA strong setup is forming in Sumitomo Chemical with bullish c price action and trend indicators. Entry can be been initiated at current levels with small quantity with a stop-loss placed at ₹570 on a weekly closing basis.
No fixed targets. This is a trailing stop-loss-based position aimed at captur

The best trades require research, then commitment.
Get started for free$0 forever, no credit card needed

Scott "Kidd" PoteetThe unlikely astronaut

Where the world does markets
Join 100 million traders and investors taking the future into their own hands.
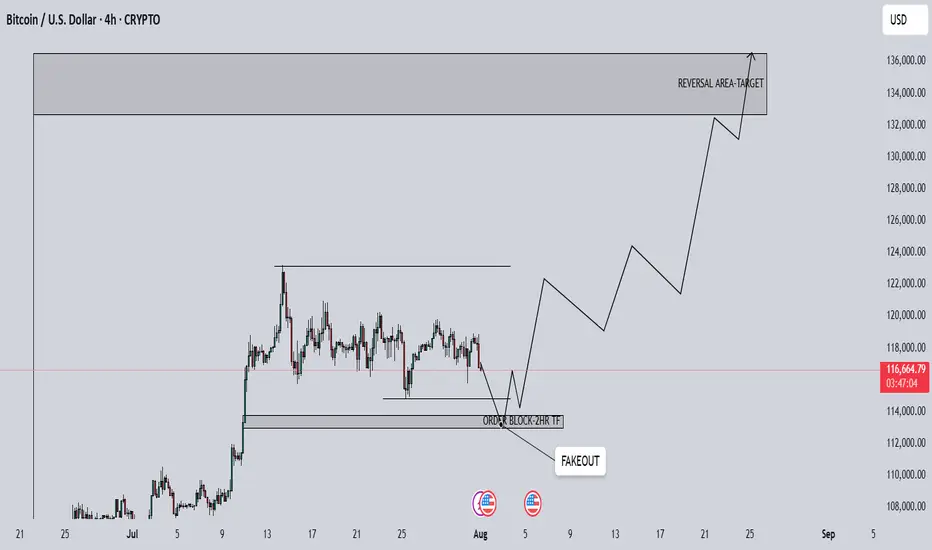
BTCUSD 4H Analysis1. Overall BTC is bullish but currently its at central area of
demand. so we can see a consolidation here.
2. There is a inducement/wicks at downside, so we can expect
a fake out at downside to fill the inducement and then market
can go to target area.
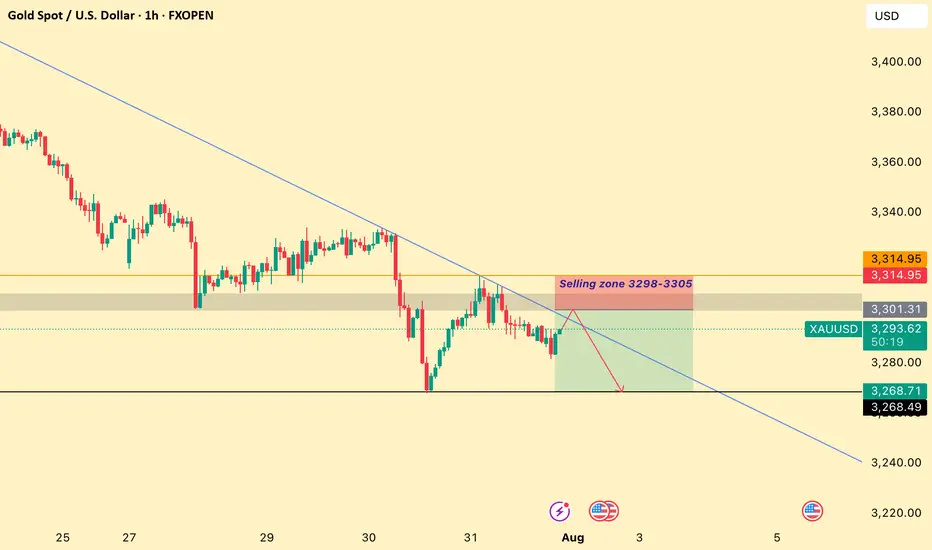
XAUUSD GOLD Analysis on (01/08/2025)#XAUUSD UPDATEDE
Sell Limited - (3298-3305)
If price stay below 3315, then next target 3282,3268 and above that 3335
Plan;If price break 3298-3305 area,and stay below 3295,we will place sell order in gold with target of 3282,3268 and 3250 & stop loss should be placed at 3315
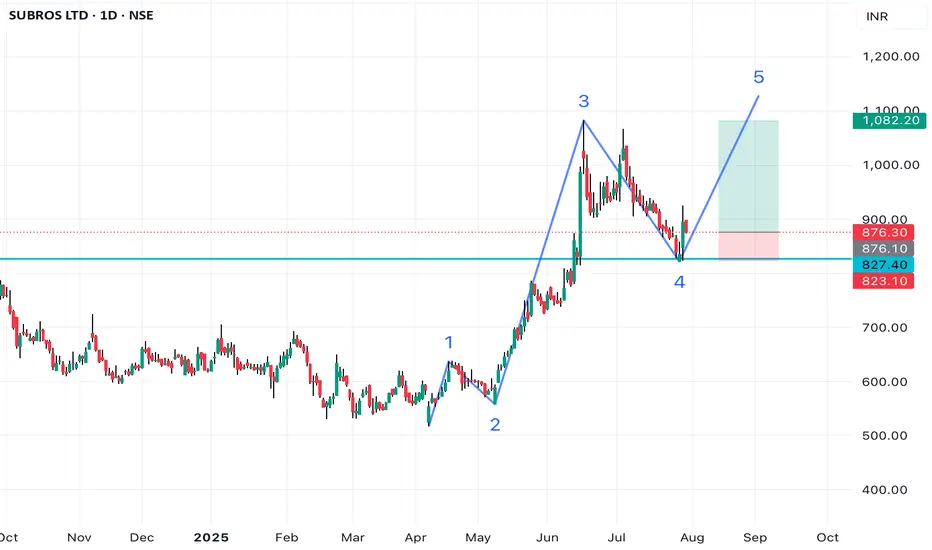
SUBROS may have started 5th waveThe stock is in clear uptrend on higher time frames (Weekly & Monthly).
It has given a break out on weekly time frame and now has come to retest the same level.
In daily TF we can see the bullish candle on support and a corrective wave (A-B-C).
It has also taken support on 50 EMA.
So the conflu
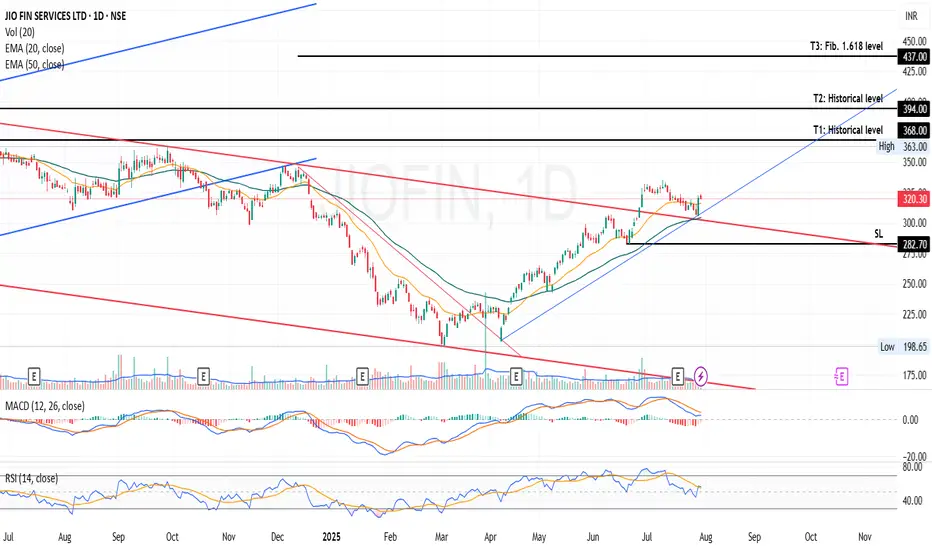
Jio Financial Services Ltd - Breakout OpportunityDate : 30-Jul-2025
LTP : Rs. 320.30
Targets: (T1) Rs. 368 --> (T2) Rs. 394 --> (T3) Rs. 437
SL : Rs. 282
Technical View:
• NSE:JIOFIN was going through primary downtrend since Apr 2024. From it's lifetime high of 394.70 in Apr 2024, it has retraced 50% to 198.65 in Mar 2025.
• From Apr 2025
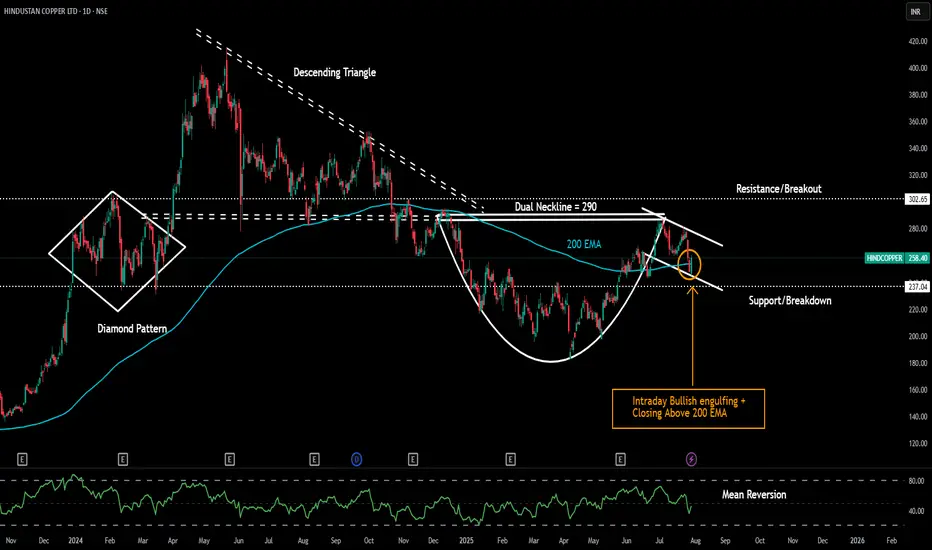
Hindustan Copper LtdDate 29.07.2025
Hindustan Copper Ltd
Timeframe : Day Chart
Technical Remarks :
1 Formed bullish engulfing on intraday closing basis
2 Closed above 200 exponential moving average
3 Took support from handle's bottom base
4 Dual neckline at 290 of descending triangle + cup & handle pattern
5
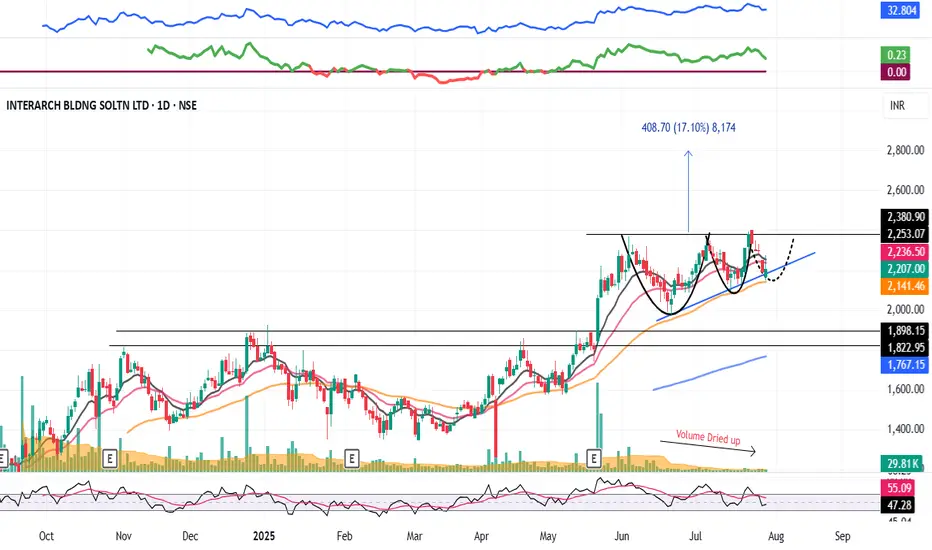
INTERARCH : Swing Pick (1-3 Months)#INTERARCH #vcppattern #chartpattern #ascendingtrianglepattern #breakoutstock #patterntrading #Swingtrading
INTERARCH : This will test Patience
>> VCP formation in process
>> Ascending Triangle forming
>> Breakout candidate
>> Good Strength & Volumes Dried up
>> Trending Stock in consolidation
Sw
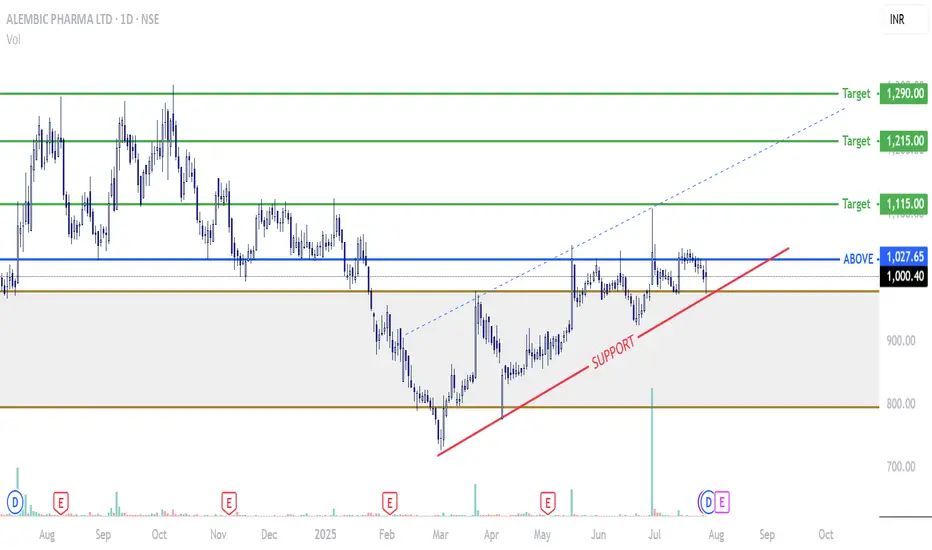
ALEMBIC PHARMAAlembic Pharma has been actively expanding its product portfolio and regulatory approvals, especially in the U.S. market and is well-positioned for multi-dimensional growth.
It operates a vertically integrated pharmaceutical business, allowing control over the entire value chain—from R&D to manufac
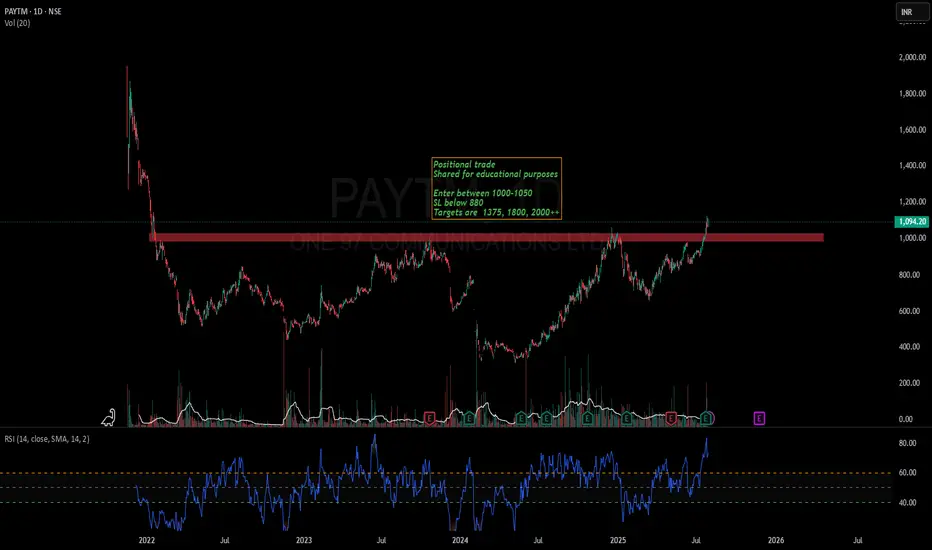
Paytm-A new ATH is coming soonPaytm has finally closed above its long term resistance of 1000.
Stock has potential to cross 2000 in near future
Keep stock in watchlist
Stock has also formed a kind of inverted head and shoulder pattern.
Not a recommendation. Watch and learn.
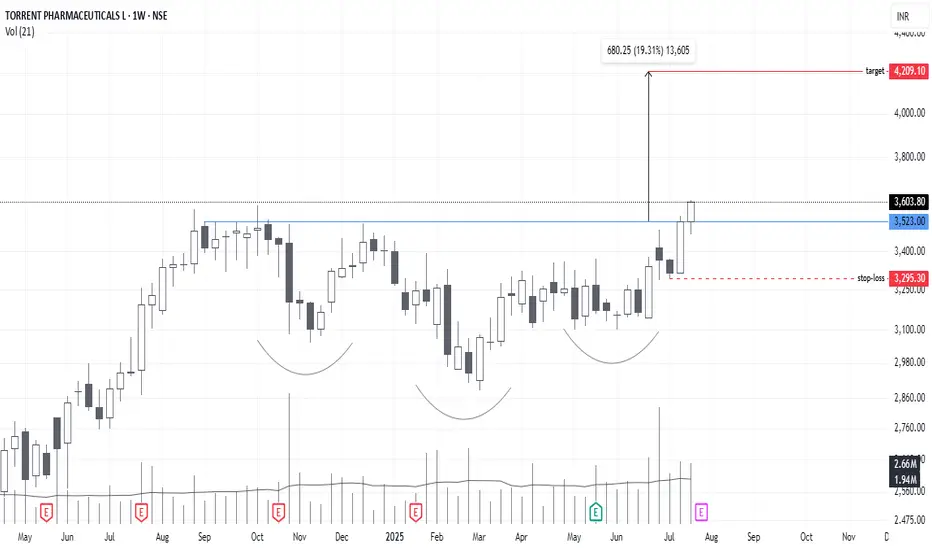
TORNTPHARM : Consolidation BreakoutStock is showing consolidation Breakout on ATH level, which is good for stock. Depends on its upcoming results the rally will be continue. Showing Head and Shoulder Breakout
All data is available in public domain..
CMP : 3600
TG : 4200
SL : 3290
Stock's selection based on 5 Point Analysis
See all editors' picks ideas
Trend Range Detector (Zeiierman)█ Overview
Trend Range Detector (Zeiierman) is a market structure tool that identifies and tracks periods of price compression by forming adaptive range boxes based on volatility and price movement. When prices remain stable within a defined band, the script dynamically draws a range box; when p

BE-Indicator Aggregator toolkit█ Overview:
BE-Indicator Aggregator toolkit is a toolkit which is built for those we rely on taking multi-confirmation from different indicators available with the traders. This Toolkit aid's traders in understanding their custom logic for their trade setups and provides the summarized results o

Synthetic VX3! & VX4! continuous /VX futuresTradingView is missing continuous 3rd and 4th month VIX (/VX) futures, so I decided to try to make a synthetic one that emulates what continuous maturity futures would look like. This is useful for backtesting/historical purposes as it enables traders to see how their further out VX contracts would'

Intrabar Efficiency Ratio█ OVERVIEW
This indicator displays a directional variant of Perry Kaufman's Efficiency Ratio, designed to gauge the "efficiency" of intrabar price movement by comparing the sum of movements of the lower timeframe bars composing a chart bar with the respective bar's movement on an average ba

Strategy█ OVERVIEW
This library is a Pine Script™ programmer’s tool containing a variety of strategy-related functions to assist in calculations like profit and loss, stop losses and limits. It also includes several useful functions one can use to convert between units in ticks, price, currency or a per

Signs of the Times [LucF]█ OVERVIEW
This oscillator calculates the directional strength of bars using a primitive weighing mechanism based on a small number of what I consider to be fundamental properties of a bar. It does not consider the amplitude of price movements, so can be used as a complement to momentum-based osc

Estimated Time At Price [Kioseff Trading]Hello!
This script uses the same formula as the recently released "Volume Delta" script to ascertain lower timeframe values.
Instead, this script looks to estimate the approximate time spent at price blocks; all time estimates are in minute.second format.
The image above shows functionality.

Volume Profile, Pivot Anchored by DGTVolume Profile (also known as Price by Volume ) is an charting study that displays trading activity over a specified time period at specific price levels. It is plotted as a horizontal histogram on the finacial isntrumnet's chart that highlights the trader's interest at specific price levels. Specif

Fair Value MSThis indicator introduces rigid rules to familiar concepts to better capture and visualize Market Structure and Areas of Support and Resistance in a way that is both rule-based and reactive to market movements.
Typical "Market Structure" or "Zig-Zag" methods determine swing points based on fixed t

TextLibrary "Text"
library to format text in different fonts or cases plus a sort function.
🔸 Credits and Usage
This library is inspired by the work of three authors (in chronological order of publication date):
Unicode font function - JD - Duyck
UnicodeReplacementFunction - wlhm

See all indicators and strategies
News didn't load
Looks like that didn't go very well. Let's try again.
Community trends
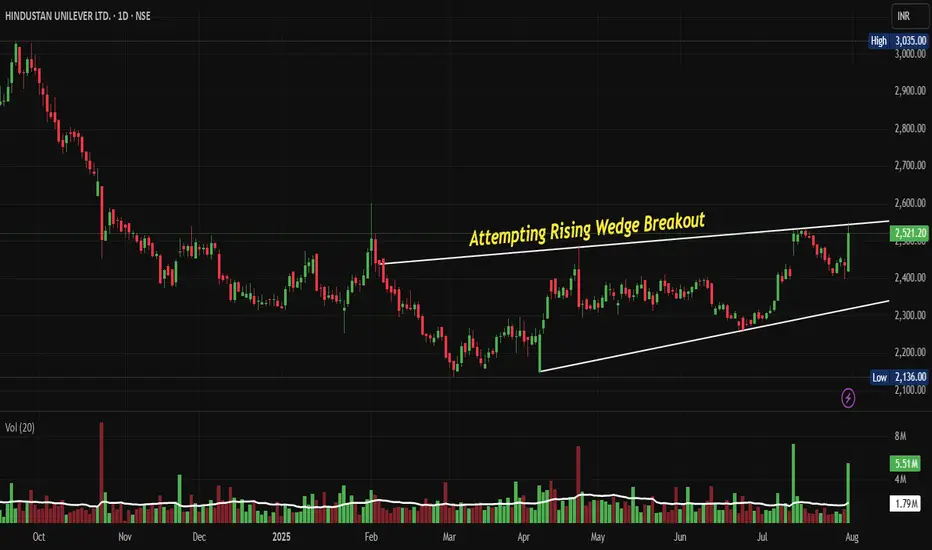
HINDUNILVR: Attempting Rising Wedge Breakout Post Q1 FY 26NSE:HINDUNILVR Attempting Rising Wedge Breakout: A Technical Revival Story Worth Watching Post Decent above Estimate Volume Growth and Q1 FY26 Results.
Price Action:
• Trading within a well-defined rising wedge pattern from February 2025 to July 2025
• The stock experienced a significant decli
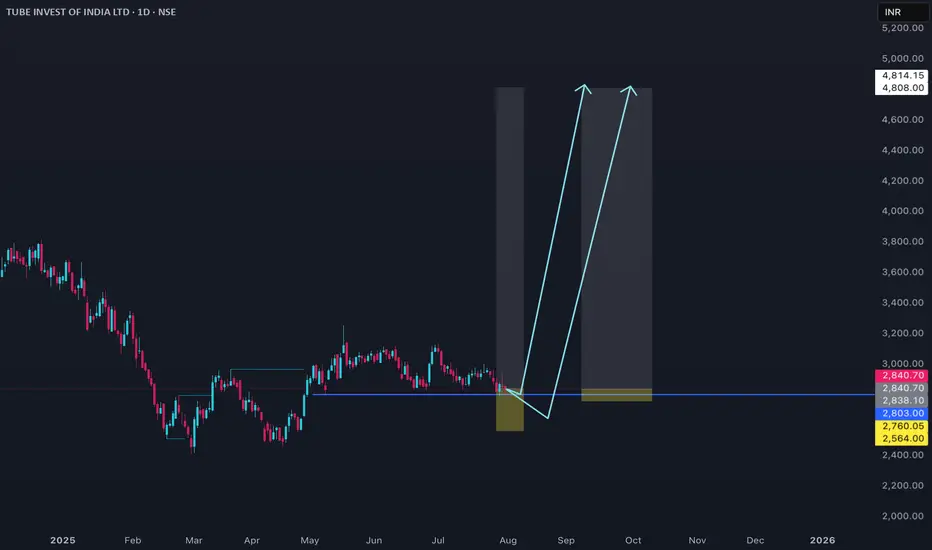
TIINDIA Price ActionTata Investment Corporation Ltd (TIINDIA) is mainly an investment holding company, and its share price reflects both its portfolio performance and market sentiment. At present, the company maintains a very strong financial position with almost no debt, providing security for shareholders. Its stock
BUY TODAY SELL TOMORROW for 5%DON’T HAVE TIME TO MANAGE YOUR TRADES?
- Take BTST trades at 3:25 pm every day
- Try to exit by taking 4-7% profit of each trade
- SL can also be maintained as closing below the low of the breakout candle
Now, why do I prefer BTST over swing trades? The primary reason is that I have observed that
Sumitomo Chemical | Positional Swing Setup with Dynamic SLA strong setup is forming in Sumitomo Chemical with bullish c price action and trend indicators. Entry can be been initiated at current levels with small quantity with a stop-loss placed at ₹570 on a weekly closing basis.
No fixed targets. This is a trailing stop-loss-based position aimed at captur
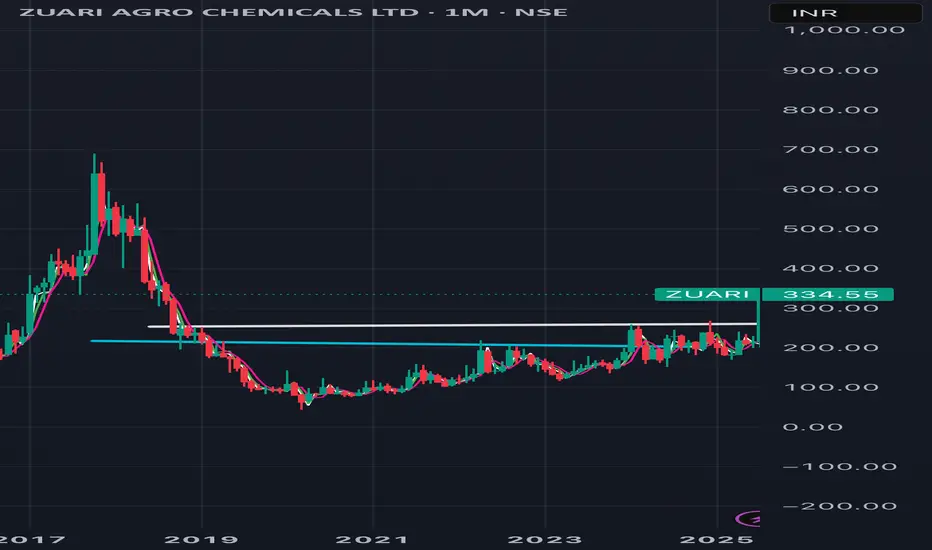
Zuari Agro chemicals Looks superb after breakout + Superb result
Only for Information and Educational purposes
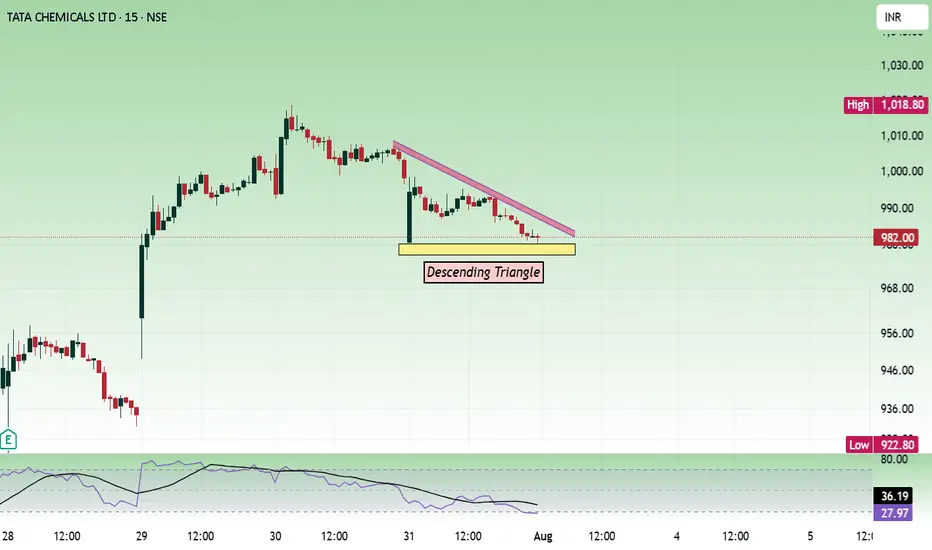
TatchemicalsPrice is consolidating in a narrow range and forming a triangle. 980 is a support zone and price can move up.
Buy above 980 with the stop loss of 972 for the targets 988, 996, 1004 and 1016.
Sell below 958 with the stop loss of 966 for the targets 950, 942, 936 and 928.
Always do your own analysis b
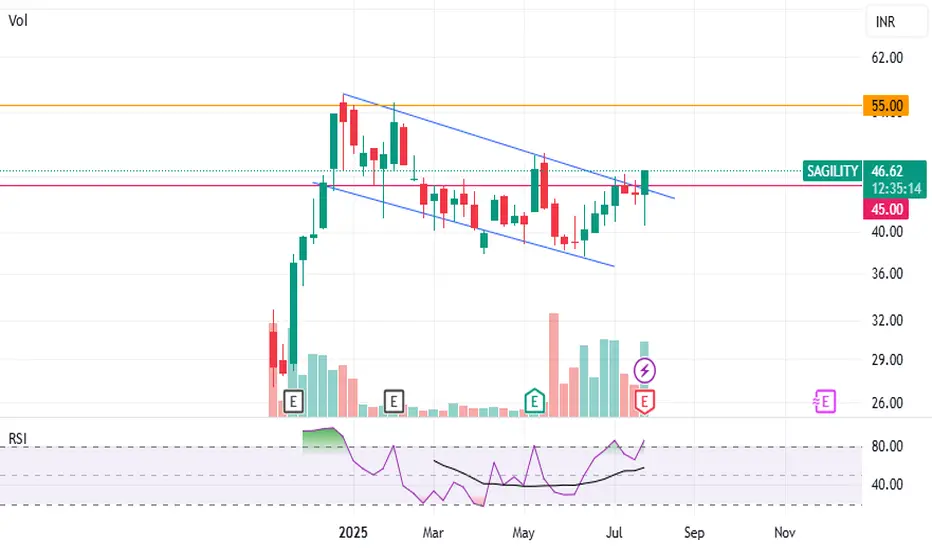
Sagility India LtdSAGILITY has been trading within a descending wedge pattern and has now broken above the upper trendline, confirming a bullish momentum. This breakout is further validated by rising volume, adding strength to the move.
Additionally, while the price was making lower lows, the RSI showed higher lows,
Transformers and Rectifiers India Ltd (TARIL)TARIL is a small-cap power equipment manufacturer specializing in transformers up to 400kV. It has a strong order book and benefits from government infrastructure and power sector capex. In FY24, revenue grew 25% YoY, with improving margins (8–9%) and profit turnaround. Debt levels have reduced, and

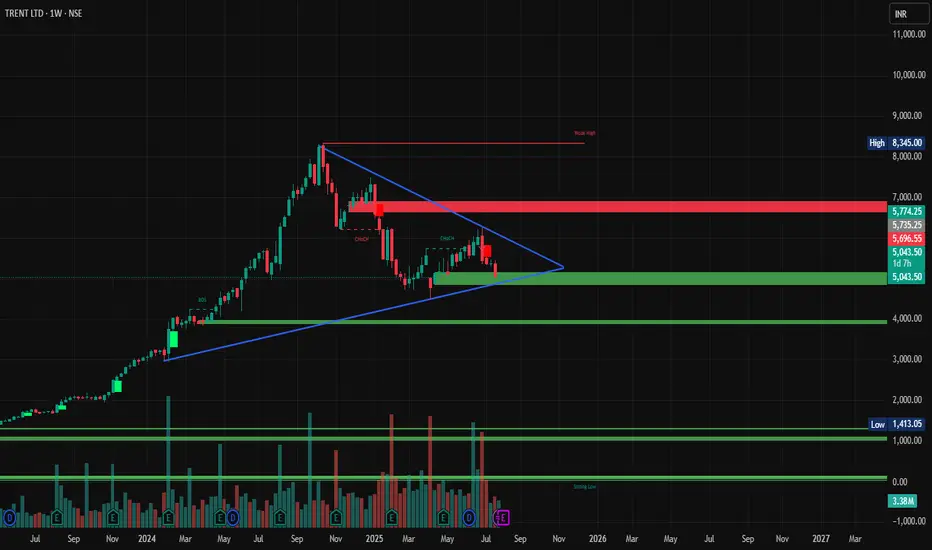
TRENT Bye trent at 5040 with sl 4810 in closing basis with target with 6000 target 1:5 RR
There are three confirmations
1) in weekly time fame comes in the buying zone
2) from every year in 10 or 9 years give 15% return from 1st aug to 25 aug
3) weekly time fame stock on support trend line
Best time
Jio Financial Services Ltd - Breakout OpportunityDate : 30-Jul-2025
LTP : Rs. 320.30
Targets: (T1) Rs. 368 --> (T2) Rs. 394 --> (T3) Rs. 437
SL : Rs. 282
Technical View:
• NSE:JIOFIN was going through primary downtrend since Apr 2024. From it's lifetime high of 394.70 in Apr 2024, it has retraced 50% to 198.65 in Mar 2025.
• From Apr 2025
See all stocks ideas
Today
NIVABUPANIVA BUPA HEALTH INS CO L
Actual
−0.38
INR
Estimate
−0.38
INR
Today
ICRAICRA LTD
Actual
—
Estimate
—
Today
RBARESTAURANT BRAND ASIA LTD
Actual
−0.20
INR
Estimate
−0.20
INR
Today
SKIPPERSKIPPER LTD
Actual
3.90
INR
Estimate
3.90
INR
Today
PREMEXPLNPREMIER EXPLOSIVES LTD
Actual
—
Estimate
—
Today
ALIVUSALIVUS LIFE SCIENCES LTD
Actual
—
Estimate
10.90
INR
Today
KIRLFERKIRLOSKAR FERROUS INDUSTRIES L
Actual
—
Estimate
—
Today
BHARATWIREBHARAT WIRE ROPES LTD.
Actual
—
Estimate
—
See more events
News didn't load
Looks like that didn't go very well. Let's try again.
Community trends
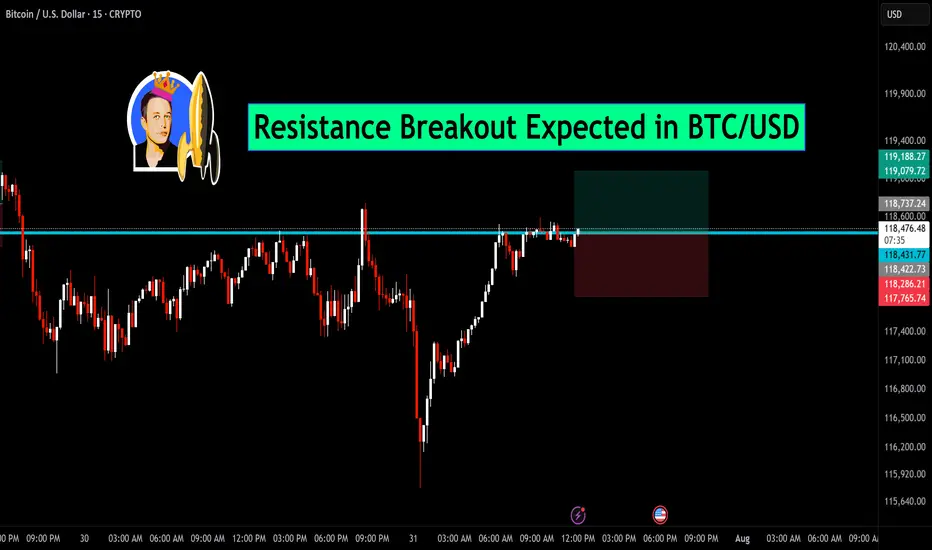
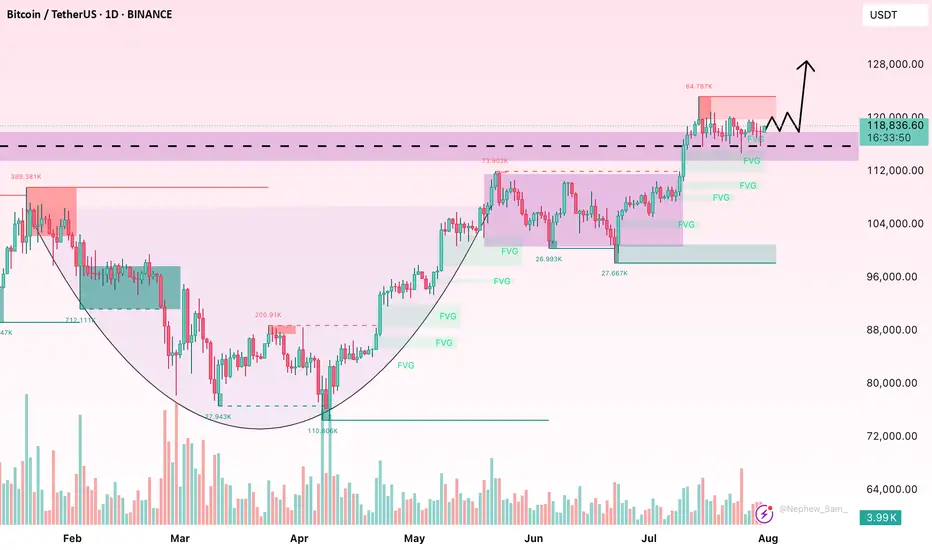
Resistance Breakout Expected in BTC/USDBitcoin is currently testing a key horizontal resistance near the $118,600 zone. After a sharp recovery from recent lows, the price is consolidating just below this level, indicating a potential breakout.
🔍 Chart Insights:
Price action forming higher lows, showing strength.
Breakout above the mar
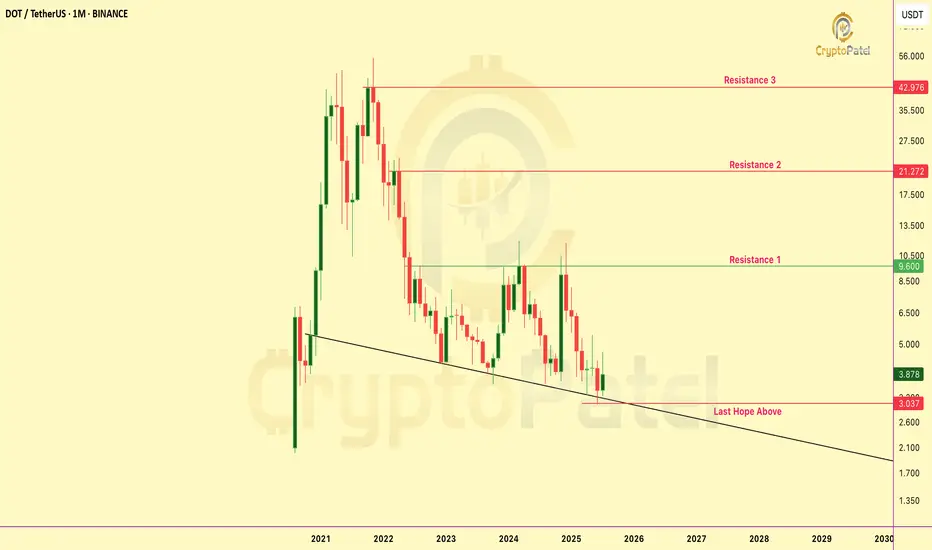
Is Polkadot (DOT) Dead or Ready for a Comeback? Full Update 2025Polkadot was one of the strongest performers of the last cycle. After launching near 2.70 dollars in August 2020, it rallied to an all-time high of $55 in November 2021. That marked a nearly 1,900% gain in just over a year.
However, fast forward to mid-2025, and CRYPTOCAP:DOT is now trading back

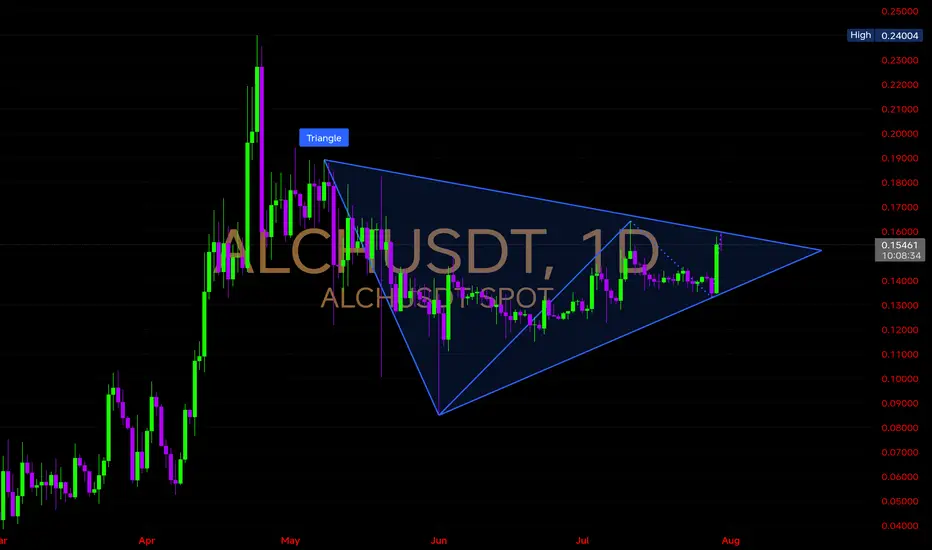
$ALCH – Triangle Breakout Watch!
BYBIT:ALCHUSDT
After weeks of tight consolidation, Price has finally broken out of the symmetrical triangle on the 1Day chart! 📈
This could be the ignition spark for a new bullish leg.
📊 Technical Overview:
🔹 Structure: Symmetrical Triangle
🔹 Breakout Zone: ~$0.154
🔹 Previous Resistance
Bitcoin Set to Surge? Price Signals Favor Buyers!On the daily (D1) chart, BTC is consolidating within a tight range between $118,000 and $119,800—appearing to “gather momentum” before deciding its next move. A closer inspection reveals encouraging signals for bullish traders:
First, the structure remains upward‑biased. Successive lows are higher,
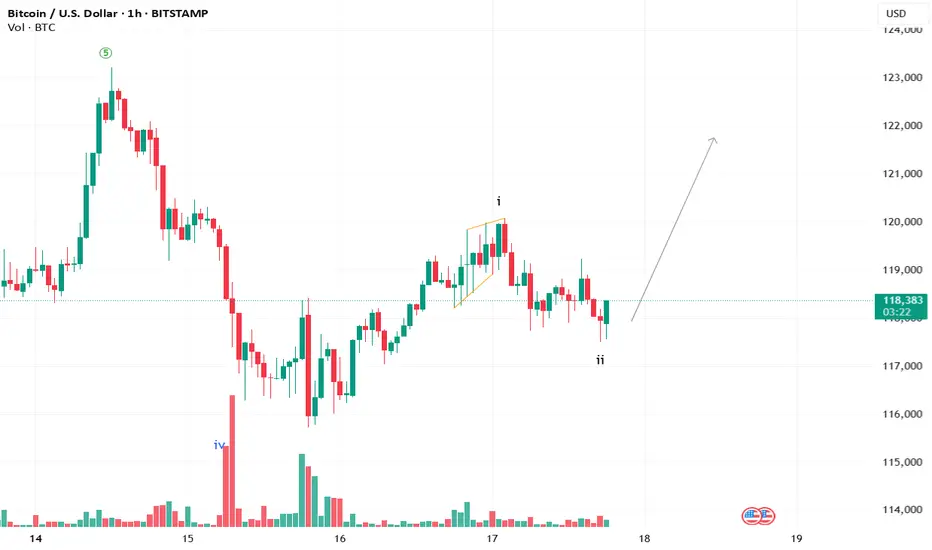
[SeoVereign] BITCOIN BULLISH Outlook – August 1, 2025We are the SeoVereign Trading Team.
With sharp insight and precise analysis, we regularly share trading ideas on Bitcoin and other major assets—always guided by structure, sentiment, and momentum.
🔔 Follow us to never miss a market update.
🚀 Boosts provide strong motivation and drive to the SeoVer

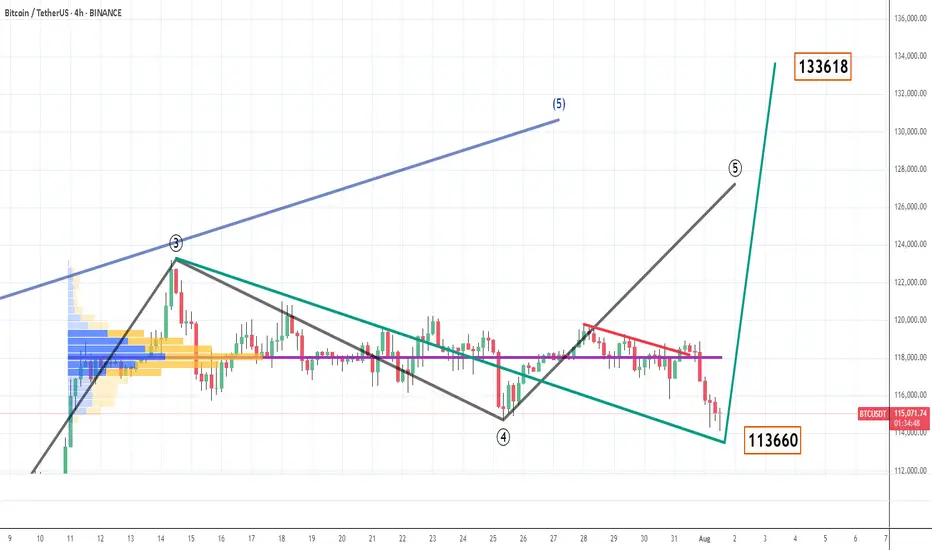
BTC - 1st Aug view - 4th wave revised and new TP - 133KBig players played a false move to shake weak hands when US data, trade deals, crypto policy etc etc favoring continuation of impulsive move. But its big players deliberate move to generate liquidations and get bigger qty of bitcoins.
Now
As per revised 4th wave shown in green line and black was ear
Bitcoin bottoming out starts !?!At 115,008, this is why I believe the process of bottoming out of #bitcoin has started.
It's the confluence of trendlines (blue) and 50 DEMA (pink) at the 113,000-114,000 area. Any volatile spike down to the 109,000 level is a good area to accumulate, if it may happen.
Any weekly close below 109

See all crypto ideas
News didn't load
Looks like that didn't go very well. Let's try again.
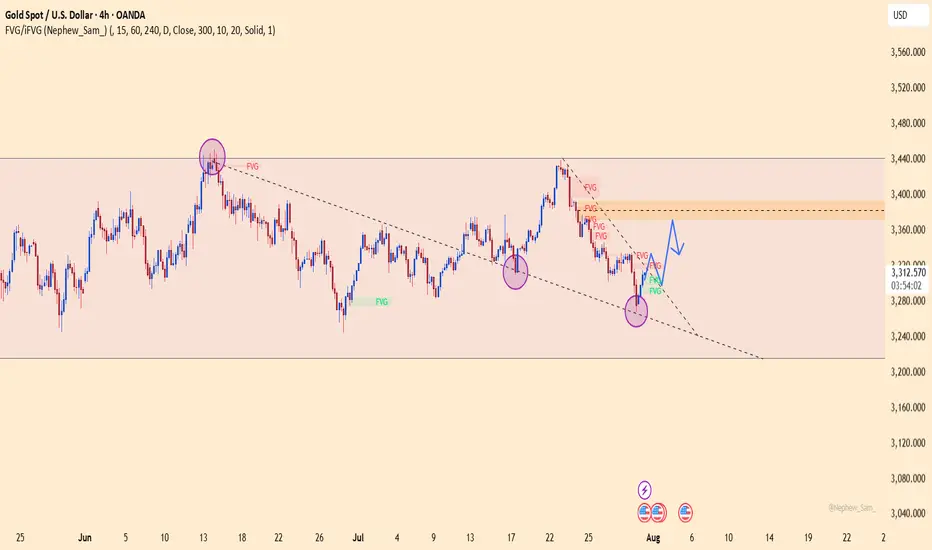
XAUUSD GOLD Analysis on (01/08/2025)#XAUUSD UPDATEDE
Sell Limited - (3298-3305)
If price stay below 3315, then next target 3282,3268 and above that 3335
Plan;If price break 3298-3305 area,and stay below 3295,we will place sell order in gold with target of 3282,3268 and 3250 & stop loss should be placed at 3315
XAUUSD – Gold may plunge if key support failsHello traders! Gold continues to move within a clear descending channel and is currently retesting the previous support zone around 3,295.600. The RSI remains weak, and the EMA 34 stays below the EMA 89, confirming that the bearish trend is still dominant.
On the news front, U.S. labor costs have e
Fed’s “Soft Punch” – Gold Breaks Down, Dollar SurgesHey everyone, have you been watching XAU/USD lately? Gold is flashing some interesting signals right now.
The metal faced another heavy sell-off after the Fed hinted it’s “not ready” to cut rates in September, combined with a string of stronger-than-expected U.S. data. The result? The dollar soared
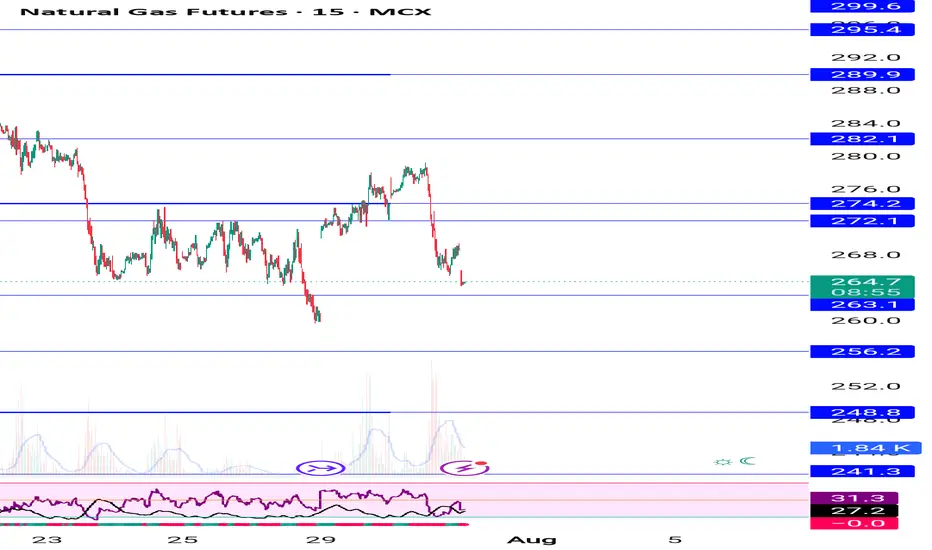
Natural gas 262-256 support area start buying again, positional Natural gas 262-256 strong support area again buy on dip upside target big , safe traders can sell puts at current price
Both side levels given on chart
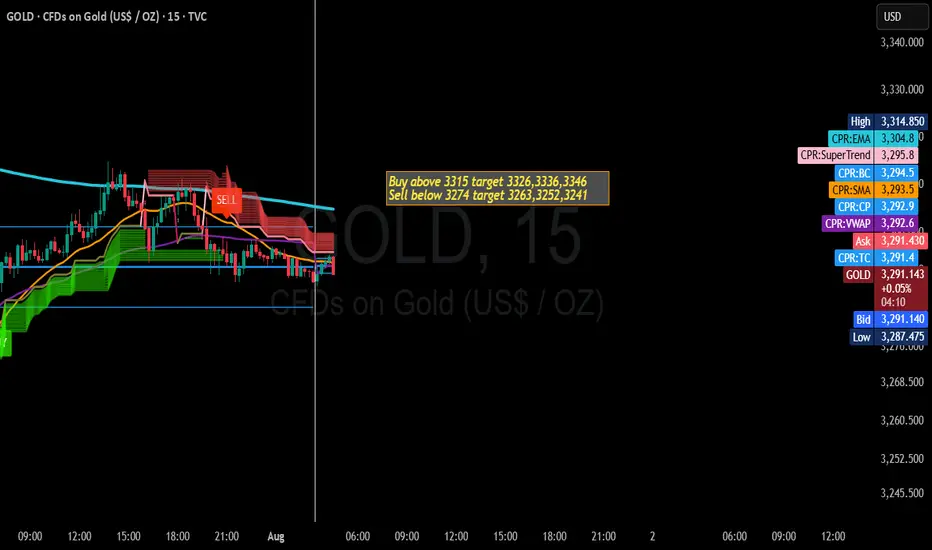
Gold Trading Strategy for 01st Aug 2025📊 Gold Trading Plan
💰 Trading Instrument: Gold ($XAU/USD)
⏰ Timeframe: 1-Hour (H1)
🟢 Buy Setup (Long Trade)
✅ Entry: Buy above the high of a 1-hour candle that closes above $3,315
🎯 Targets:
$3,326 🥇
$3,336 🥈
$3,346 🏆
💡 Example:
If a 1-hour candle closes at $3,316, you can place a buy order above
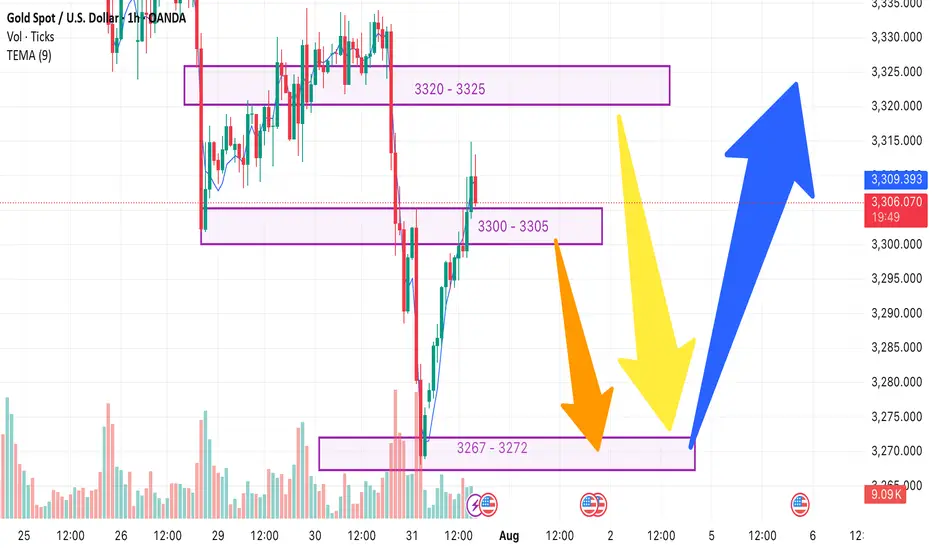
Gold Trading Strategy XAUUSD July 31, 2025Yesterday's trading session, after breaking the rising price channel in the 3318 - 3320 area, the gold price fell sharply to the 3269 area.
Basic news: US Treasury yields fell and the weak US labor market report could boost investor demand. Data released by the US Department of Labor on Tuesday sho
Today's Gold Price: (3280-3290) Be Cautious About Bottom-fishing
Today's Gold Price: (3280-3290) Be Cautious About Bottom-fishing
Today's gold price volatility was another lethargic day.
It oscillated back and forth between 3300 and 3330.
Like a loom, it was a lethargic experience.
In fact:
This market trend is typical of gold's volatility.
It suggests that si

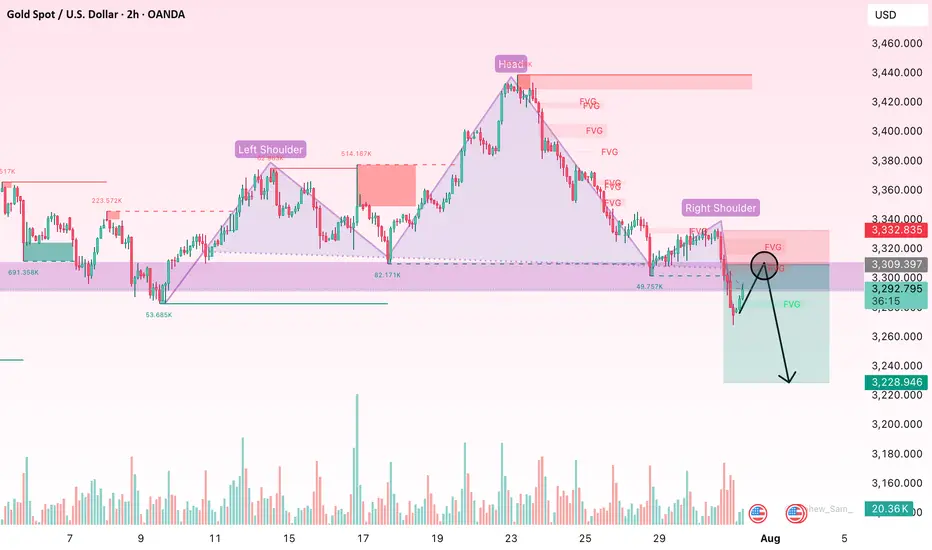
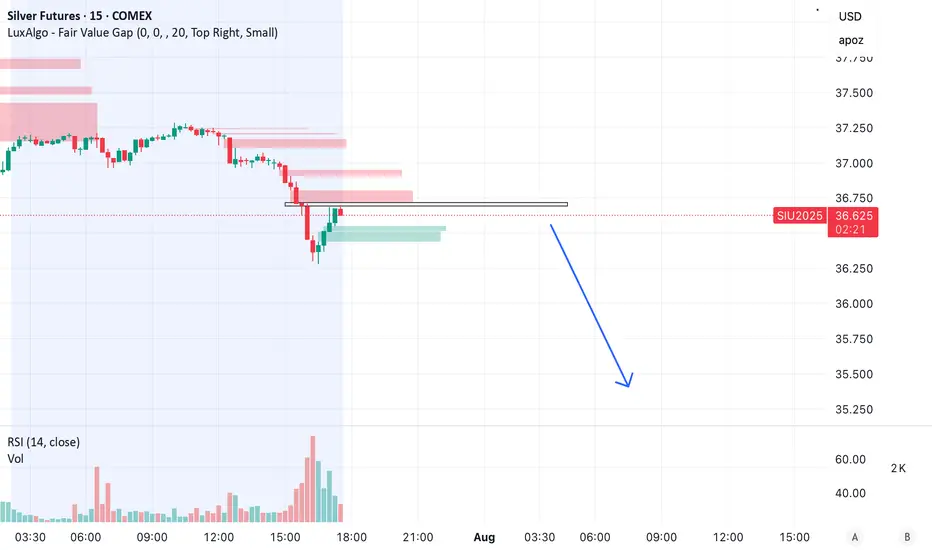
Silver’s Dead Cat Bounce Looks Tired
⸻
Technical Analysis
1. Price rejection at supply zone
• Price has tested a previous area of heavy selling and failed to break above it.
• This is a textbook lower high after a sharp down-move, indicating potential continuation of the downtrend.
2. Fair Value Gap (FVG) resistance
• Shows a vi
XAUUSD Outlook – Bearish Continuation Still in PlayGold continues to trade under pressure, with recent price action confirming that the bears remain in control. The failure to sustain momentum above the 3,352 resistance zone, coupled with the strong rally in the U.S. dollar, has tilted short-term sentiment to the downside.
From a macro standpoint,

Gold weakens further – is 3250 next?Hello traders, take a look at the chart — what do you see?
Here’s my perspective:
Recently, gold has shown signs of weakness as the U.S. dollar strengthens amid expectations that the Fed will delay interest rate cuts. In response to this, gold continues to trend lower and is currently hovering arou

See all futures ideas
News didn't load
Looks like that didn't go very well. Let's try again.
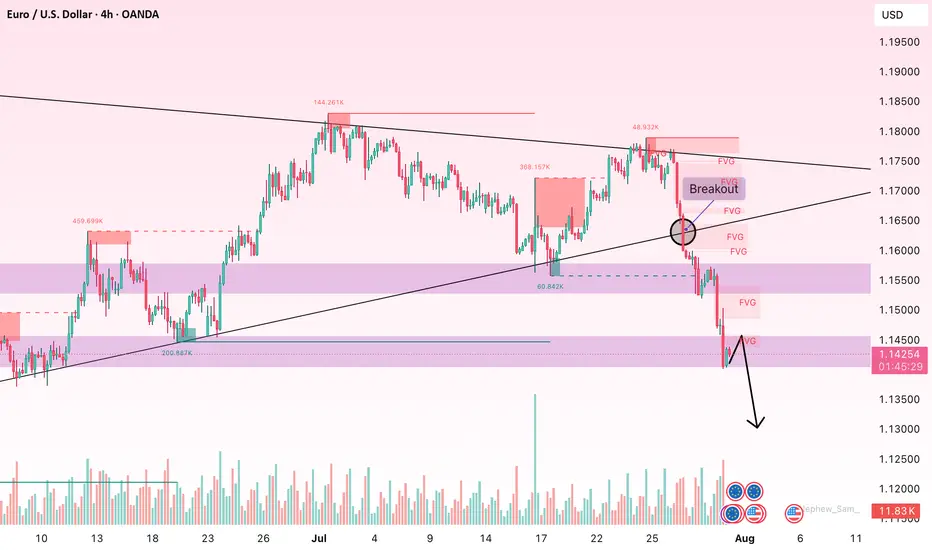
Downtrend Persists – Beware the Fake PullbackOn the 4H chart, EUR/USD remains under heavy selling pressure, with a clear downward trend and multiple Fair Value Gaps (FVGs) appearing as price slides from 1.1800 to the 1.1430 zone. The consistent formation of upper FVGs highlights an ongoing supply-demand imbalance, with sellers clearly dominati
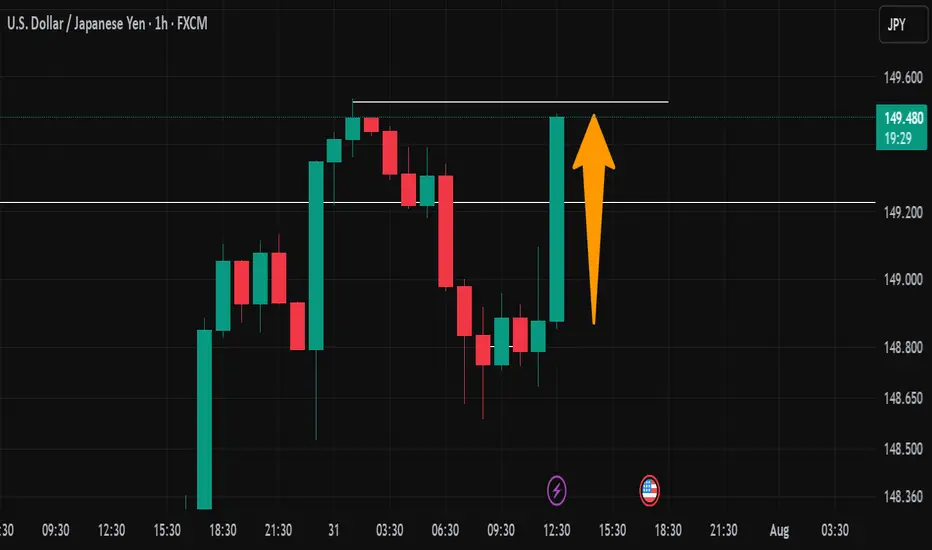
USD/JPY Gains With Strengthening Dollar – Bullish Bias IntactThe USD/JPY pair is gaining momentum as the U.S. Dollar strengthens across the board. Supported by rising U.S. yields and continued divergence in monetary policy between the Fed and BoJ, the pair remains firmly in a bullish structure.
Price is pushing toward key resistance levels, with potential up
EURUSD – Euro tumbles under strong dollar pressureAfter a brief uptick following the US–EU trade agreement, EUR/USD quickly sank under a wave of strong US economic data. While import tariffs on EU goods were reduced to 15%, the US dollar gained more as capital kept flowing into the US thanks to a Q2 GDP growth above 3%, steady PCE, and a strong ADP

GBPJPY POTENTIAL LONGLooking at GBPJPY ,CURRENTLY taking long positions on the retest of the recently created daily demand zone which also confluences with the retest of the recently created 4h and 1h demand zone .
EURUSD at risk of reversal: will sellers take control?Hello everyone! What are your thoughts on EURUSD?
Lately, the euro has been under pressure due to growing weakness in the Eurozone economy. The European Central Bank (ECB) has sent out more cautious signals in response to rising recession risks and cooling inflation. This increases the likelihood t

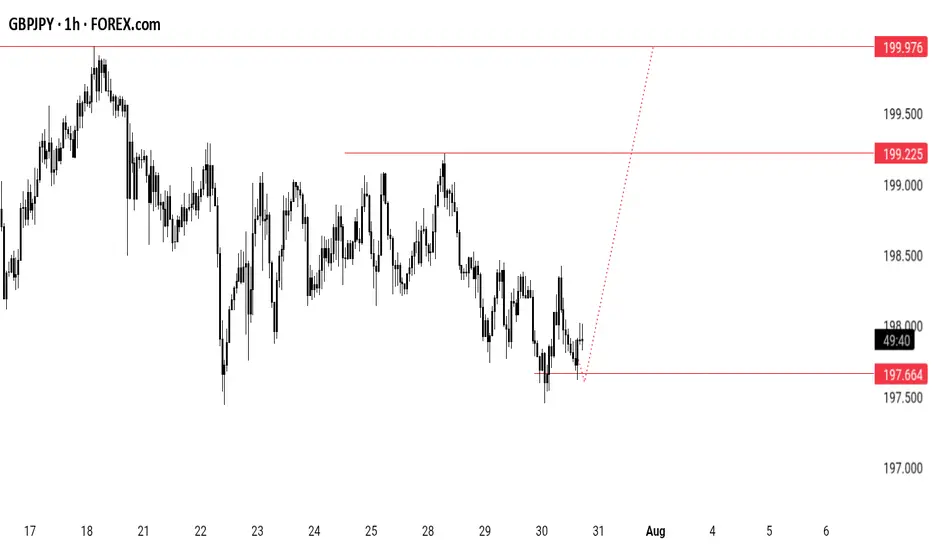
GBPJPYThe 4-hour structure on GBP/JPY has turned bullish following a strong upward move that flipped the previous structure after several days of consolidation and limited volatility.
Price has now entered a Demand zone and is likely to retrace toward the 197.500 level, which aligns with a key psychologi


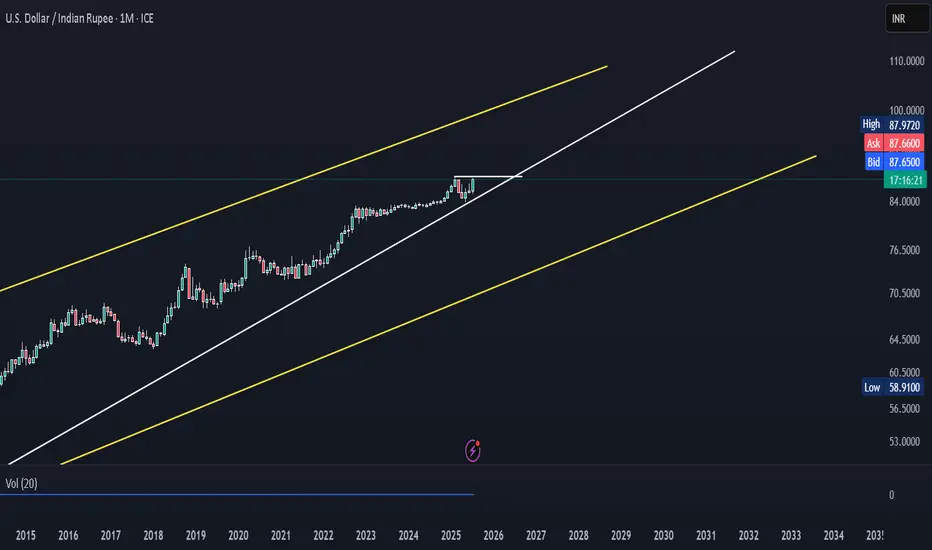
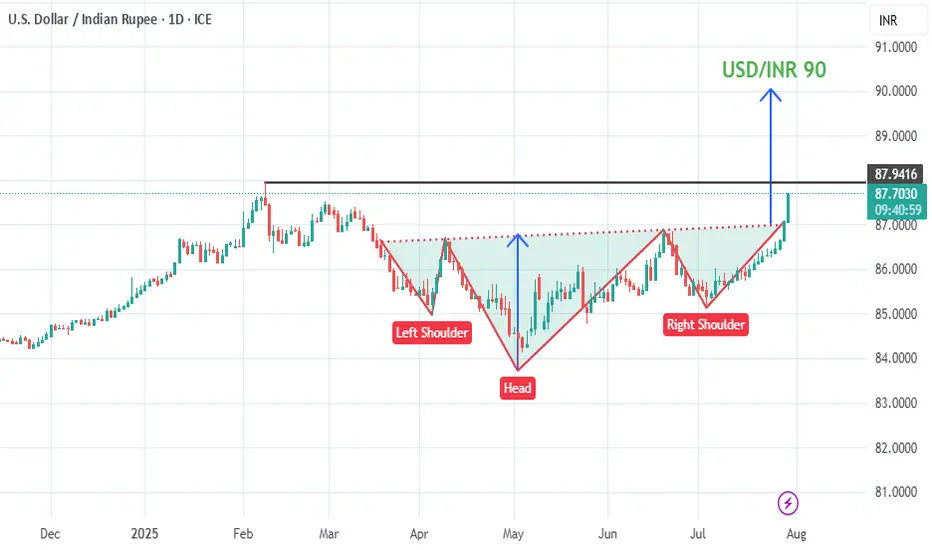
USD/INR pullback possible, USD/MXN eyes 18.95USD/INR surged from 86.30 to nearly 87.85 in just over a week, driven by U.S. President Donald Trump announcing plans to impose a 25% tariff on select Indian exports.
The latest 4H candles show signs of exhaustion, with price stalling near the highs and forming small-bodied candles with upper wicks

See all forex ideas
| EUR | USD | GBP | JPY | INR | |||||
|---|---|---|---|---|---|---|---|---|---|
| EUR | - | - | - | - | - | - | - | - | |
| USD | - | - | - | - | - | - | - | - | |
| GBP | - | - | - | - | - | - | - | - | |
| JPY | - | - | - | - | - | - | - | - | |
| CHF | - | - | - | - | - | - | - | - | |
| AUD | - | - | - | - | - | - | - | - | |
| CNY | - | - | - | - | - | - | - | - | |
| CAD | - | - | - | - | - | - | - | - | |
| INR | - | - | - | - | - | - | - | - |
News didn't load
Looks like that didn't go very well. Let's try again.
Trade directly on the supercharts through our supported, fully-verified and user-reviewed brokers.


