USDCHF - TREND REVERSAL CONFIRMEDSymbol - USDCHF
USDCHF is confirming a reversal of its prior downtrend and appears poised to transition into a distribution phase, supported by strength in the US Dollar Index.
The dollar is currently breaking through resistance and may continue its bullish correction within the broader long-term d

The best trades require research, then commitment.
Get started for free$0 forever, no credit card needed

Scott "Kidd" PoteetThe unlikely astronaut

Where the world does markets
Join 100 million traders and investors taking the future into their own hands.
Major indices

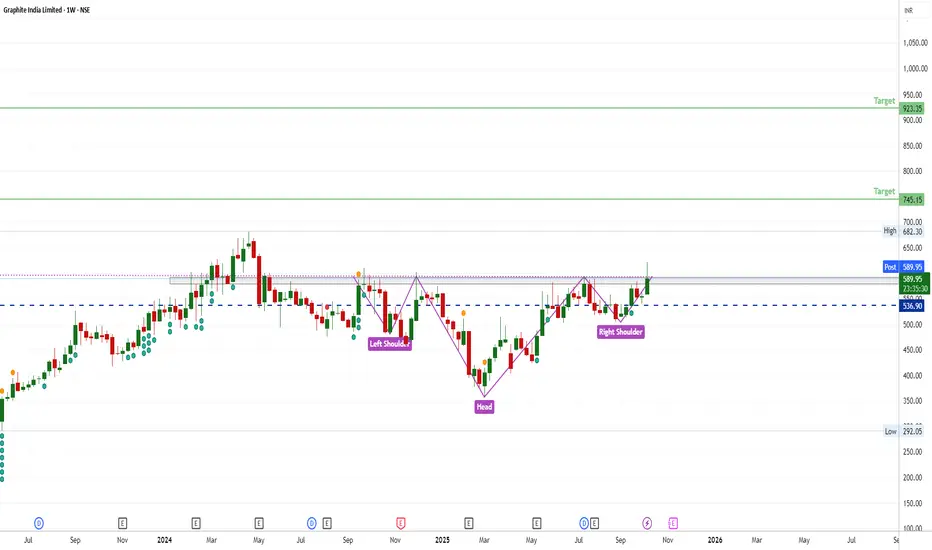
Long time Breakout Head and Shoulder🧩 Pattern Overview
Left Shoulder: Formed when price fell from around ₹620 to ₹500, then bounced back.
Head: A deeper decline down to around ₹420 before recovering — marking the lowest point of the pattern.
Right Shoulder: A smaller dip to around ₹500 before price rose again.
Neckline: The resist
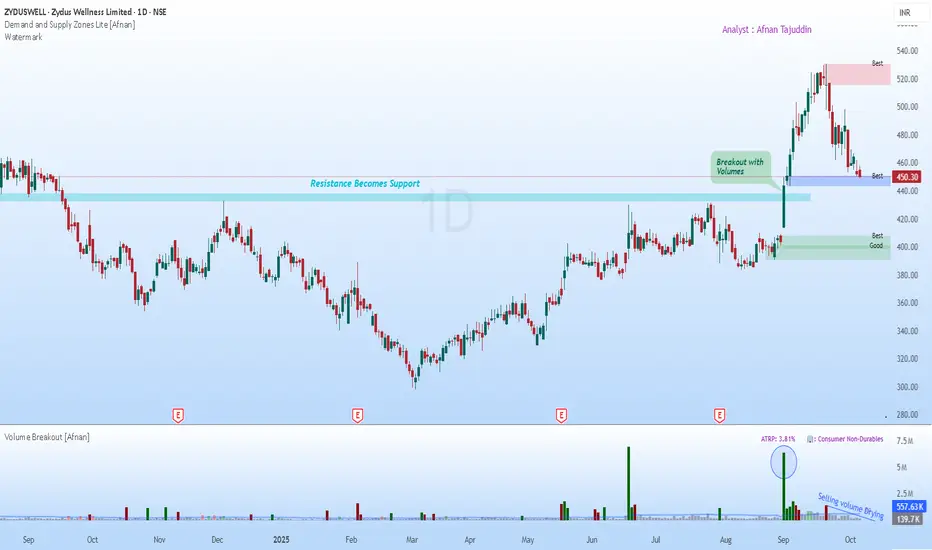
Powerful Setup & Art of the Pullback: Supply & Demand Concept📊 Supply & Demand View 📊
When you look closely, supply and demand zones are essentially the fingerprints of institutional activity. Big players rarely dump or buy entire positions in one shot—they stagger their trades, leaving behind identifiable imbalances on the charts. Every time price revisits
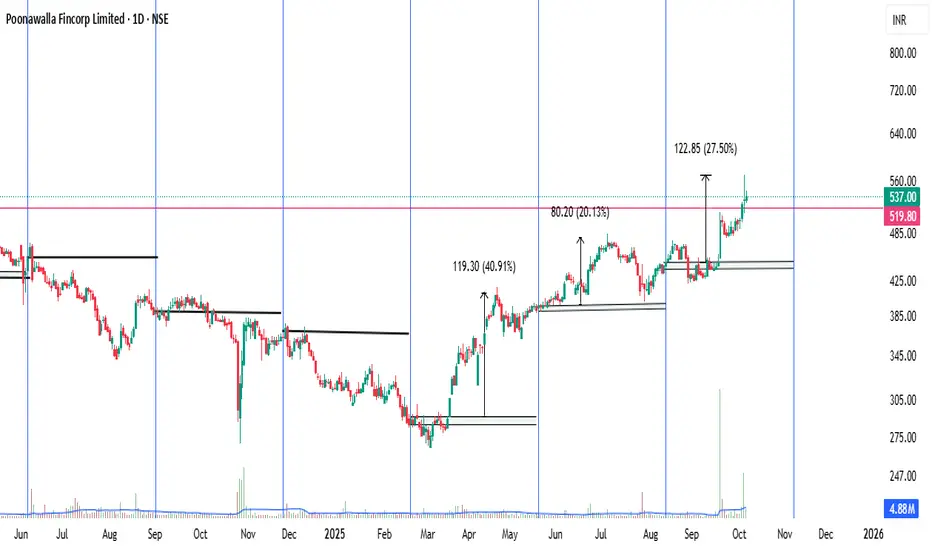
Poonawalla Fincorp (POONAWALLA)Poonawalla Fincorp Limited (NSE: POONAWALLA), a non-banking financial company (NBFC) under the Cyrus Poonawalla Group, focuses on consumer and MSME lending, including personal loans, vehicle finance, and supply chain financing. As of October 7, 2025, the stock trades around ₹565, up ~8% in the last
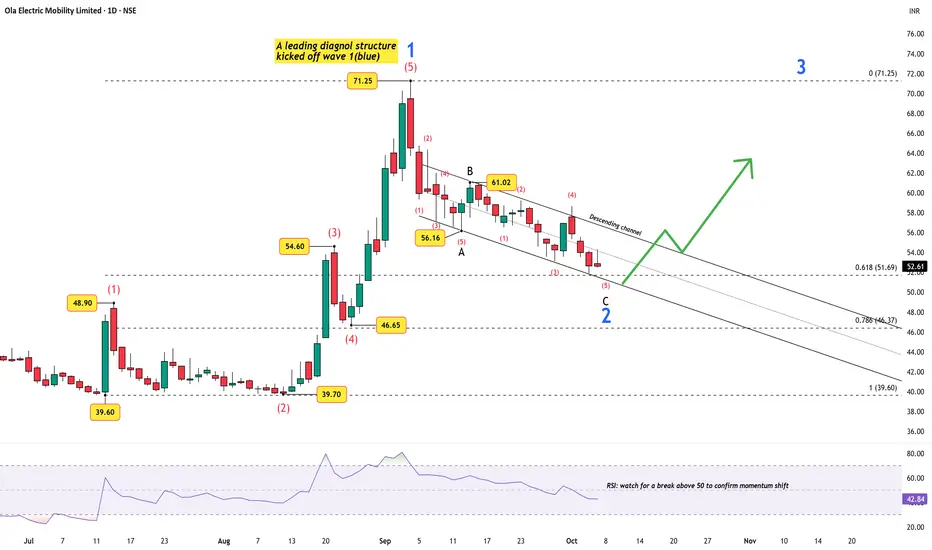
Charging Up for Wave 3 — Ola’s Motor Just Got Certified!The electric vehicle (EV) space in India is heating up again — and Ola Electric seems to be quietly positioning itself for the next leg of growth. The company’s recent government certification for its in-house ferrite motor marks an important milestone: a domestically designed motor that avoids co
ETHUSD: Where Price Could Go?4h tf
ETHUSD has bounced back strongly from around $3,826 after completing an A-B-C wave pattern. Right now, the price is testing resistance near $4,756. It could drop a little to around $4,440 before moving higher again. If the uptrend continues, the next target levels are $4,955, $5,300, and $5,5

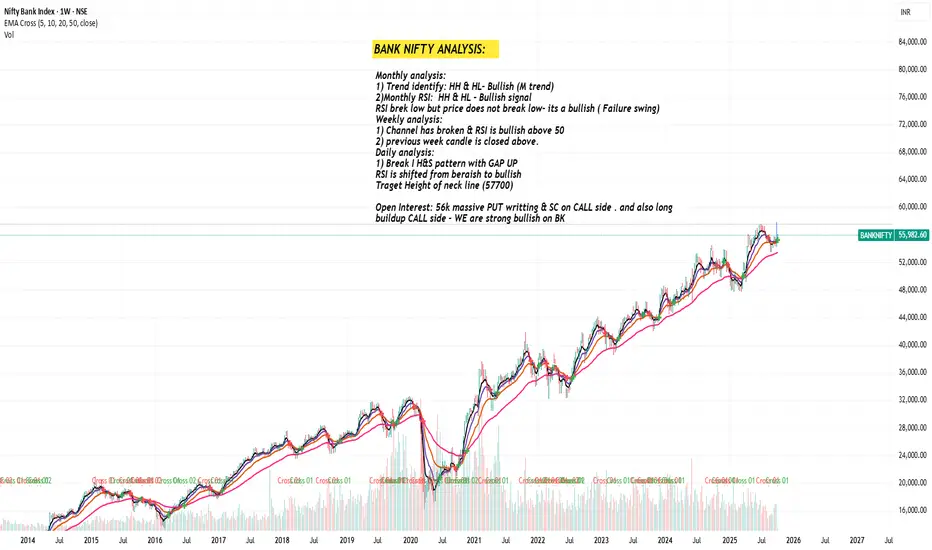
BANK NIFTY ANALYSIS: Strong BullishMonthly analysis:
1) Trend identify: HH & HL- Bullish (M trend)
2)Monthly RSI: HH & HL - Bullish signal
RSI brek low but price does not break low- its a bullish ( Failure swing)
Weekly analysis:
1) Channel has broken & RSI is bullish above 50
2) previous week candle is closed above.
Daily analysi
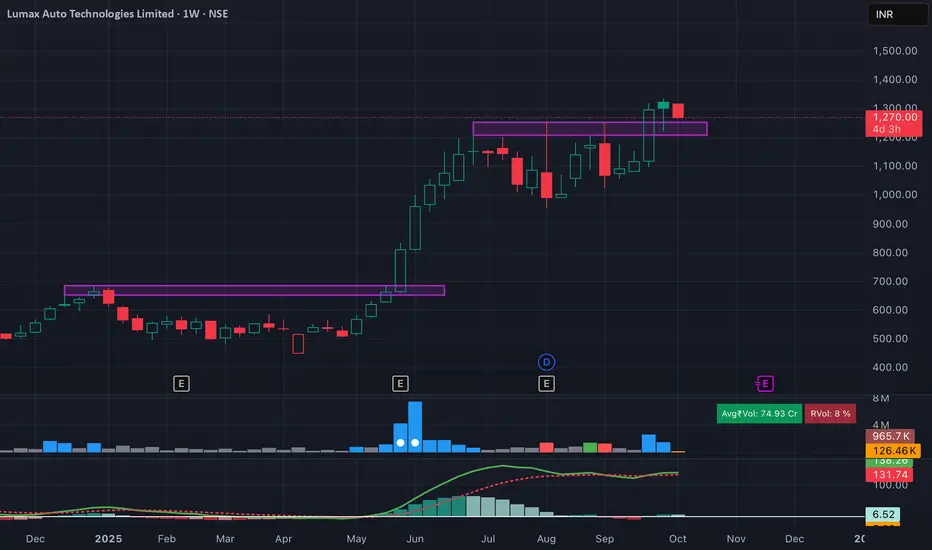
Lumax Auto Technologies – Fresh Breakout & Retest OpportunityLumax Auto Technologies has given a clean breakout above the 1,200–1,230 resistance zone and is now retesting the breakout on the weekly chart. Structure remains strong with higher highs and higher lows — showing continuation of the uptrend.
MACD is stabilizing after a healthy correction, suggesting
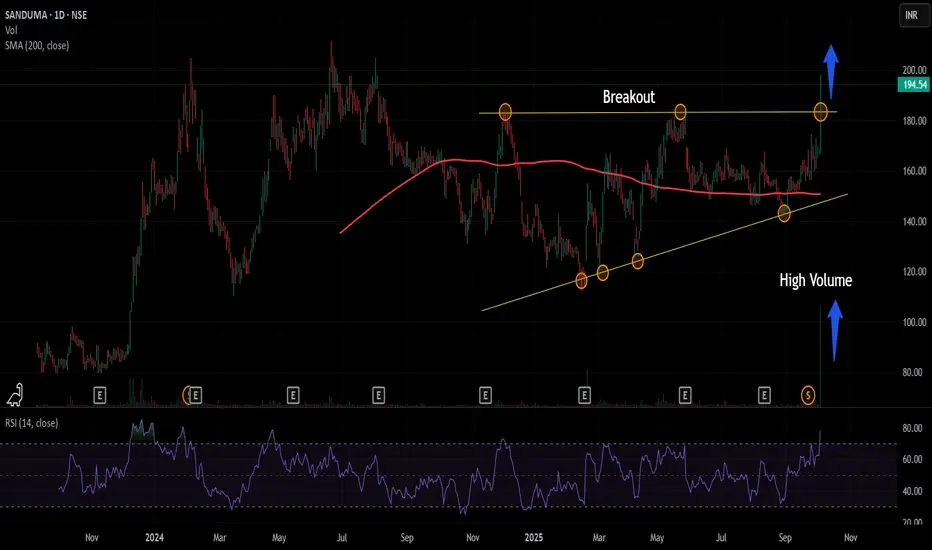
Sandur Manganese & Iron Ores Ltd : Breakout Sandur Manganese & Iron Ores Ltd is in consolidation since last one year. On Friday 3rd of Oct the stock moved up 15% with huge uptick in the volume.
The RSI reading above 70 also suggest there is momentum in the move.
Sector : Metal, outperforming to Nifty 50 benchmark
Looking at the price ch
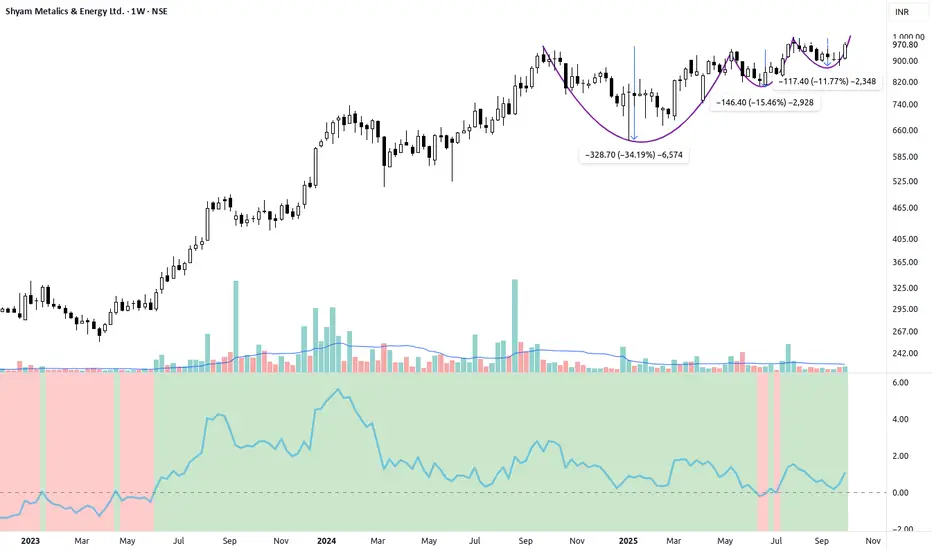
SHYAMMETL -High-Conviction VCP Breakout Setup1. The Setup: Textbook Volatility Contraction Pattern (VCP)
SHYAMMETL is setting up for a major breakout after consolidating near its all-time highs. The chart shows a classic Volatility Contraction Pattern (VCP), a powerful sign of institutional accumulation and supply exhaustion.
We can clearly
See all editors' picks ideas
PongExperience PONG! The classic arcade game, now on your charts!
With this indicator, you can finally achieve your lifelong dream of beating the Markets. . . at PONG!
Pong is jam-packed with features! Such as:
2 Paddles
A moving dot
Floating numbers
The idea of a net
This indicator is solel

Options Max Pain Calculator [BackQuant]Options Max Pain Calculator
A visualization tool that models option expiry dynamics by calculating "max pain" levels, displaying synthetic open interest curves, gamma exposure profiles, and pin-risk zones to help identify where market makers have the least payout exposure.
What is Max Pain?
Max

Volume Profile 3D (Zeiierman)█ Overview
Volume Profile 3D (Zeiierman) is a next-generation volume profile that renders market participation as a 3D-style profile directly on your chart. Instead of flat histograms, you get a depth-aware profile with parallax, gradient transparency, and bull/bear separation, so you can see w

RiskMetrics█ OVERVIEW
This library is a tool for Pine programmers that provides functions for calculating risk-adjusted performance metrics on periodic price returns. The calculations used by this library's functions closely mirror those the Broker Emulator uses to calculate strategy performance metrics (

Simple Decesion Matrix Classification Algorithm [SS]Hello everyone,
It has been a while since I posted an indicator, so thought I would share this project I did for fun.
This indicator is an attempt to develop a pseudo Random Forest classification decision matrix model for Pinescript.
This is not a full, robust Random Forest model by any stretch o

Tick CVD [Kioseff Trading]Hello!
This script "Tick CVD" employs live tick data to calculate CVD and volume delta! No tick chart required.
Features
Live price ticks are recorded
CVD calculated using live ticks
Delta calculated using live ticks
Tick-based HMA, WMA, EMA, or SMA for CVD and price
Key tick levels (S

analytics_tablesLibrary "analytics_tables"
📝 Description
This library provides the implementation of several performance-related statistics and metrics, presented in the form of tables.
The metrics shown in the afforementioned tables where developed during the past years of my in-depth analalysis of various str

Adaptive Trend Classification: Moving Averages [InvestorUnknown]Adaptive Trend Classification: Moving Averages
Overview
The Adaptive Trend Classification (ATC) Moving Averages indicator is a robust and adaptable investing tool designed to provide dynamic signals based on various types of moving averages and their lengths. This indicator incorporates multipl

Statistics • Chi Square • P-value • SignificanceThe Statistics • Chi Square • P-value • Significance publication aims to provide a tool for combining different conditions and checking whether the outcome is significant using the Chi-Square Test and P-value.
🔶 USAGE
The basic principle is to compare two or more groups and check the results

FiniteStateMachine🟩 OVERVIEW
A flexible framework for creating, testing and implementing a Finite State Machine (FSM) in your script. FSMs use rules to control how states change in response to events.
This is the first Finite State Machine library on TradingView and it's quite a different way to think about your

See all indicators and strategies
Community trends
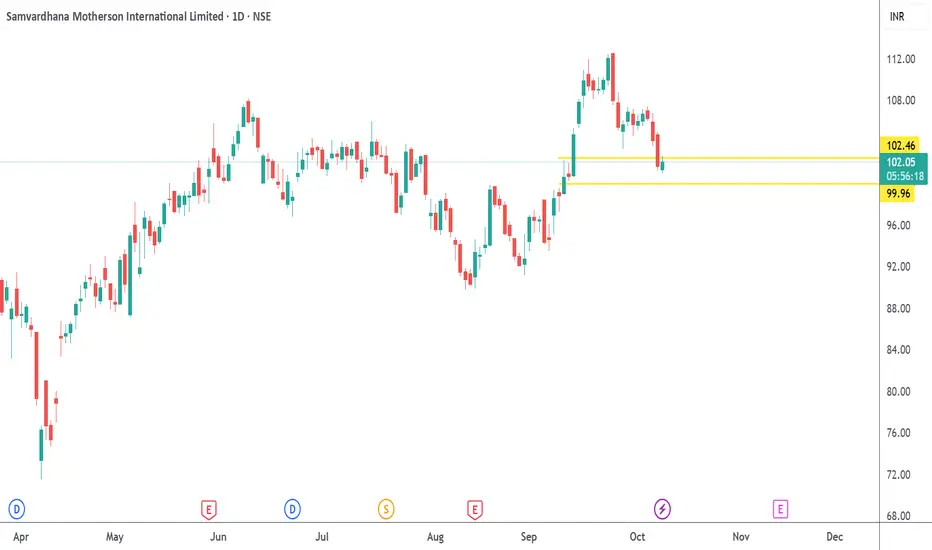
Buy MOTHERSON | Rally Base Rally on 11SEP 25Bought Date: 09 OCT 2025
Structure: Rally → Base → Rally
Setup : Demand Zone Formation on 11SEP25
Bought Price : 101.28
Exit Date: Anyday before 25 Sep 2025
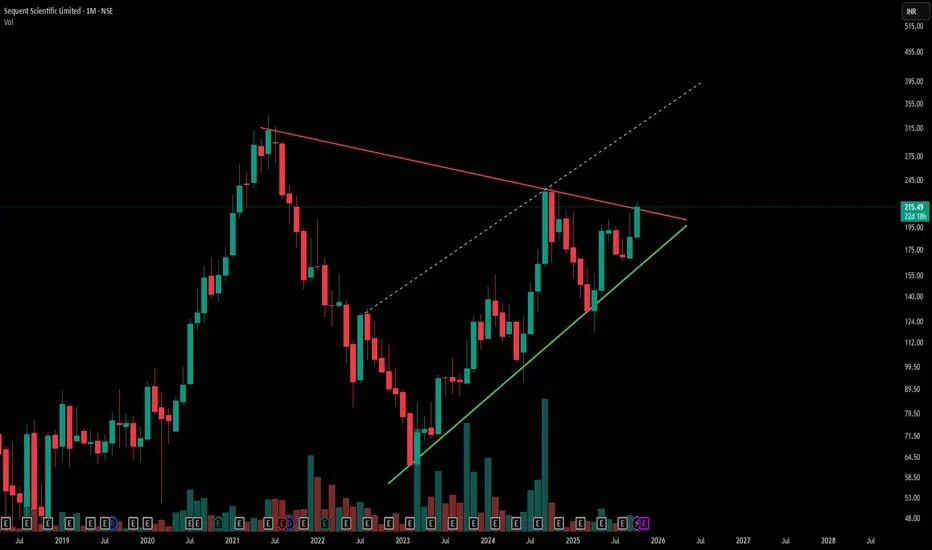
Symmetrical Triangle Breakout Watch | Sequent Scientific-Red line marks a key counter trendline (resistance) from previous swing highs, acting as a short-term ceiling.
-Green line indicates the primary trendline (support) from recent swing lows, showing steady price strength.
-Hidden dashed lines reveal underlying resistance zones, adding complexity to
Powerful Setup & Art of the Pullback: Supply & Demand Concept📊 Supply & Demand View 📊
When you look closely, supply and demand zones are essentially the fingerprints of institutional activity. Big players rarely dump or buy entire positions in one shot—they stagger their trades, leaving behind identifiable imbalances on the charts. Every time price revisits
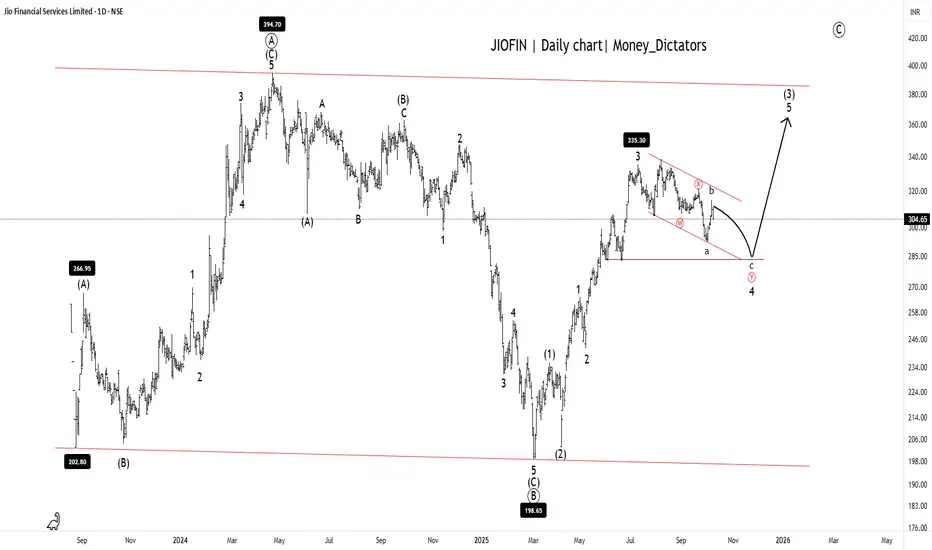
JIOFIN Setting Up for the Next Big Breakout!JIOFIN Daily chart
Possible short-term dip toward 285 - 290.
Long-term Levels: 335, 368, and 342.
Overall Trend: Bullish
Short-term trend: Bearish
JIOFIN is ready for the final upsurge as the correction ends at wave (C). A major A-B-C correction of the primary degree is clearly visible o
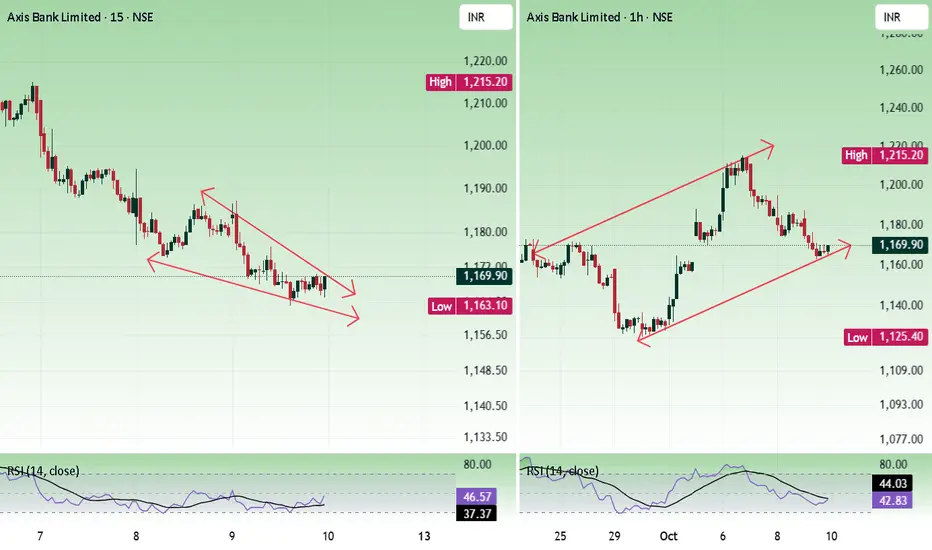
Axis bankPrice faced resistance at the 1200 - 1220 zone and falling. In higher time, the price is moving inside an ascending triangle. In a lower time frame, a falling wedge has formed. Both are bullish patterns. Holding 1160 is important for bulls.
Buying is risky if the price dont have volume strength.
Buy
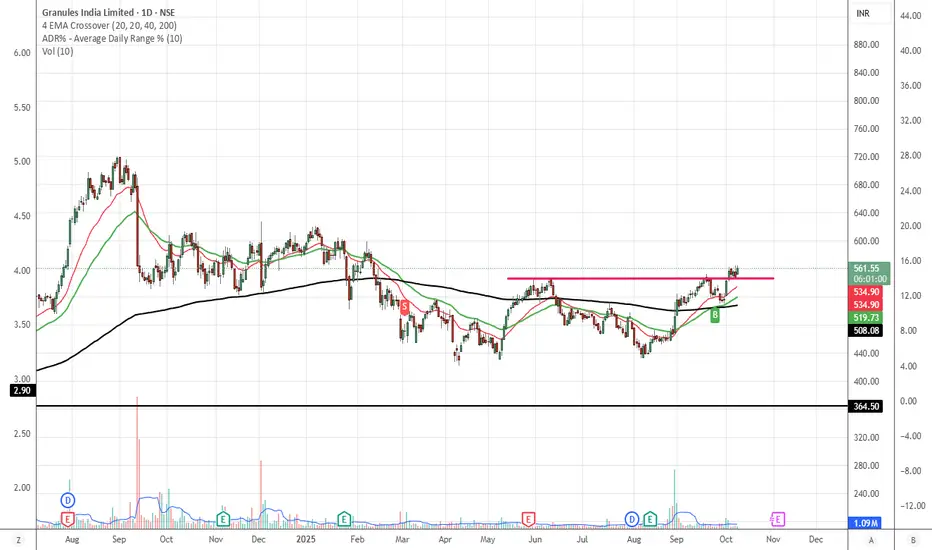
200 ema breakout and retestGranules looks to be going up after crossing 200 ema. Also previous resistance breakout and retest current.
Adani enterprisesADANI enterprises a flag ship company of adani group and closely related with our dear pm modi ji . As you can see in this chart it is clearly lagging of movement in its share price and also you can its 2 sided resistance one from connecting its all-time high one and other you can see as an horizont

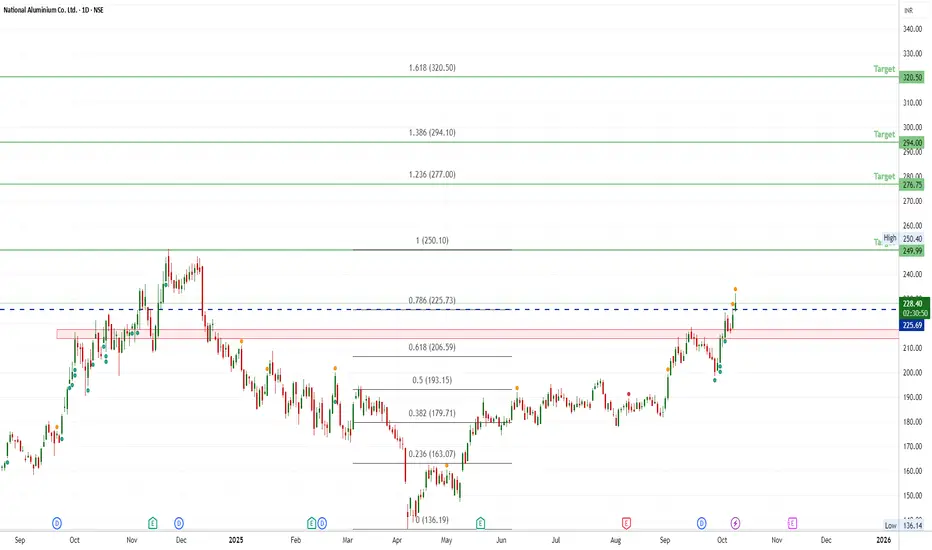
National Aluminium Co. Ltd (NALCO) – 1HMarket Structure:
Price is currently in a bullish trend with a clear BOS (Break of Structure) on the 1H timeframe. After showing strong displacement to the upside, the market is expected to retrace into a discount zone before continuing bullish expansion.
POI (Point of Interest):
A demand zone is i

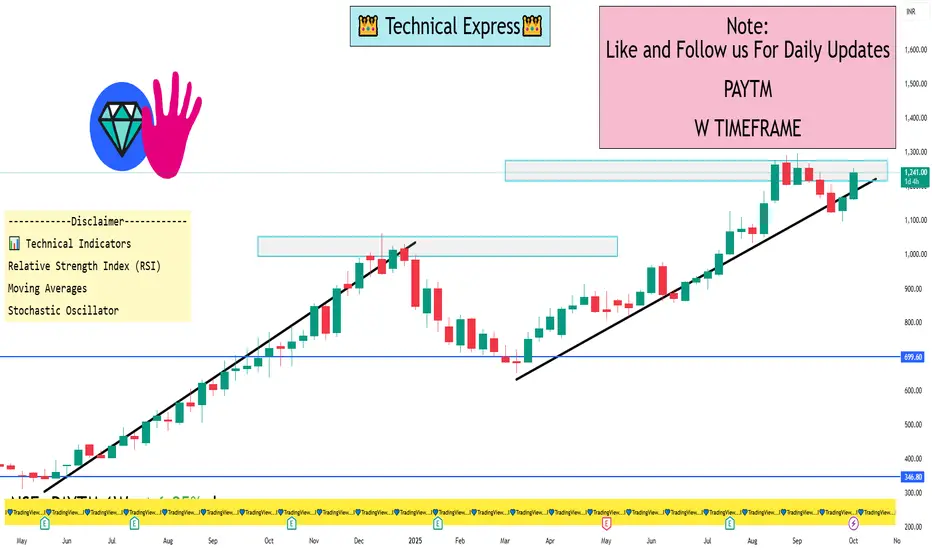
PAYTM 1 Week View 📈 Current Price Snapshot
Latest Price: ₹1,241.50
Day's Range: ₹1,224.30 – ₹1,247.80
52-Week Range: ₹651.50 – ₹1,296.60
🔧 Key Technical Levels (1-Week Timeframe)
Resistance Levels:
₹1,247.80 – Recent intraday high
₹1,288.30 – Near-term resistance zone
Support Levels:
₹1,224.30 – Recent intra
See all stocks ideas
Tomorrow
ELECONElecon Engineering Co. Ltd.
Actual
—
Estimate
—
Oct 11
DMARTAvenue Supermarts Ltd.
Actual
—
Estimate
11.13
INR
Oct 13
KRSNAAKrsnaa Diagnostics Limited
Actual
—
Estimate
7.20
INR
Oct 13
HCLTECHHCL Technologies Limited
Actual
—
Estimate
15.66
INR
Oct 13
ANANDRATHIAnand Rathi Wealth Ltd.
Actual
—
Estimate
—
Oct 14
THYROCAREThyrocare Technologies Ltd
Actual
—
Estimate
—
Oct 14
ICICIGIICICI Lombard General Insurance Co. Ltd.
Actual
—
Estimate
15.89
INR
Oct 14
GTPLGTPL Hathway Ltd
Actual
—
Estimate
—
See more events
Community trends
ETHFIUSDT - BULLS ARE NOT DONE YET?Symbol - ETHFIUSDT
ETHFIUSDT is undergoing a corrective phase after updating its local high at 1.938 The breakout above the 1.677 zone appears to be an attempt to initiate a distribution phase following an extended period of consolidation. The key question now is whether the bulls can sustain contr

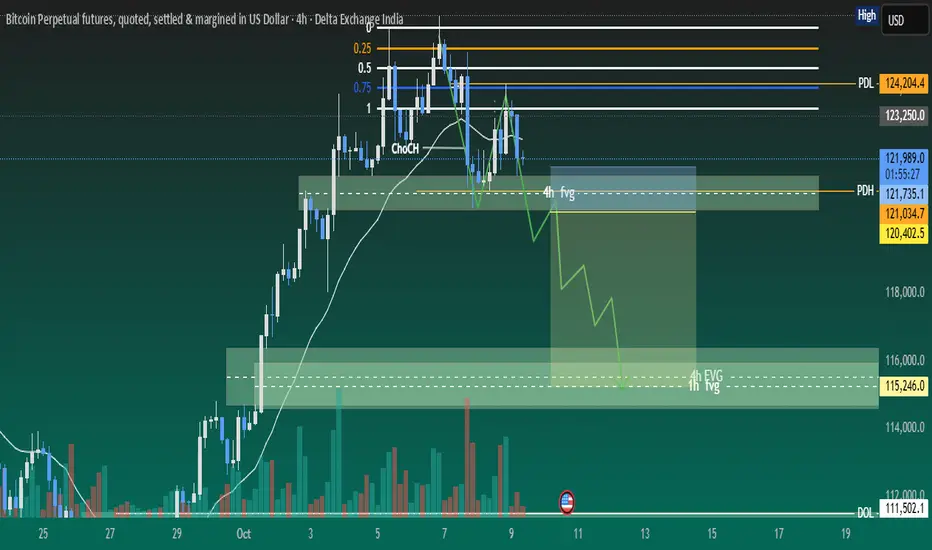
BTC is developing ~4R down side tradeBTC has done MSS on 4h time frame and showing rejection at 4H FVG after displacement. We can see a good downside trade once below FVG is mitigated and changed to iFVG. We need to wait for price getting into right zones.
1. Currently price is moving inside 4H FVG after displacement and showing rejec
BTC/USD: Structure Shift Confirmed - Bearish CHoCH Break"The previous analysis highlighted the Minor and Major CHoCH levels as key lines in the sand for the recent uptrend. The market has now decisively broken BELOW both levels.
This action confirms a Bearish Change of Character in the market structure (on the chart), signaling a failure of the curren

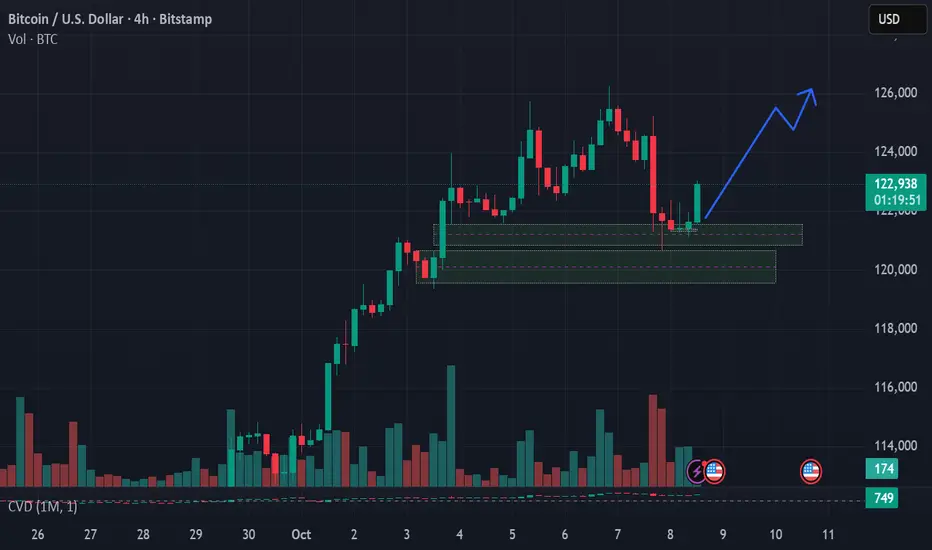
Btc is taking support after a slight dipAfter the bitcoin dip, its now taking a support from the 4H demand zone.
Target can be the ATH.
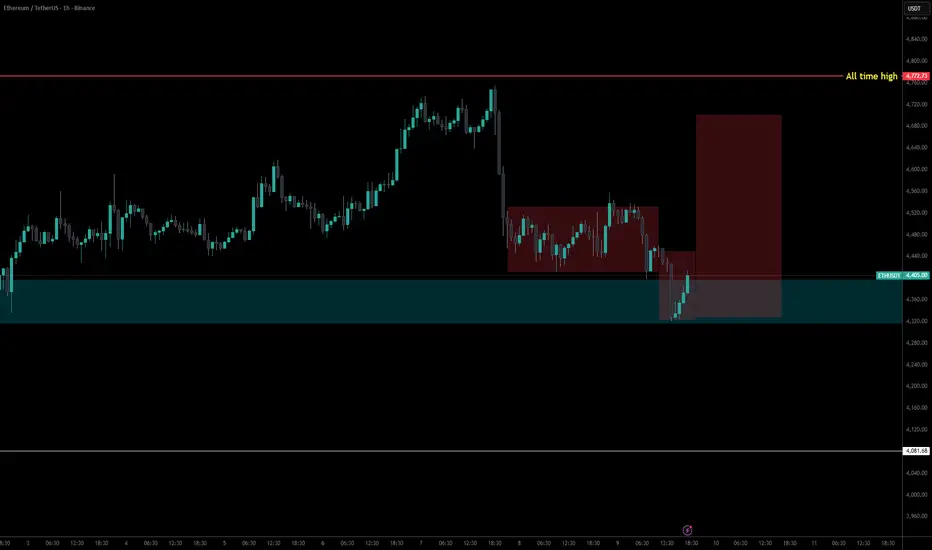
Ethereum 1H - LongEthereum 1H long, looks like an AMD (accumulation manipulation Distribution) set-up to me.
BTCUSD SHORT VIEW AT 4HAS per my analysis the supply is getting power full and demand is getting week as we can see on chart thats the reason to go short

BTC SELLBTC SELL ,
I was already watching price action for a selling. Now that I've found a pattern, I'll trade from here like this

ETHUSD: Where Price Could Go?4h tf
ETHUSD has bounced back strongly from around $3,826 after completing an A-B-C wave pattern. Right now, the price is testing resistance near $4,756. It could drop a little to around $4,440 before moving higher again. If the uptrend continues, the next target levels are $4,955, $5,300, and $5,5
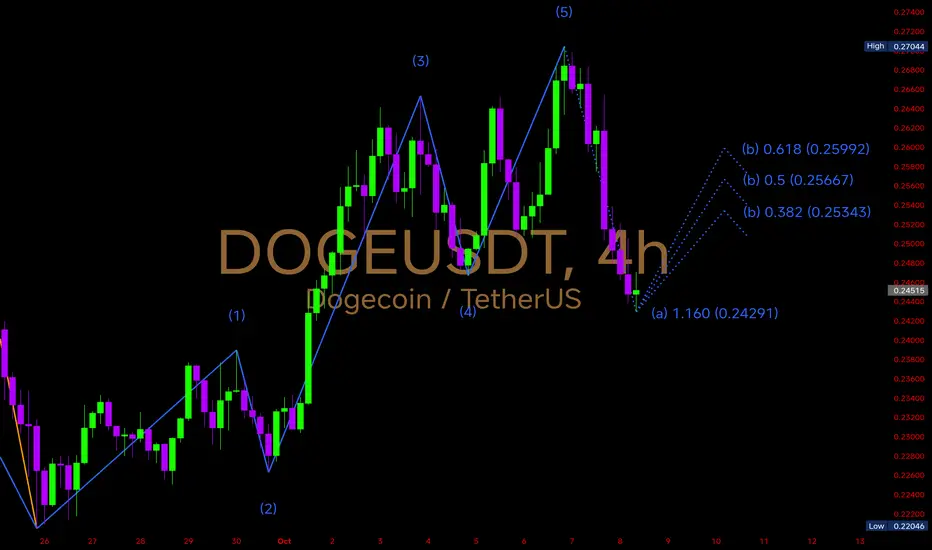
$DOGE just completed a clean 5-wave impulsive structure CRYPTOCAP:DOGE just completed a clean 5-wave impulsive structure on the 4H chart, peaking near 0.2704, and is now entering a corrective (ABC) phase.
The first leg of correction, wave (a), has extended down to 0.2429, aligning with the 1.160 Fibonacci extension, marking a potential local bottom.
BTCUSD - BITCOIN's Measured MoveCMP: 121000
TF: Daily
I don't trade this instrument. I am publishing this from the technical pattern perspective.
The rounding bottom target has been achieved 100% target at 122000 and since then the price is getting rejected at that level (almost three times now)..
Are we going to reject from he

See all crypto ideas
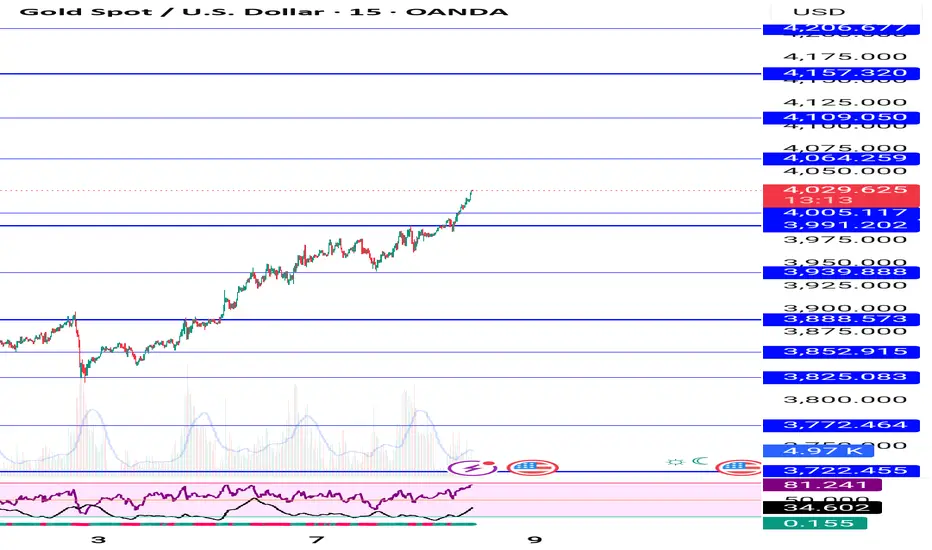
XAUUSD: Golden Surge at $4,035 — Breakout or Blow-Off Top?Summary
Gold has shattered previous highs, now hovering around $4,035. Is this a breakout with legs—or the final push before a correction? This idea blends macro catalysts with multi-timeframe technical analysis to guide your next move.
Macro Context
Geopolitical Risk: Safe-haven flows intensify

Gold (XAU/USD) Rebound Setup – Support Holding Strong!Analysis:
Gold (XAU/USD) is showing signs of bullish strength after testing the $4,000–$3,970 support zone, where buyers are stepping back in. The recent consolidation above support suggests a potential reversal and continuation of the uptrend.
The setup highlights:
Support Zone: Around $3,970 – $

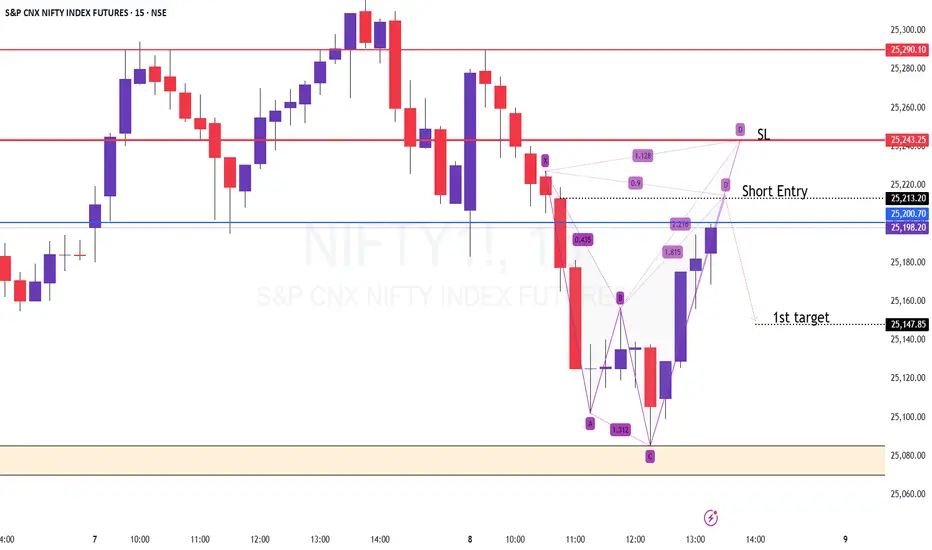
NIFTY Future - Harmonic Shark Pattern approaching PRZ - IntradayTF: 15 minutes
CMP: 25190
The Harmonic pattern formed intraday is close to the PRZ at 25210-220
One can expect 50% retracement of the CD leg (that is 25150) as the first target.
SL at 25240 in NF
Disclaimer: I am not a SEBI registered Analyst and this is not a trading advise. Views are person
gold silver momentum updategold silver momentum update---- silver sustain abv 148300 than looks sharp spike 150k near expect or if blw 147300 looks sharp dwn side 146500-145300+++--- gold abv 122700 sustain looks 124800--- already 123 told ---
spot gold sustain abv 4040 looks up side 4060--85-4100 expect in sudden spike 40

Gold 4000 $ upside target hit next target given on chart buy dipGood upside move will continue until US shutdown settlement news not come
How My Harmonic pattern projection Indicator work is explained below :
Recent High or Low :
D-0% is our recent low or high
Profit booking zone ( Early / Risky entry) : D 13.2% -D 16.1 % is
range if break them profit
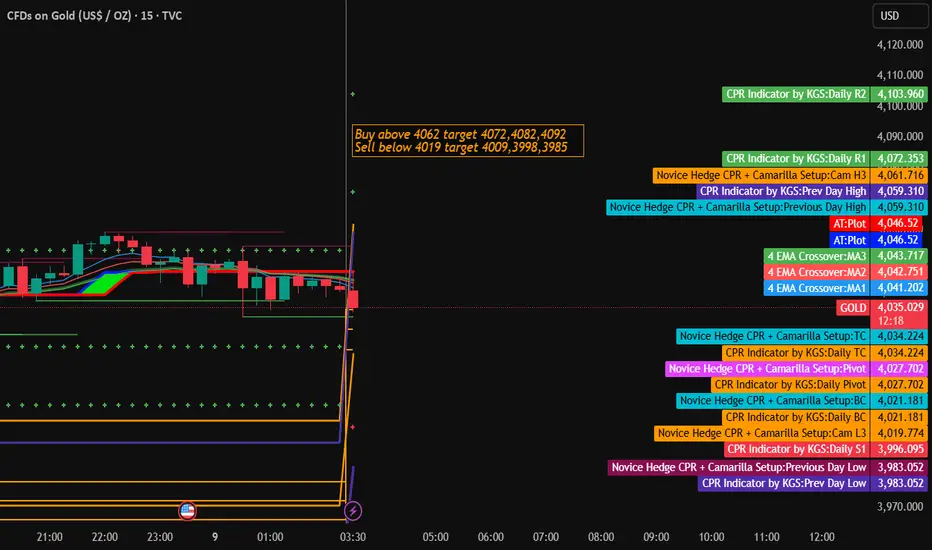
Gold Trading Strategy for 09th October 2025🎯 GOLD INTRADAY SETUP
🟢 BUY Setup:
💰 Buy Above: $4062 (1-hour candle close above this level)
🎯 Targets:
1️⃣ $4072
2️⃣ $4082
3️⃣ $4092
🔴 SELL Setup:
💰 Sell Below: $4019 (1-hour candle close below this level)
🎯 Targets:
1️⃣ $4009
2️⃣ $3998
3️⃣ $3985
⚠️ Disclaimer:
📉 This analysis is for educational
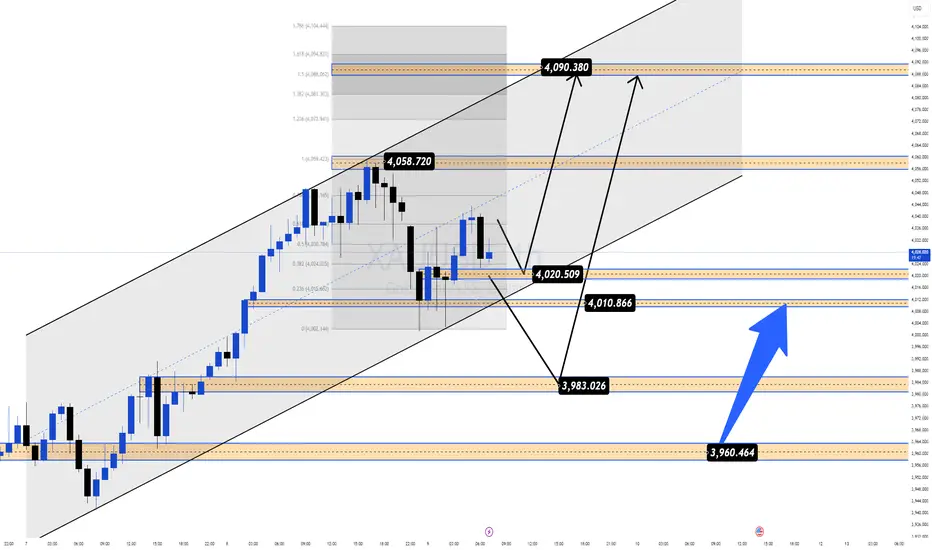
Bulls Reloading After a Healthy Pullback | Next Target: 4090+📊 Market Context
After a powerful bullish rally that pushed gold to record highs, XAUUSD retraced about 1% on Thursday as traders took profit from the recent surge. However, this move appears to be a technical correction, not a trend reversal — as indicators have shown overbought conditions for seve
Elliott Wave Analysis – XAUUSD 09/10/2025
________________________________________
🔹 1. Momentum
D1:
The current momentum is turning downward.
We need to wait for today’s D1 candle to close for confirmation.
➡️ If the daily candle closes bearish, it may mark the beginning of a deep and strong corrective wave.
H4:
H4 momentum is about to e

XAUUSD – PRICE ABOVE $4000: ABSOLUTELY CRAZY FOR TRADERSXAUUSD – PRICE ABOVE $4000: ABSOLUTELY CRAZY FOR TRADERS
Gold has officially surpassed the $4000 mark, marking one of the most robust increases in recent history.
Let's take a look at the key price zones and short-term opportunities 👇
🔻 SELL Scenario
SELL 4025–4027 → SL 4033 → TP 4015 – 4000 – 398

GOLD UPDATE – Bulls Defend $4,000 Ahead of Powell’s SpeechGold continues to hold firm above the key $4,000 psychological level, even after a sharp correction from the all-time high near $4,059. The market’s focus now shifts to Fed Chair Jerome Powell’s speech, which could set the tone for the next directional move.
Despite the recent dip, the overall stru

See all futures ideas
USDCHF - TREND REVERSAL CONFIRMEDSymbol - USDCHF
USDCHF is confirming a reversal of its prior downtrend and appears poised to transition into a distribution phase, supported by strength in the US Dollar Index.
The dollar is currently breaking through resistance and may continue its bullish correction within the broader long-term d
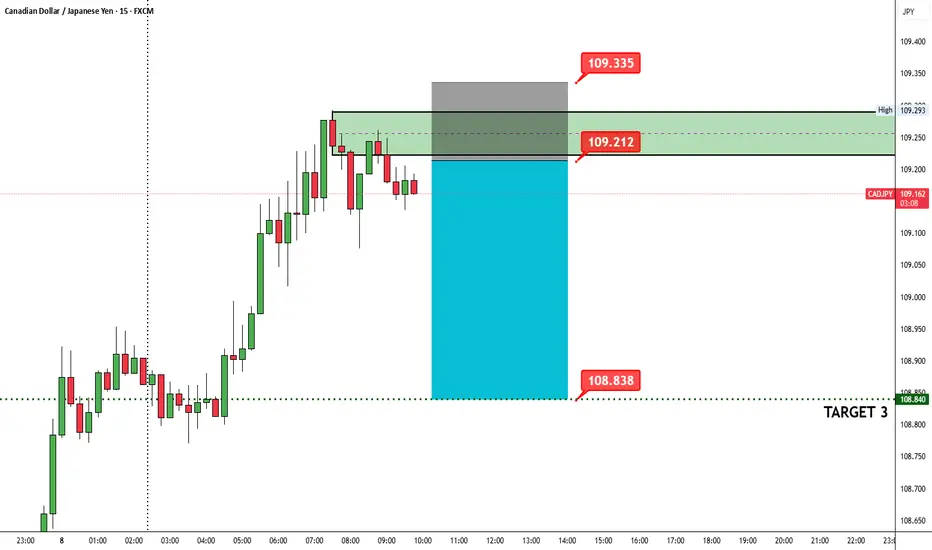
CADJPY | Intraday Short Setup – Smart Money Play in ActionAfter a strong bullish impulse, CADJPY has entered a critical supply zone where price previously showed signs of exhaustion. On the 15-minute chart, the pair formed a clear liquidity grab above the previous highs and then started showing rejection candles — an early sign of potential bearish momentu
CHF/JPY Builds Momentum for Next Wave HigherThe CHF/JPY 1-hour chart shows a completed wave (1) near the 191.17 level, confirming a strong bullish impulse after a previous decline. The pair is now entering a wave (2) corrective phase, which is likely to retrace toward the 188.7–189.0 support zone before resuming the next upward move. This

USDCAD MULTI TIME FRAME ANALYSISHello traders , here is the full multi time frame analysis for this pair, let me know in the comment section below if you have any questions , the entry will be taken only if all rules of the strategies will be satisfied. wait for more price action to develop before taking any position. I suggest yo

Result of the last trade idea which i published few hours agoAUD/USD short idea played out perfectly.
Price reacted from the marked supply zone during London session, aligned with strong USD fundamentals and weak AUD sentiment.
Trade respected structure, mitigated FVG, and reached the target cleanly.
Simple liquidity-based execution — patience paid off. 💪📉
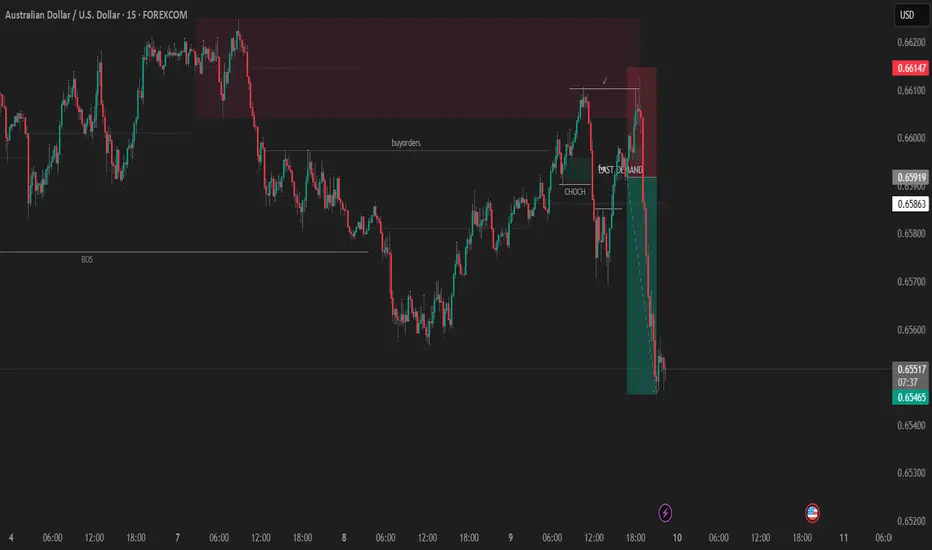
AUDUSD 15M IDEAFOREXCOM:AUDUSD
Hello traders , here is the full multi time frame analysis for this pair, let me know in the comment section below if you have any questions, the entry will be taken only if all rules of the strategies will be satisfied. wait for more Smart Money to develop before taking any po

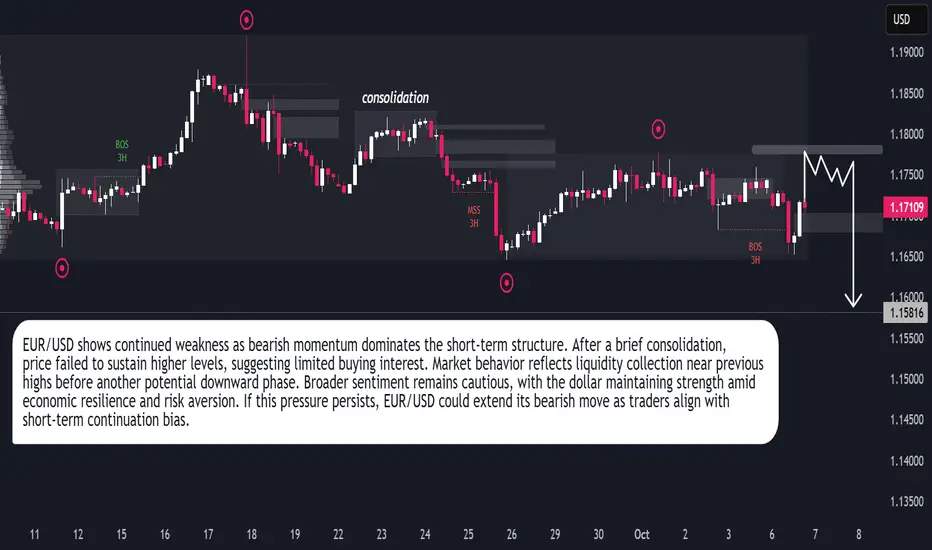
EUR/USD – Bearish Continuation in MotionEUR/USD continues to display a bearish market structure, reflecting persistent downside pressure as the euro struggles to maintain stability against the U.S. dollar. Recent price action shows a period of consolidation followed by a liquidity grab near short-term highs, indicating that buyers are los
EURUSD - SELL SETUP EURUSD – Clean SELL Setup Ahead 🧠📉
📍 Bias: Short
📍 Pair: EUR/USD
🕒 Timeframes: 1H | 4H | Daily | Weekly
🧭 Multi-Timeframe Outlook
EURUSD is showing bearish structure on the 4H and 1H, while the Daily and Weekly remain bullish — giving us a potential short-term corrective opportunity.
At the same tim

See all forex ideas
| - | - | - | - | - | - | - | - | ||
| - | - | - | - | - | - | - | - | ||
| - | - | - | - | - | - | - | - | ||
| - | - | - | - | - | - | - | - | ||
| - | - | - | - | - | - | - | - | ||
| - | - | - | - | - | - | - | - | ||
| - | - | - | - | - | - | - | - | ||
| - | - | - | - | - | - | - | - | ||
| - | - | - | - | - | - | - | - |
Trade directly on the supercharts through our supported, fully-verified and user-reviewed brokers.


