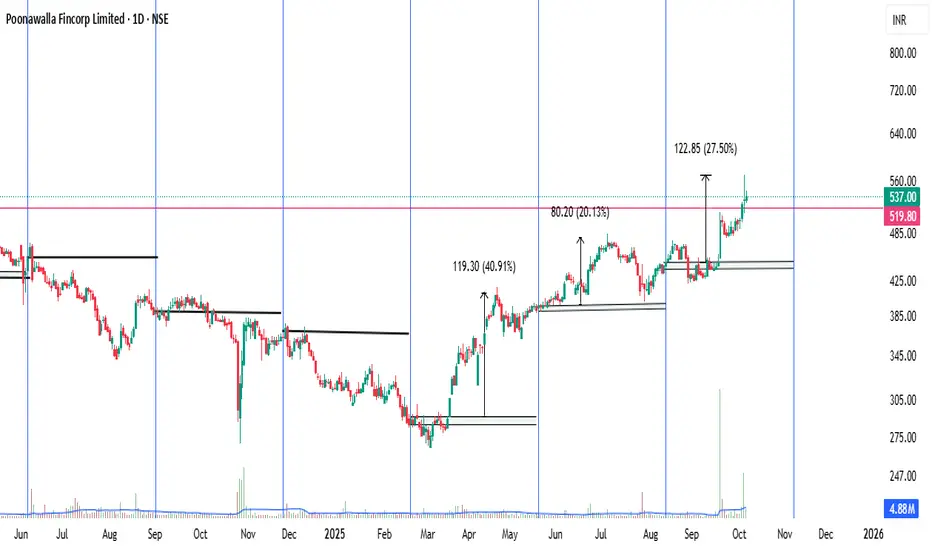
Poonawalla Fincorp (POONAWALLA)Poonawalla Fincorp Limited (NSE: POONAWALLA), a non-banking financial company (NBFC) under the Cyrus Poonawalla Group, focuses on consumer and MSME lending, including personal loans, vehicle finance, and supply chain financing. As of October 7, 2025, the stock trades around ₹565, up ~8% in the last

The best trades require research, then commitment.
Get started for free$0 forever, no credit card needed

Scott "Kidd" PoteetThe unlikely astronaut

Where the world does markets
Join 100 million traders and investors taking the future into their own hands.
Major indices
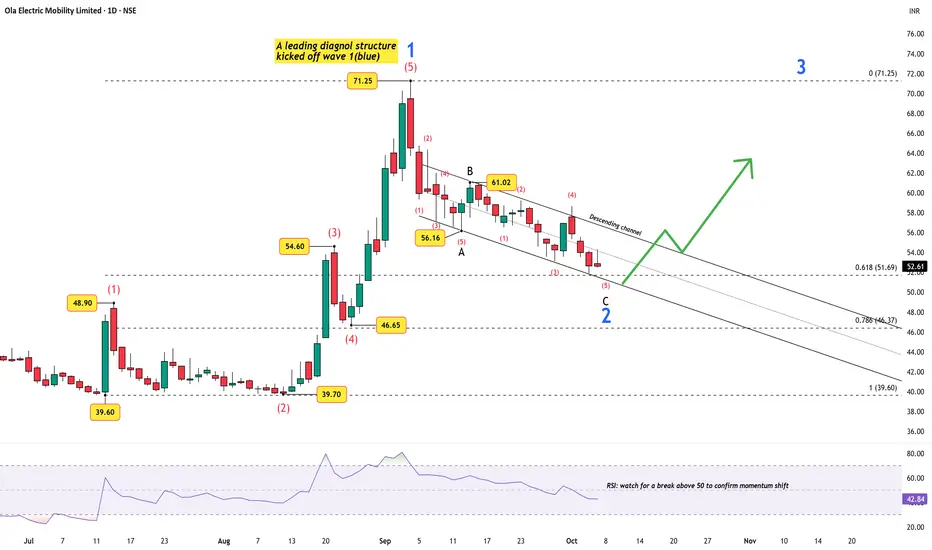
Charging Up for Wave 3 — Ola’s Motor Just Got Certified!The electric vehicle (EV) space in India is heating up again — and Ola Electric seems to be quietly positioning itself for the next leg of growth. The company’s recent government certification for its in-house ferrite motor marks an important milestone: a domestically designed motor that avoids co
ETHUSD: Where Price Could Go?4h tf
ETHUSD has bounced back strongly from around $3,826 after completing an A-B-C wave pattern. Right now, the price is testing resistance near $4,756. It could drop a little to around $4,440 before moving higher again. If the uptrend continues, the next target levels are $4,955, $5,300, and $5,5

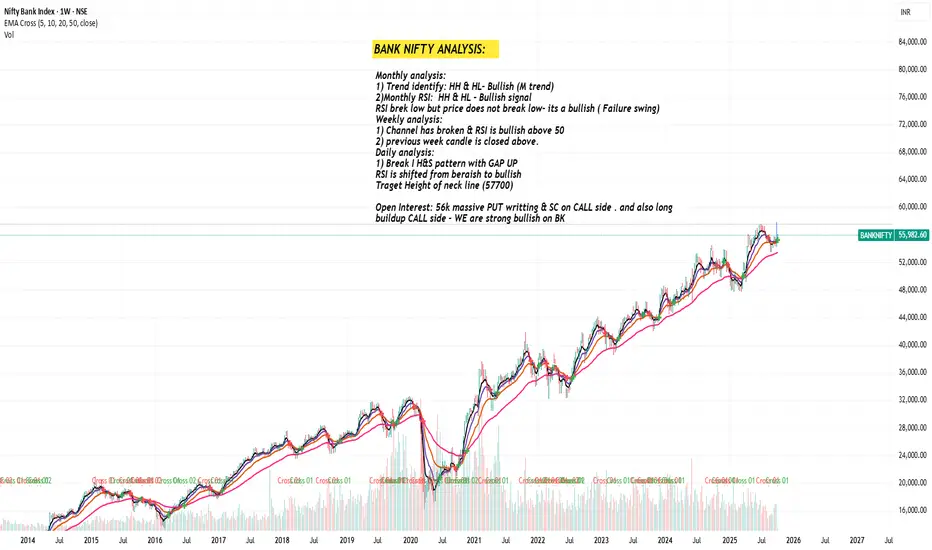
BANK NIFTY ANALYSIS: Strong BullishMonthly analysis:
1) Trend identify: HH & HL- Bullish (M trend)
2)Monthly RSI: HH & HL - Bullish signal
RSI brek low but price does not break low- its a bullish ( Failure swing)
Weekly analysis:
1) Channel has broken & RSI is bullish above 50
2) previous week candle is closed above.
Daily analysi
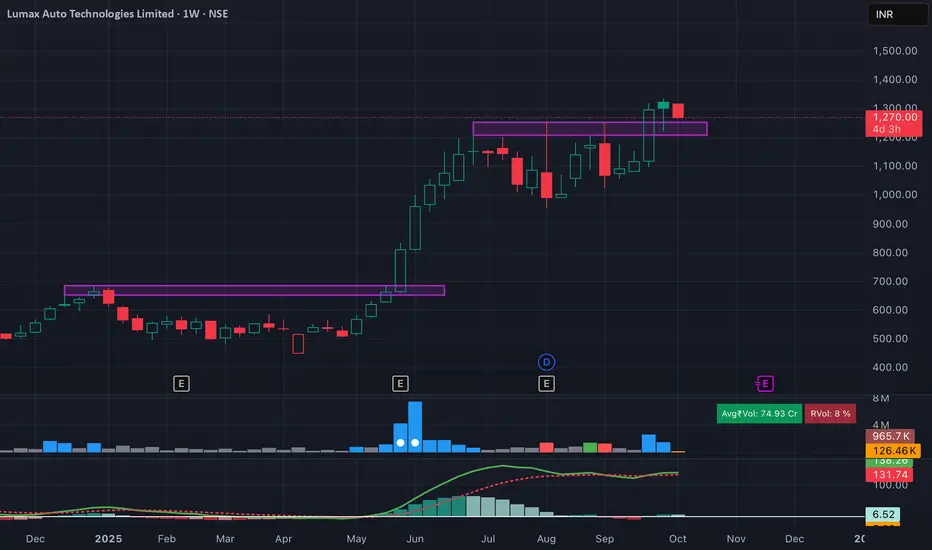
Lumax Auto Technologies – Fresh Breakout & Retest OpportunityLumax Auto Technologies has given a clean breakout above the 1,200–1,230 resistance zone and is now retesting the breakout on the weekly chart. Structure remains strong with higher highs and higher lows — showing continuation of the uptrend.
MACD is stabilizing after a healthy correction, suggesting
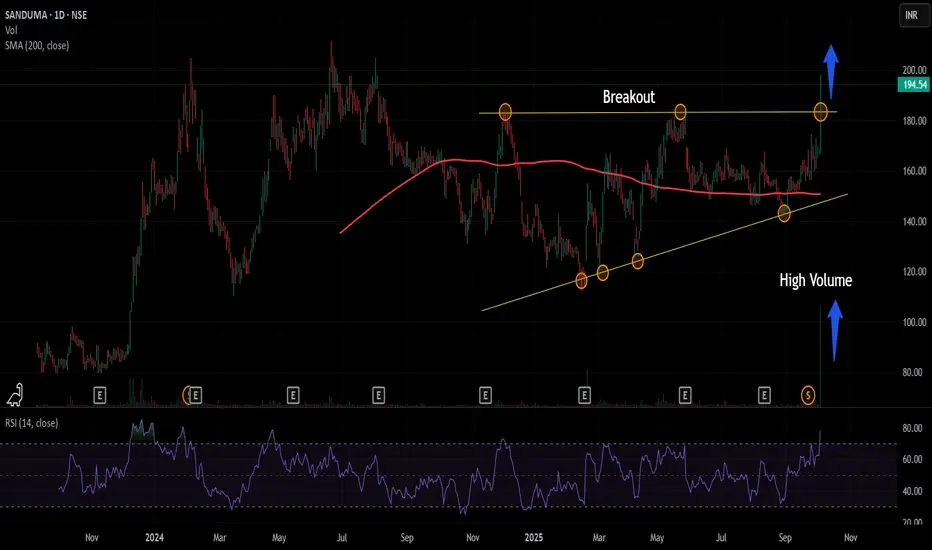
Sandur Manganese & Iron Ores Ltd : Breakout Sandur Manganese & Iron Ores Ltd is in consolidation since last one year. On Friday 3rd of Oct the stock moved up 15% with huge uptick in the volume.
The RSI reading above 70 also suggest there is momentum in the move.
Sector : Metal, outperforming to Nifty 50 benchmark
Looking at the price ch
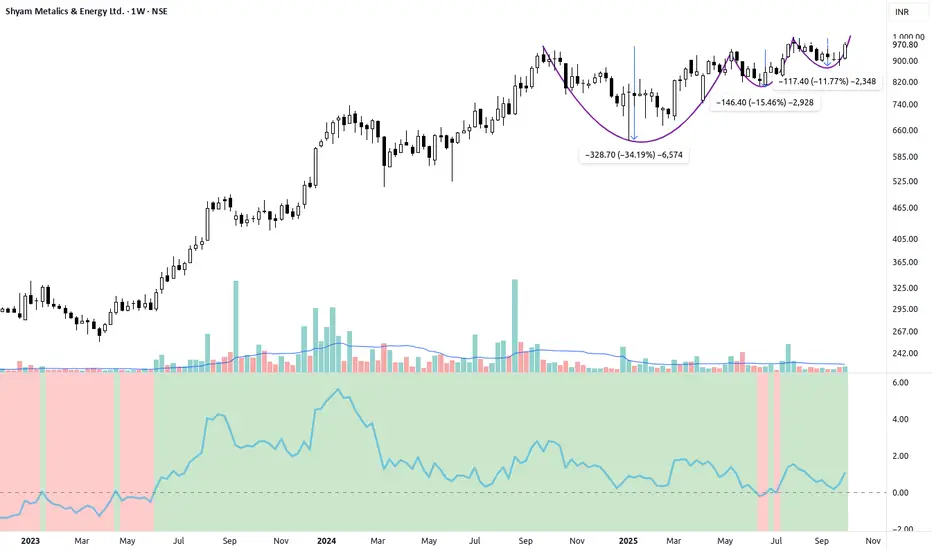
SHYAMMETL -High-Conviction VCP Breakout Setup1. The Setup: Textbook Volatility Contraction Pattern (VCP)
SHYAMMETL is setting up for a major breakout after consolidating near its all-time highs. The chart shows a classic Volatility Contraction Pattern (VCP), a powerful sign of institutional accumulation and supply exhaustion.
We can clearly
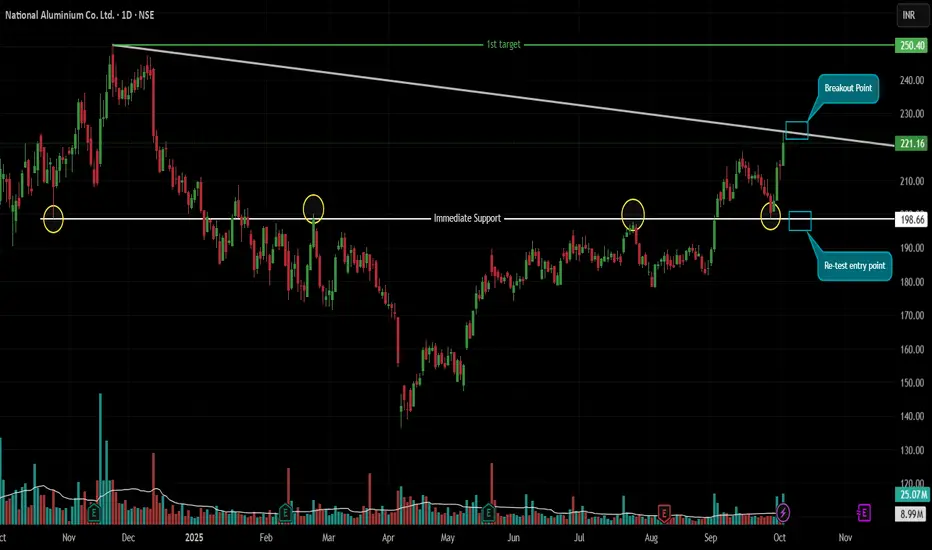
Two Precision Setups for a Major Move | Breakout vs. ReboundChart: NSE:NALCO | Daily Timeframe
📈 Executive Summary:
Nalco Ltd. is at a technical crossroads, compressed between a massive 12-month descending trendline and a rock-solid multi-touch support zone. This creates two high-probability, well-defined trading opportunities for both momentum and value t
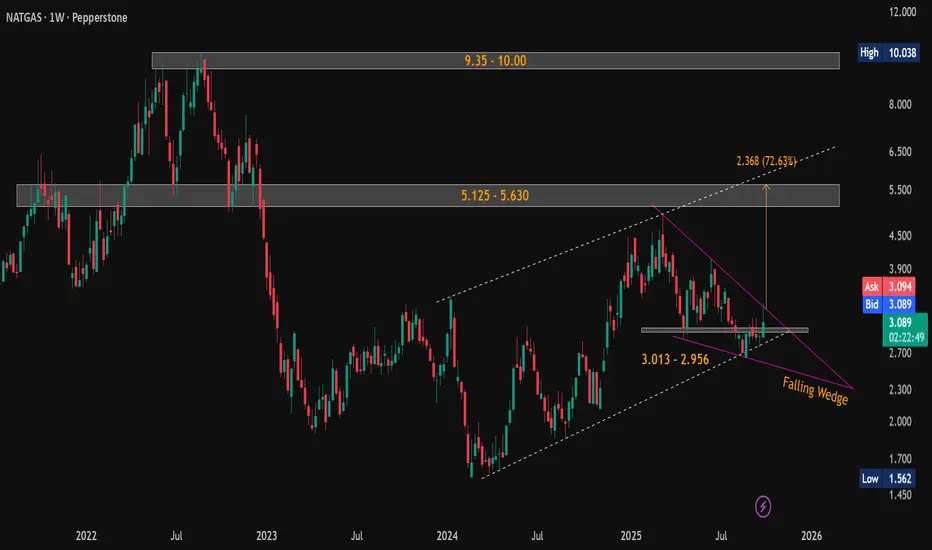
Natural Gas (NG) Weekly Breakout Brewing — 80% Upside Potential!Current Price: $3.090
Technical View (Weekly Timeframe):
Natural Gas has formed a classic falling wedge pattern on the weekly chart - a strong bullish reversal setup. Price action is currently on the verge of breakout , with increasing volume and narrowing range suggesting imminent movement.
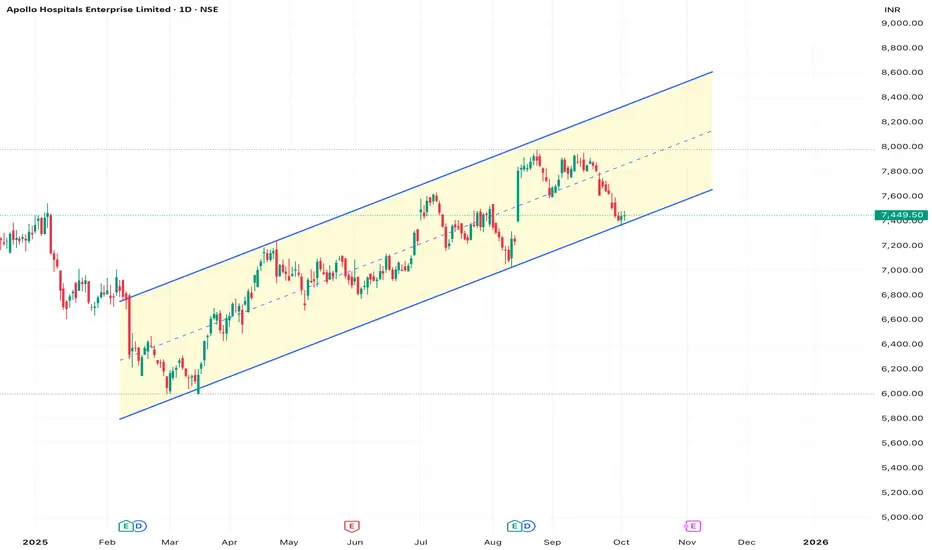
Apollo Hospital: Structure Analysis & Trade PlanThe price is currently sitting at ₹7,449.50, making it a high-interest area from a technical perspective.
Market Structure & Chart Pattern Analysis
Chart Pattern (Classic TA): The price is perfectly tracking the lower boundary (support) of a long-term Upward Channel. This is a classic "Buy th
See all editors' picks ideas
PongExperience PONG! The classic arcade game, now on your charts!
With this indicator, you can finally achieve your lifelong dream of beating the Markets. . . at PONG!
Pong is jam-packed with features! Such as:
2 Paddles
A moving dot
Floating numbers
The idea of a net
This indicator is solel

Options Max Pain Calculator [BackQuant]Options Max Pain Calculator
A visualization tool that models option expiry dynamics by calculating "max pain" levels, displaying synthetic open interest curves, gamma exposure profiles, and pin-risk zones to help identify where market makers have the least payout exposure.
What is Max Pain?
Max

Volume Profile 3D (Zeiierman)█ Overview
Volume Profile 3D (Zeiierman) is a next-generation volume profile that renders market participation as a 3D-style profile directly on your chart. Instead of flat histograms, you get a depth-aware profile with parallax, gradient transparency, and bull/bear separation, so you can see w

RiskMetrics█ OVERVIEW
This library is a tool for Pine programmers that provides functions for calculating risk-adjusted performance metrics on periodic price returns. The calculations used by this library's functions closely mirror those the Broker Emulator uses to calculate strategy performance metrics (

Simple Decesion Matrix Classification Algorithm [SS]Hello everyone,
It has been a while since I posted an indicator, so thought I would share this project I did for fun.
This indicator is an attempt to develop a pseudo Random Forest classification decision matrix model for Pinescript.
This is not a full, robust Random Forest model by any stretch o

Tick CVD [Kioseff Trading]Hello!
This script "Tick CVD" employs live tick data to calculate CVD and volume delta! No tick chart required.
Features
Live price ticks are recorded
CVD calculated using live ticks
Delta calculated using live ticks
Tick-based HMA, WMA, EMA, or SMA for CVD and price
Key tick levels (S

analytics_tablesLibrary "analytics_tables"
📝 Description
This library provides the implementation of several performance-related statistics and metrics, presented in the form of tables.
The metrics shown in the afforementioned tables where developed during the past years of my in-depth analalysis of various str

Adaptive Trend Classification: Moving Averages [InvestorUnknown]Adaptive Trend Classification: Moving Averages
Overview
The Adaptive Trend Classification (ATC) Moving Averages indicator is a robust and adaptable investing tool designed to provide dynamic signals based on various types of moving averages and their lengths. This indicator incorporates multipl

Statistics • Chi Square • P-value • SignificanceThe Statistics • Chi Square • P-value • Significance publication aims to provide a tool for combining different conditions and checking whether the outcome is significant using the Chi-Square Test and P-value.
🔶 USAGE
The basic principle is to compare two or more groups and check the results

FiniteStateMachine🟩 OVERVIEW
A flexible framework for creating, testing and implementing a Finite State Machine (FSM) in your script. FSMs use rules to control how states change in response to events.
This is the first Finite State Machine library on TradingView and it's quite a different way to think about your

See all indicators and strategies
Community trends
BUY TODAY SELL TOMORROW for 5%DON’T HAVE TIME TO MANAGE YOUR TRADES?
- Take BTST trades at 3:25 pm every day
- Try to exit by taking 4-7% profit of each trade
- SL can also be maintained as closing below the low of the breakout candle
Now, why do I prefer BTST over swing trades? The primary reason is that I have observed that
Poonawalla Fincorp (POONAWALLA)Poonawalla Fincorp Limited (NSE: POONAWALLA), a non-banking financial company (NBFC) under the Cyrus Poonawalla Group, focuses on consumer and MSME lending, including personal loans, vehicle finance, and supply chain financing. As of October 7, 2025, the stock trades around ₹565, up ~8% in the last
Powerful Setup & Art of the Pullback: Supply & Demand Concept📊 Supply & Demand View 📊
When you look closely, supply and demand zones are essentially the fingerprints of institutional activity. Big players rarely dump or buy entire positions in one shot—they stagger their trades, leaving behind identifiable imbalances on the charts. Every time price revisits
Charging Up for Wave 3 — Ola’s Motor Just Got Certified!The electric vehicle (EV) space in India is heating up again — and Ola Electric seems to be quietly positioning itself for the next leg of growth. The company’s recent government certification for its in-house ferrite motor marks an important milestone: a domestically designed motor that avoids co
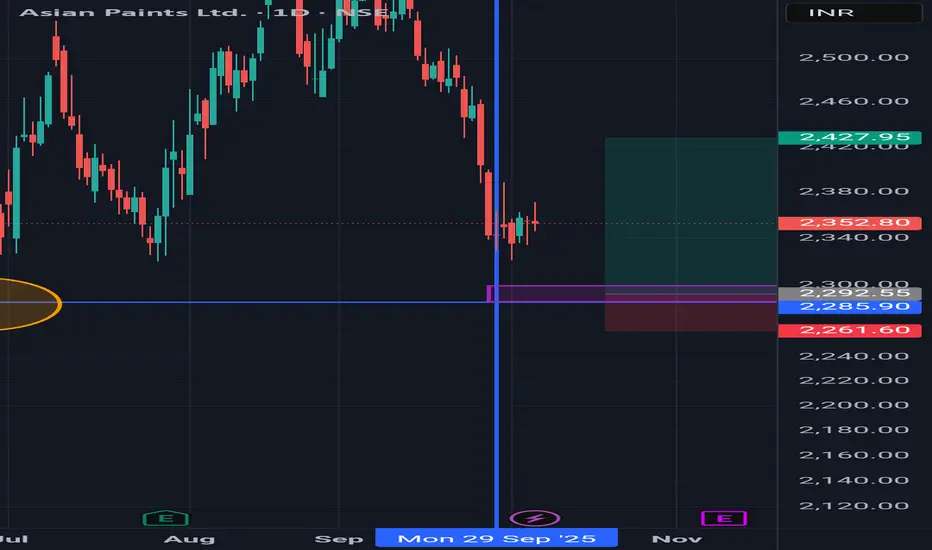
Asian Paints- Buy limit orders I don't want to write long story to describe the idea.
Simple institutional interest can push the price upside for sometime.
This is not a long term idea.
How to Identify Right Breakout Candle ? Stocks and Price actionI make educational content videos for swing / positional trading .
In this I am sharing some information out of the vast trading knowledge I have gained through my experience in the markets .
Charts used are older than 3 months

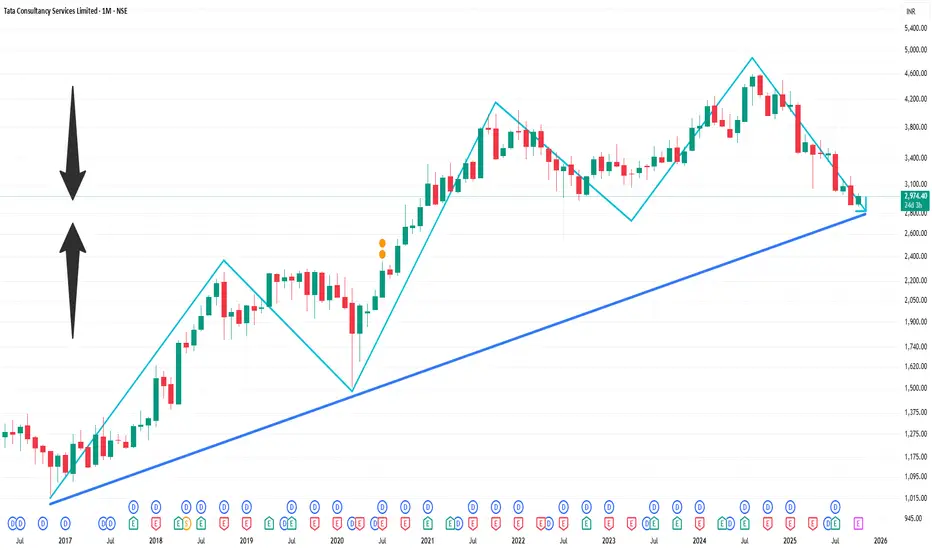
TCS 1 Month Time Frame 📉 Technical Overview (1-Month Timeframe)
Price Range: ₹2,867.55 – ₹3,202.95
Current Price: ₹2,962.
Trend: Bearish
According to TradingView, the 1-month technical analysis for TCS indicates a neutral outlook. However, moving averages suggest a strong sell signal. Oscillators are neutral, and pivo
BSE : LongThe price action shows a strong rally followed by a period of decline and consolidation.
Key horizontal support and resistance levels are marked, with the current price near the support zone, suggesting buyers are actively defending this area.
The descending trendline indicates a consistent patter

Indraprastha Medical (D) - Bullish Breakout or Bearish Reversal?Indraprastha Medical Co. is at a critical juncture, presenting conflicting signals that warrant close attention. While the long-term trend remains bullish, emerging patterns suggest a potential reversal.
The Bullish Case: Strong Momentum
The stock has been in a consistent uptrend since July 20

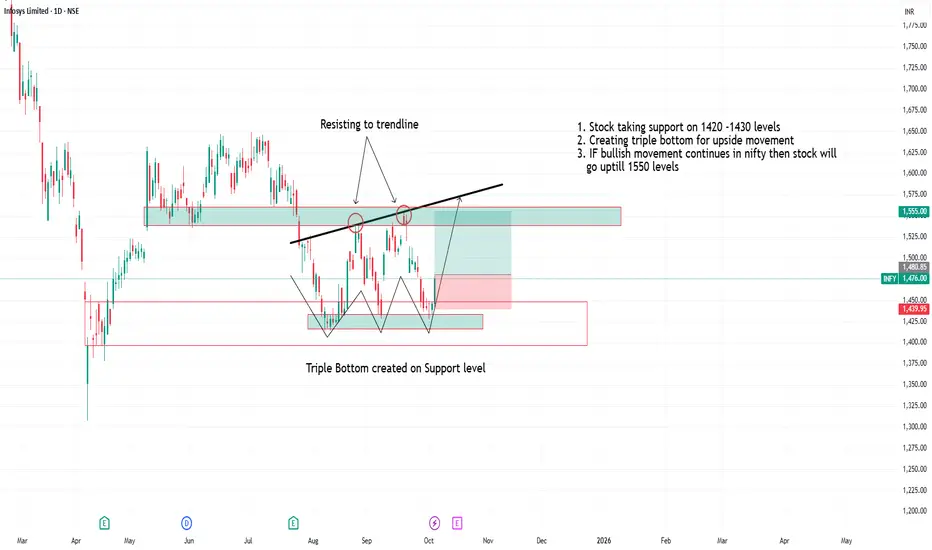
Infosys creating triple bottom on 1420-1430 level1. Stock taking support on 1420 -1430 levels
2. Creating triple bottom for upside movement
3. IF bullish movement continues in nifty then stock will
go uptill 1550 levels
See all stocks ideas
Today
AVANTELAvantel Limited
Actual
—
Estimate
—
Today
JTLINDJTL Industries Limited
Actual
—
Estimate
—
Tomorrow
TCSTata Consultancy Services Limited
Actual
—
Estimate
34.77
INR
Tomorrow
GMBREWG.M. Breweries Ltd.
Actual
—
Estimate
—
Tomorrow
IREDAIndian Renewable Energy Development Agency Ltd.
Actual
—
Estimate
1.70
INR
Oct 10
ELECONElecon Engineering Co. Ltd.
Actual
—
Estimate
—
Oct 11
DMARTAvenue Supermarts Ltd.
Actual
—
Estimate
11.13
INR
Oct 13
HCLTECHHCL Technologies Limited
Actual
—
Estimate
15.66
INR
See more events
Community trends
BTC/USD: Inside the Channel - Watch for CHoCH"BTC/USD continues to trade within this well-defined ascending parallel channel that has been in place since late September.
We've seen a strong push from the lows, bringing the price right up to the top of the channel's resistance area. The market structure is now tight.
The recent, smaller pull

ETHUSD: Where Price Could Go?4h tf
ETHUSD has bounced back strongly from around $3,826 after completing an A-B-C wave pattern. Right now, the price is testing resistance near $4,756. It could drop a little to around $4,440 before moving higher again. If the uptrend continues, the next target levels are $4,955, $5,300, and $5,5
BTCUSD - BITCOIN's Measured MoveCMP: 121000
TF: Daily
I don't trade this instrument. I am publishing this from the technical pattern perspective.
The rounding bottom target has been achieved 100% target at 122000 and since then the price is getting rejected at that level (almost three times now)..
Are we going to reject from he

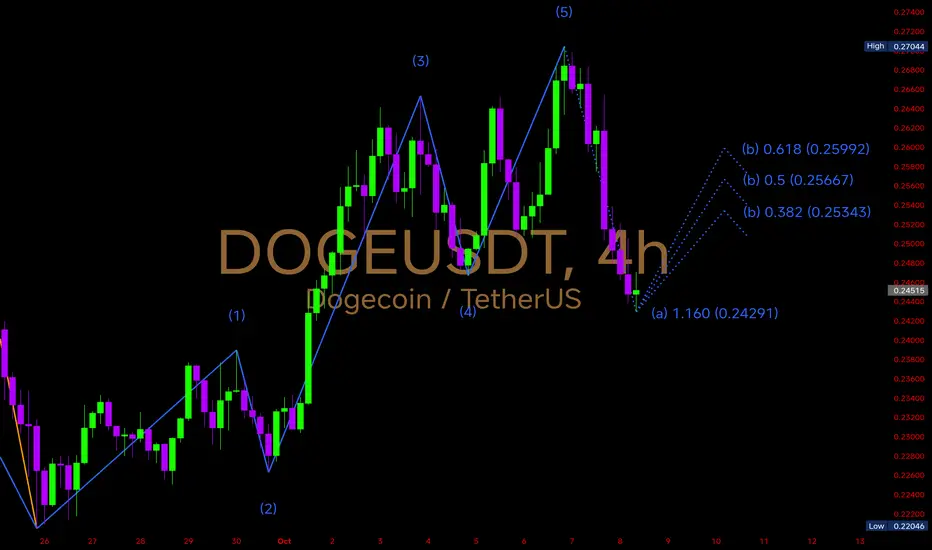
$DOGE just completed a clean 5-wave impulsive structure CRYPTOCAP:DOGE just completed a clean 5-wave impulsive structure on the 4H chart, peaking near 0.2704, and is now entering a corrective (ABC) phase.
The first leg of correction, wave (a), has extended down to 0.2429, aligning with the 1.160 Fibonacci extension, marking a potential local bottom.
LINKUSD – Waiting for Pullback to Support Before Long EntryLINK was recently rejected at resistance, and we’re now watching for a pullback to confirm support before entering a long spot trade.
🔸 Trade Setup
We are targeting a long spot entry around $21.00 – $21.50, which aligns with prior structure and potential buyer interest. This zone could provide a s

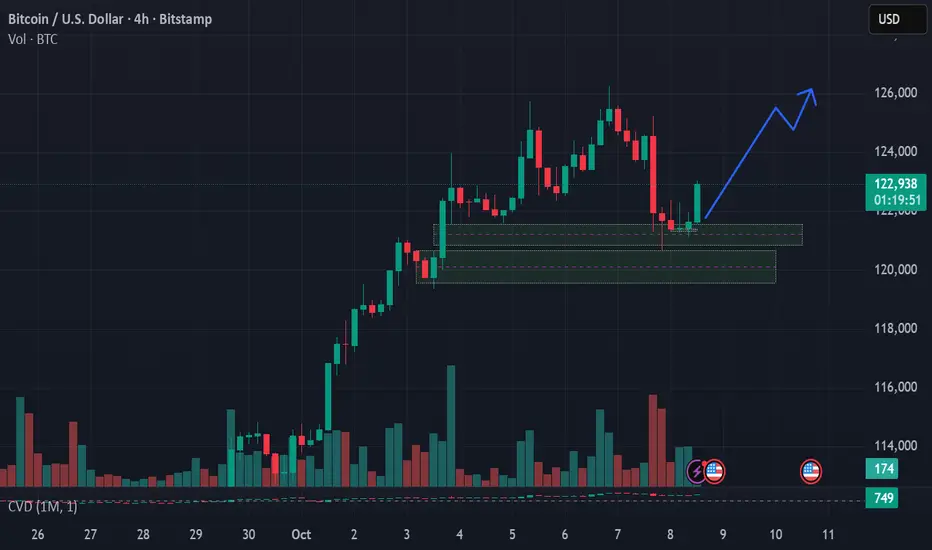
Btc is taking support after a slight dipAfter the bitcoin dip, its now taking a support from the 4H demand zone.
Target can be the ATH.
BTCUSD SHORT ON 4HAter swapping the previous inverted hammer high and forming again a inverted hammer with marubozu candle use strategy (AFTER EFFECT)

3 - Possibile Outcome on $ETHAny of these three scenarios might play out on ETH: a continuation from here, or a drop to retest the H4 FVG followed by a reversal.

BNB 400% up from our Entry People laughed when I said CRYPTOCAP:BNB will hit $2000–$3000.
but people still doubt my $2000–$3000 targets? 🤔
From 1st Entry of this bull run: +400% ( TP1 ✅ )
From $500 re-entry: +120%
You can doubt targets, but not momentum.
Just don’t forget — book profits.
Because trading without a safe zon

BTCUSD.P1D HH SWEEP and 15m IDM in 1ST OB DOWN TREND this 1D MB is UP TREND but brek to EX OB 1D
is up trend.

See all crypto ideas
Gold 7th Oct 25 AMDClassical AMD pattern in Gold on 7th Oct. Asia accumulates, London manipulates (down) , New york distributes (up)

XAUUSD – PRICE ABOVE $4000: ABSOLUTELY CRAZY FOR TRADERSXAUUSD – PRICE ABOVE $4000: ABSOLUTELY CRAZY FOR TRADERS
Gold has officially surpassed the $4000 mark, marking one of the most robust increases in recent history.
Let's take a look at the key price zones and short-term opportunities 👇
🔻 SELL Scenario
SELL 4025–4027 → SL 4033 → TP 4015 – 4000 – 398

Robust Safe Haven Flow Sends Gold Flying to $3985Dollar Index shows resilience, climbs to 98.50
Geo political unrest boosts safe haven demand.
Gold extends bullish move to $3985
Immediate Support sits at $3955
Immediate Resistance sits at $3978
Gold continues to extend prevailing bullish streak setting new record high back to back with hardly any

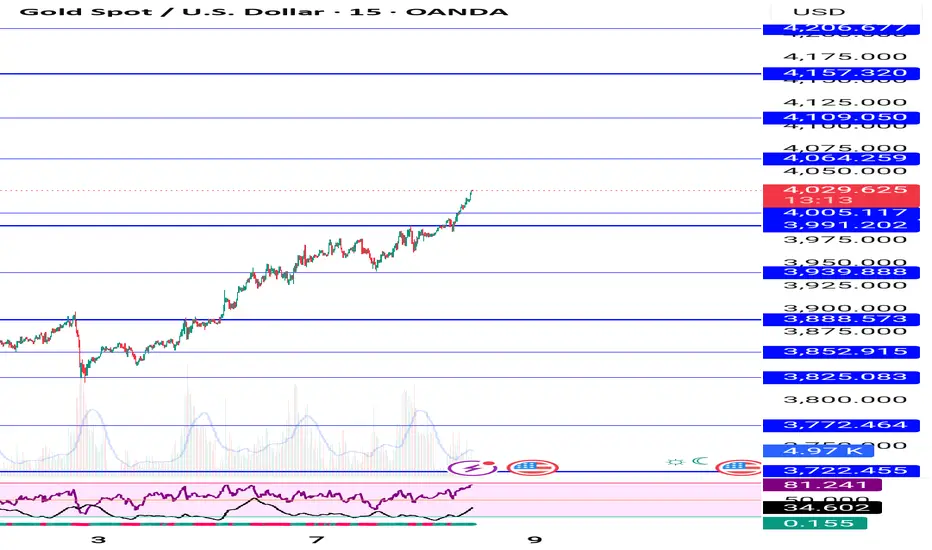
Gold 4000 $ upside target hit next target given on chart buy dipGood upside move will continue until US shutdown settlement news not come
How My Harmonic pattern projection Indicator work is explained below :
Recent High or Low :
D-0% is our recent low or high
Profit booking zone ( Early / Risky entry) : D 13.2% -D 16.1 % is
range if break them profit
gold silver momentum updategold silver momentum update---- silver sustain abv 148300 than looks sharp spike 150k near expect or if blw 147300 looks sharp dwn side 146500-145300+++--- gold abv 122700 sustain looks 124800--- already 123 told ---
spot gold sustain abv 4040 looks up side 4060--85-4100 expect in sudden spike 40

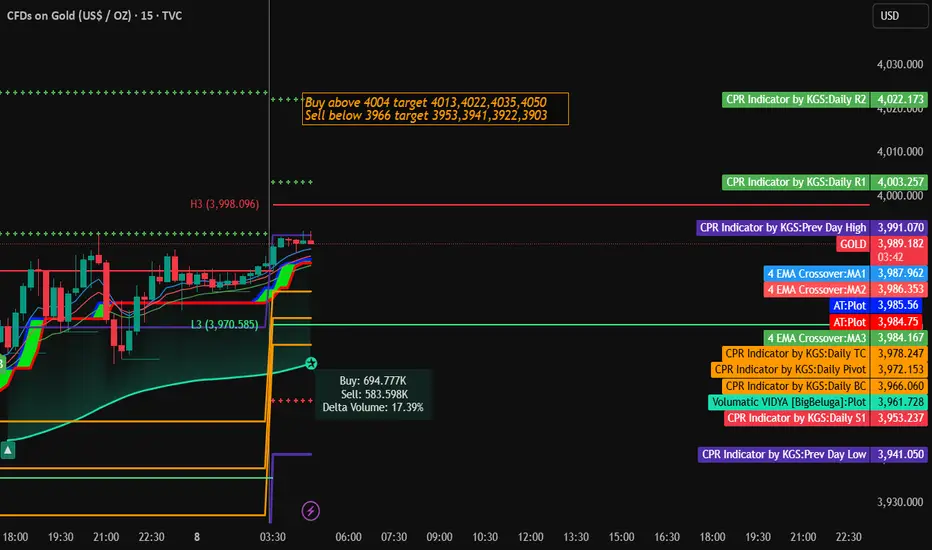
Gold Trading Strategy for 08th October 2025🟡 GOLD (XAUUSD) – INTRADAY TRADE SETUP 💰
📊 Strategy: Trade based on 5-Min Candle Breakout
🟢 BUY Setup
💵 Buy Above: High of 5-min candle closing above $4004
🎯 Targets:
1️⃣ $4013
2️⃣ $4022
3️⃣ $4035
4️⃣ $4050
🛡️ Stop Loss:
Place below the low of the previous 3 candles from the entry point.
🔴 SELL Se
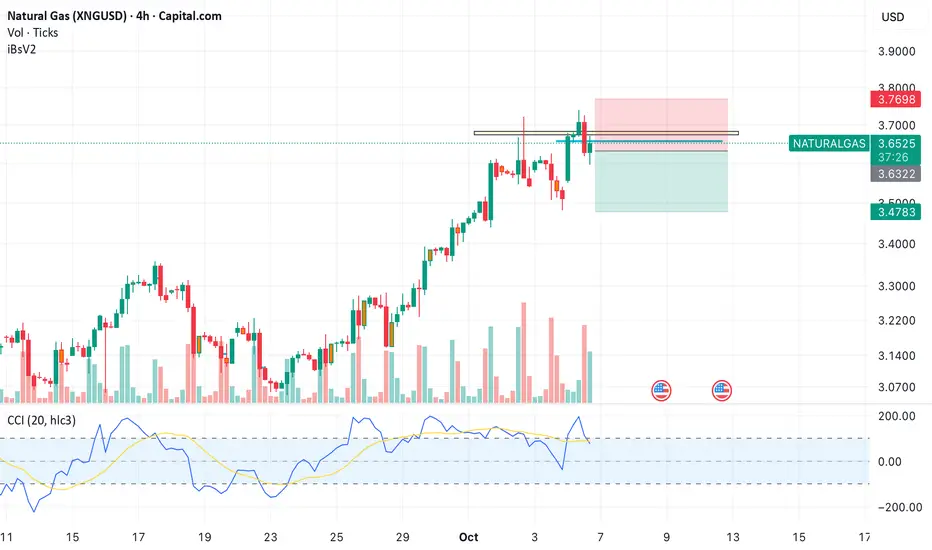
The Euphoria Before the FallThe recent price action in Natural Gas is a textbook example of short-term optimism divorced from underlying fundamentals. While traders celebrate minor weather-related demand forecasts, the broader structure tells a different story — one of excess positioning and complacency.
1. Technical Overexte
XAUUSD SHOWING A GOOD DOWN MOVE WITH 1:10 RISK REWARDXAUUSD SHOWING A GOOD DOWN MOVE WITH 1:10 RISK REWARD DUE TO THESE REASON
A. its following a rectangle pattern that stocked the marketwhich preventing the market to move any one direction now it trying to break the strong resistant lable
B. after the break of this rectangle it will boost the marke

XAU/USD | 15M | Smart Money Short SetupAfter a strong impulsive rally, price swept liquidity above the recent swing high and instantly rejected from a premium zone. A clear shift of structure confirms bearish intent, with supply perfectly aligning with imbalance fill.
🔹 Key Notes:
– Liquidity grab above previous high ✅
– Premium zone re

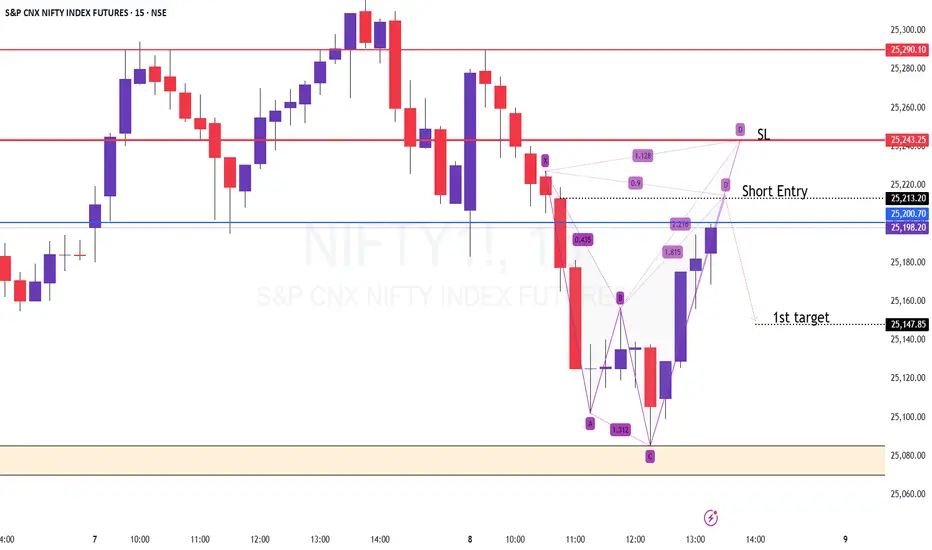
NIFTY Future - Harmonic Shark Pattern approaching PRZ - IntradayTF: 15 minutes
CMP: 25190
The Harmonic pattern formed intraday is close to the PRZ at 25210-220
One can expect 50% retracement of the CD leg (that is 25150) as the first target.
SL at 25240 in NF
Disclaimer: I am not a SEBI registered Analyst and this is not a trading advise. Views are person
See all futures ideas
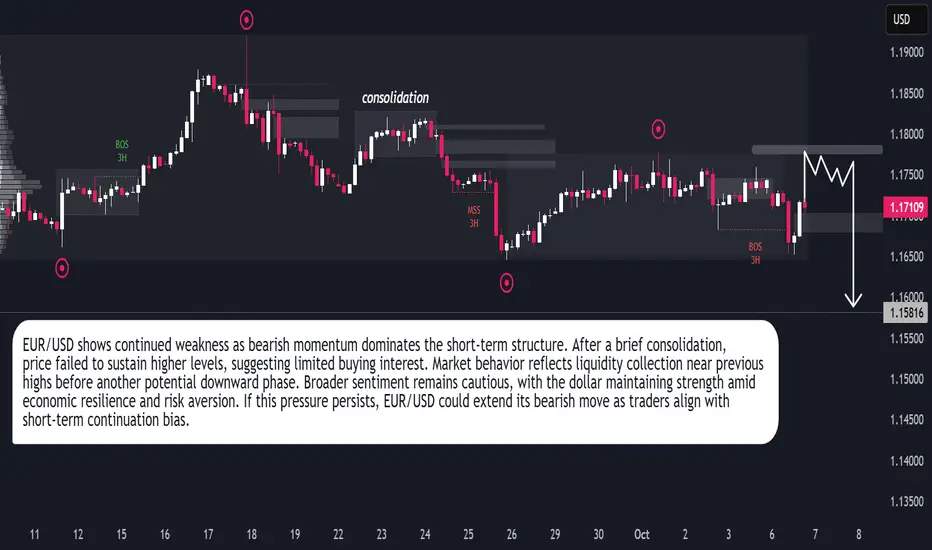
EUR/USD – Bearish Continuation in MotionEUR/USD continues to display a bearish market structure, reflecting persistent downside pressure as the euro struggles to maintain stability against the U.S. dollar. Recent price action shows a period of consolidation followed by a liquidity grab near short-term highs, indicating that buyers are los
USDCAD MULTI TIME FRAME ANALYSISHello traders , here is the full multi time frame analysis for this pair, let me know in the comment section below if you have any questions , the entry will be taken only if all rules of the strategies will be satisfied. wait for more price action to develop before taking any position. I suggest yo

AUDUSD 15M IDEAFOREXCOM:AUDUSD
Hello traders , here is the full multi time frame analysis for this pair, let me know in the comment section below if you have any questions, the entry will be taken only if all rules of the strategies will be satisfied. wait for more Smart Money to develop before taking any po

NZDJPY | Intraday Long Setup – Demand Zone Reaction StoryNZDJPY | Intraday Long Setup – Demand Zone Reaction Story 📈
After a strong upward rally, NZDJPY faced sharp rejection from the recent highs near 88.30, triggering a quick retracement. But rather than chasing the move, I waited patiently for price to approach a key demand zone, where smart money is

EURUSD - SELL SETUP EURUSD – Clean SELL Setup Ahead 🧠📉
📍 Bias: Short
📍 Pair: EUR/USD
🕒 Timeframes: 1H | 4H | Daily | Weekly
🧭 Multi-Timeframe Outlook
EURUSD is showing bearish structure on the 4H and 1H, while the Daily and Weekly remain bullish — giving us a potential short-term corrective opportunity.
At the same tim

Double Bottom, EJEURJPY froming double bottom, for personal future use, not a financial advice, dont trade according to my setup,fjdh ufbrj fifhfb didurur didhbti rirhrbri dirhrbr fjrbr rjrbr rjr rjr rj fidh

See all forex ideas
| - | - | - | - | - | - | - | - | ||
| - | - | - | - | - | - | - | - | ||
| - | - | - | - | - | - | - | - | ||
| - | - | - | - | - | - | - | - | ||
| - | - | - | - | - | - | - | - | ||
| - | - | - | - | - | - | - | - | ||
| - | - | - | - | - | - | - | - | ||
| - | - | - | - | - | - | - | - | ||
| - | - | - | - | - | - | - | - |
Trade directly on the supercharts through our supported, fully-verified and user-reviewed brokers.


