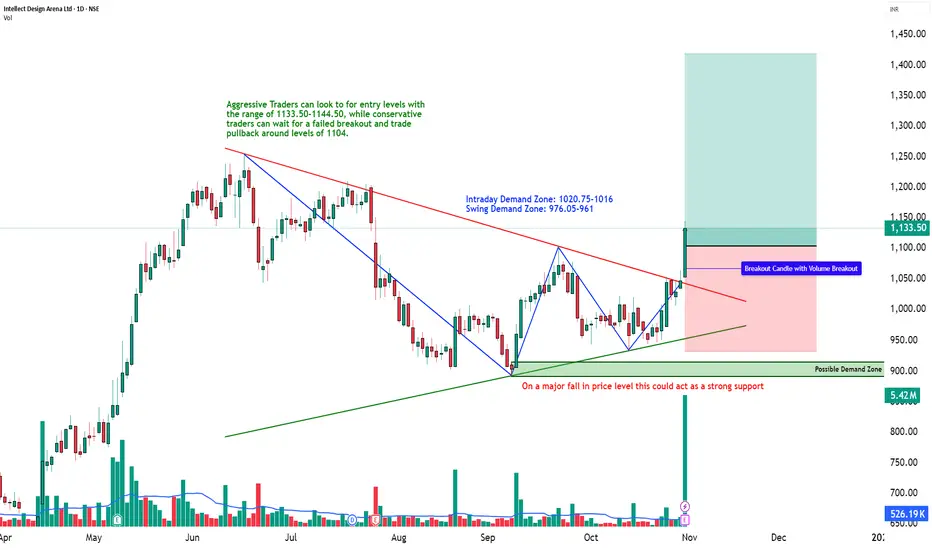
Descending Triangle Breakout with Institutional Volume | STWP💹 Intellect Design Arena Ltd (NSE: INTELLECT)
Sector: IT – FinTech Solutions | CMP: ₹1,133.50 | View: Bullish Momentum Breakout Setup
📊 Price Action:
Intellect Design Arena has delivered a strong bullish breakout from its multi-month descending trendline, marking a structural shift from a consolida

The best trades require research, then commitment.
Get started for free$0 forever, no credit card needed

Scott "Kidd" PoteetThe unlikely astronaut

Where the world does markets
Join 100 million traders and investors taking the future into their own hands.
NIFTY Breakout Retest — Bulls Getting ReadyNIFTY appears to be forming a classic Cup and Handle pattern, a strong bullish continuation setup. Recently, the index successfully broke out above the handle resistance zone, confirming the pattern’s validity. Currently, it is pulling back to retest the breakout level, which often serves as a healt

USD-JPY is in a Bullish PatternUSD-JPY is about to Break the Pattern . In 30 Min TF it is Trading in in a FLAT-TOP pattern and also it shows a Flag & Pole pattern and Both are Bullish Patterns . This type of pattern may give the Breakout on either side.

vaibhav global good support made around 180 levels and lot of consolidation in tight range now seeing weekly breakout and strong close above downvtrendline a big move can be seen in next 2-3 quarters towards 500 .this view fails if price monthly start closing below 180 levels .

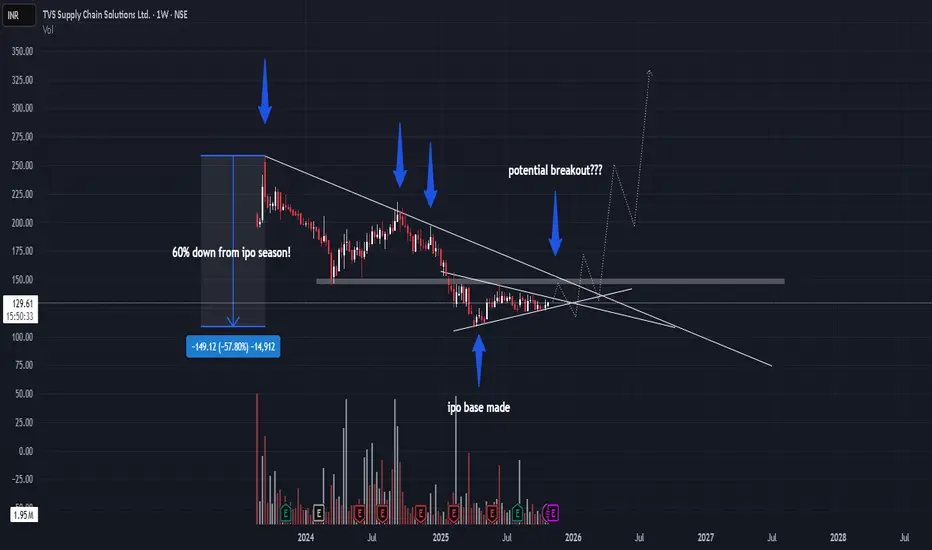
potential multibagger? TVSSCS buy trigger above 150 level
holding for more than 2-3years
hoping TVSSCS is going to be 2-3x
TVS SCS (TVS Supply Chain Solutions) is from the TVS Group, which also includes TVS Motor Company. Both companies are part of the larger TVS Mobility Group, and TVS Motor Company has increased its stake i
Indraprastha Medical Ltd | Bullish Flag Breakout | Swing SetupCompany Overview (Fundamental)
Indraprastha Medical Corporation Ltd (IMCL) operates under the Apollo Hospitals Group and manages the Indraprastha Apollo Hospital, New Delhi — one of India’s largest multi-specialty hospitals. Company financially strong, consistent profitability, improving margins,

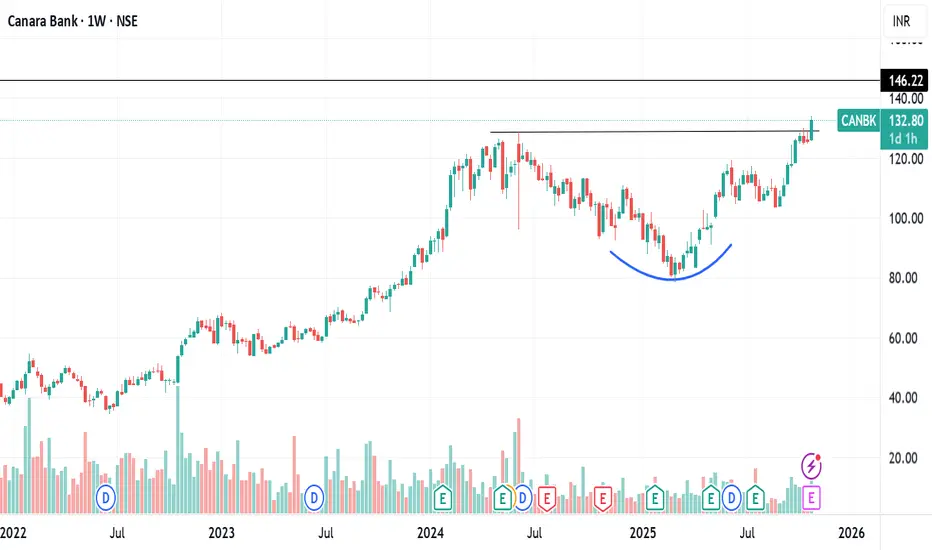
CANARA BANK ROUNDING BOTTOM BREAKOUTCanara bank breaking rounding bottom weekly
with huge volume this week
RSI above 60 bullish
heading towards 15 yr high
q2 net profit rises 19% +ve
target 146 then can lead to ATH 164 also
NO BUY/SELL RECOMENDATION
VEDLStrong Breakout Candidates!
#VEDL
1- Bottom Formation bo.
2- Uptrend is Still Intact
3- Trading above all key moving averages
Keep on Radar.
Potential Upside Stocks!
#Disclaimer: View shared it for educational purposes only.
Follow for more upcoming charts.

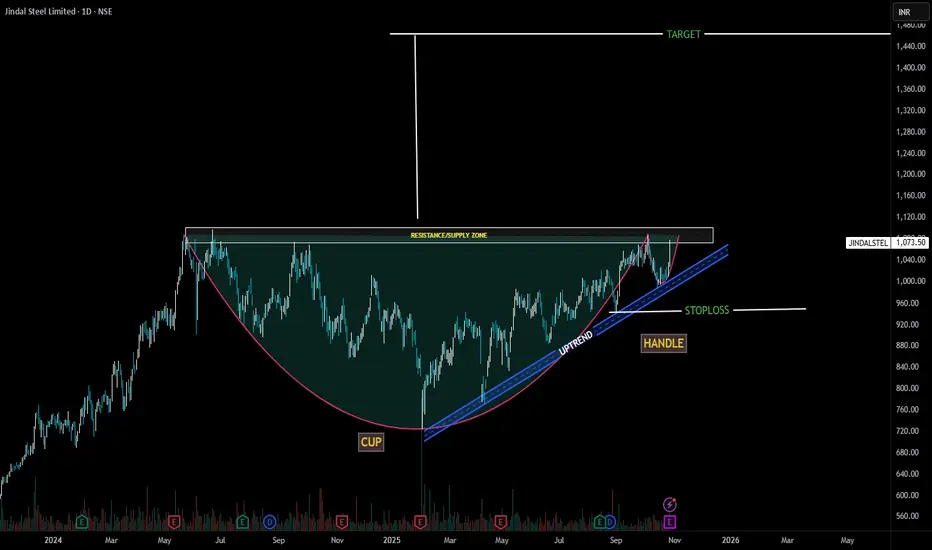
JINDAL STEEL LIMITEDCup Formation:
The left side shows a clear decline followed by a rounded bottom and a steady recovery forming a "U" shape — ✅ valid cup structure.
Volume tends to decrease during the cup and increase on the right side — which seems consistent here.
Handle Formation:
The handle is shorter in dura
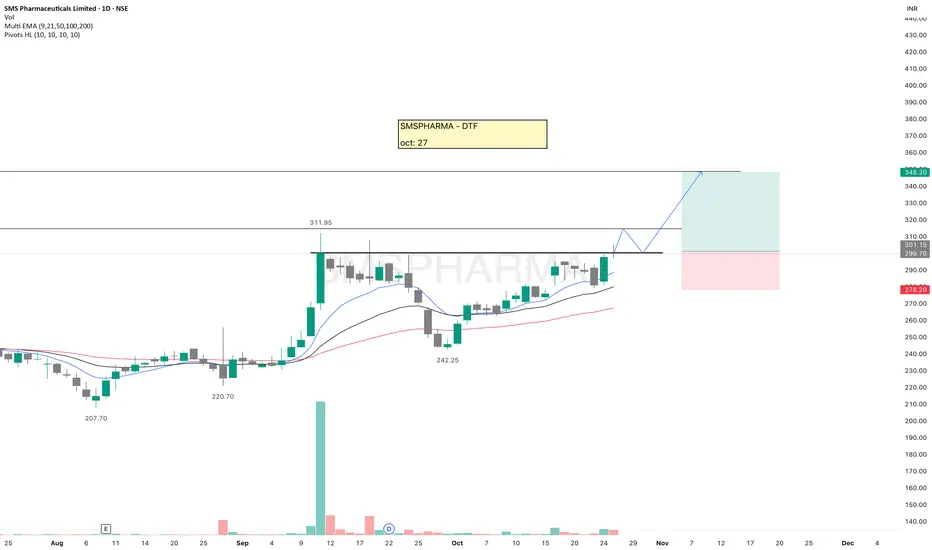
SMSPHARMASMSPHARMA is looking strong and forming a bullish structure. A breakout from the current level can lead to a good upside move.
Even while paper trading, always use a stop-loss, it builds the right trading habit.
Keep this stock on your watchlist.
✅ If you like my analysis, please follow me here
See all editors' picks ideas
LogNormalLibrary "LogNormal"
A collection of functions used to model skewed distributions as log-normal.
Prices are commonly modeled using log-normal distributions (ie. Black-Scholes) because they exhibit multiplicative changes with long tails; skewed exponential growth and high variance. This approach i

Range Oscillator (Zeiierman)█ Overview
Range Oscillator (Zeiierman) is a dynamic market oscillator designed to visualize how far the price is trading relative to its equilibrium range. Instead of relying on traditional overbought/oversold thresholds, it uses adaptive range detection and heatmap coloring to reveal where pri

Volume Surprise [LuxAlgo]The Volume Surprise tool displays the trading volume alongside the expected volume at that time, allowing users to spot unexpected trading activity on the chart easily.
The tool includes an extrapolation of the estimated volume for future periods, allowing forecasting future trading activity.
🔶 U

Smooth Theil-SenI wanted to build a Theil-Sen estimator that could run on more than one bar and produce smoother output than the standard implementation. Theil-Sen regression is a non-parametric method that calculates the median slope between all pairs of points in your dataset, which makes it extremely robust to o

Fair Value Gaps by DGTFair Value Gaps
A refined, multi-timeframe Fair Value Gap (FVG) detection tool that brings institutional imbalance zones to life directly on your chart.
Designed for precision, it visualizes how price delivers into inefficiencies across chart, higher, and lower (intrabar) timeframes — offering a fl

TASC 2025.11 The Points and Line Chart█ OVERVIEW
This script implements the Points and Line Chart described by Mohamed Ashraf Mahfouz and Mohamed Meregy in the November 2025 edition of the TASC Traders' Tips , "Efficient Display of Irregular Time Series”. This novel chart type interprets regular time series chart data to create an ir

Simplified Percentile ClusteringSimplified Percentile Clustering (SPC) is a clustering system for trend regime analysis.
Instead of relying on heavy iterative algorithms such as k-means, SPC takes a deterministic approach: it uses percentiles and running averages to form cluster centers directly from the data, producing smoo

Adaptive Volume Delta Map---
📊 Adaptive Volume Delta Map (AVDM)
What is Adaptive Volume Delta Map (AVDM)?
The Adaptive Volume Delta Map (AVDM) is a smart, multi-timeframe indicator that visualizes buy and sell volume imbalances directly on the chart.
It adapts automatically to the best available data resolution

Dynamic Equity Allocation Model"Cash is Trash"? Not Always. Here's Why Science Beats Guesswork.
Every retail trader knows the frustration: you draw support and resistance lines, you spot patterns, you follow market gurus on social media—and still, when the next bear market hits, your portfolio bleeds red. Meanwhile, institution

First Passage Time - Distribution AnalysisThe First Passage Time (FPT) Distribution Analysis indicator is a sophisticated probabilistic tool that answers one of the most critical questions in trading: "How long will it take for price to reach my target, and what are the odds of getting there first?"
Unlike traditional technical indicators

See all indicators and strategies
Community trends
vaibhav global good support made around 180 levels and lot of consolidation in tight range now seeing weekly breakout and strong close above downvtrendline a big move can be seen in next 2-3 quarters towards 500 .this view fails if price monthly start closing below 180 levels .
Descending Triangle Breakout with Institutional Volume | STWP💹 Intellect Design Arena Ltd (NSE: INTELLECT)
Sector: IT – FinTech Solutions | CMP: ₹1,133.50 | View: Bullish Momentum Breakout Setup
📊 Price Action:
Intellect Design Arena has delivered a strong bullish breakout from its multi-month descending trendline, marking a structural shift from a consolida
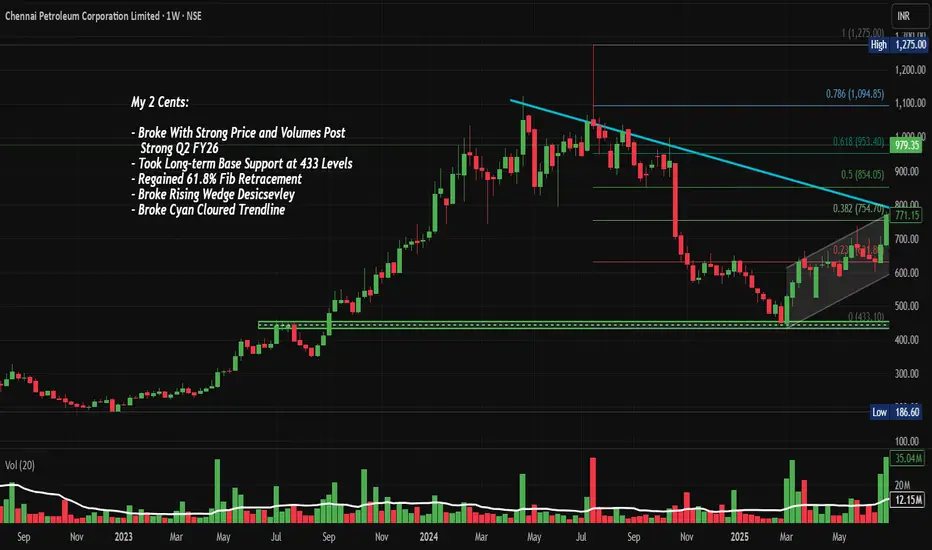
ChennaiPetro: Wedge & Trendline BO with 61.8%, Chart of the WeekNSE:CHENNPETRO Explosive Breakout: Why This Refinery Stock Could Rally Another 30% After Its Q2 Turnaround. This PSU Refinery Stock Broke Through ₹979 Levels - Here's What Traders Need to Know About the Next Move. Let's Analyse in our Chart of the Week Below.
As per the Latest SEBI Mandate, this
Understanding Grindwell Norton’s Long-Term Technical StructureGrindwell Norton’s long-term technical setup offers a valuable learning opportunity in trendline analysis and RSI behavior—ideal for learners exploring price action and momentum indicators.
Understanding Grindwell Norton’s Long-Term Technical Structure
Grindwell Norton Limited (NSE: GRINDWELL), cur

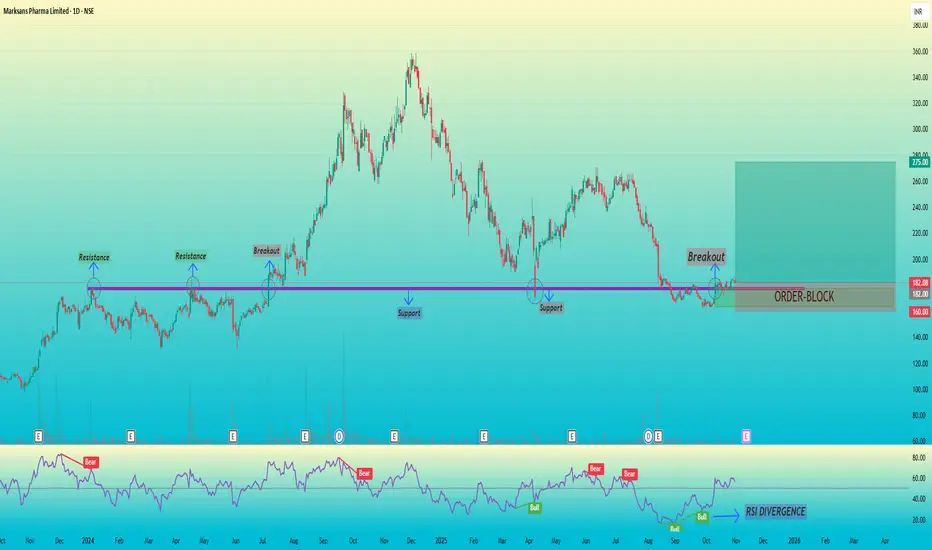
Marksans Pharma – Key Level Reclaimed After False Breakdown📊 Technical Overview
Timeframe: 1D (Daily)
MARKSANS PHARMA LIMITED
The zone around ₹175–₹180 earlier acted as a strong resistance (multiple rejections in early 2024 to mid-2024).
After breakout this same level flipped into support, confirming a clear demand zone.
Recently, the stock broke below
ACC stocks consolidated at previous support zone and Nice price.ACC price is corrected and consolidate at support zone. The opportunity create the level of after 1960 and target is 2700

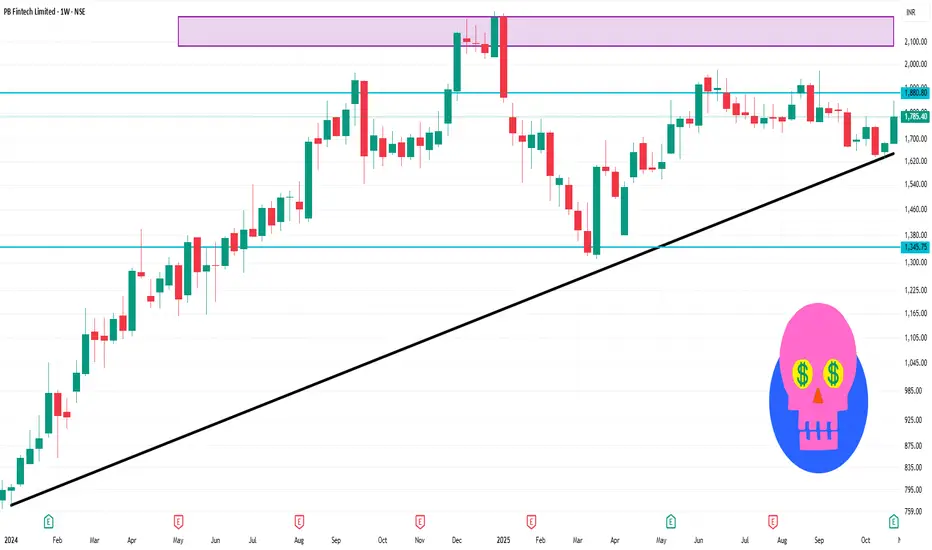
POLICYBZR 1 Week Time Frame 📊 Key levels & structure
Based on current weekly chart readings, recent pivot data and visible support/resistance zones:
Resistance zone: ~ ₹1,775-1,825 — price has been tested around this area, acting as a cap.
Support zone: ~ ₹1,650-1,620 — key lower bounds that have held in recent pullbacks.
Bhel Buy for target of 280 and 300Dear Traders,
NSE:BHEL
I’d like to share a technical perspective on the recent price action, which appears to present two possible scenarios: either an ABC corrective pattern or the beginning of a new impulsive wave.
📈 Scenario 1: Flat Correction (3-3-5)
- The up move from 176 on 3rd March 202

CANARA BANK MONTHLY BREAKOUTCANARA BANK MONTHLY BREAKOUT
Technical indicators and trend analysis are showing the scrip is bullish. Also usually monthly breakouts are sustainable for going long.
Kindly do your analysis as well.

PAYTM LONG TERM INVESTING IDEAPAYTM on weekly chart has now stopped falling further and now consolidating on the lower levels.
Current price level is good to enter and we can add further at around 450 level.
Stop loss can be put around 400 or trail using 20/50 EMA.
This is a LONG term and a bit risky bet but if you have fait

See all stocks ideas
Tomorrow
TBOTEKTBO Tek Ltd.
Actual
—
Estimate
5.76
INR
Tomorrow
ARVSMARTArvind SmartSpaces Ltd.
Actual
—
Estimate
—
Tomorrow
N
NAZARANazara Technologies Ltd.
Actual
—
Estimate
−0.09
INR
Tomorrow
ARIHANTSUPArihant Superstructures Limited
Actual
—
Estimate
—
Tomorrow
POWERGRIDPower Grid Corporation of India Limited
Actual
—
Estimate
4.35
INR
Tomorrow
AMBUJACEMAmbuja Cements Limited
Actual
—
Estimate
2.71
INR
Tomorrow
PFIZERPFIZER LIMITED
Actual
—
Estimate
42.60
INR
Tomorrow
RUSTOMJEEKeystone Realtors Ltd.
Actual
—
Estimate
—
See more events
Community trends
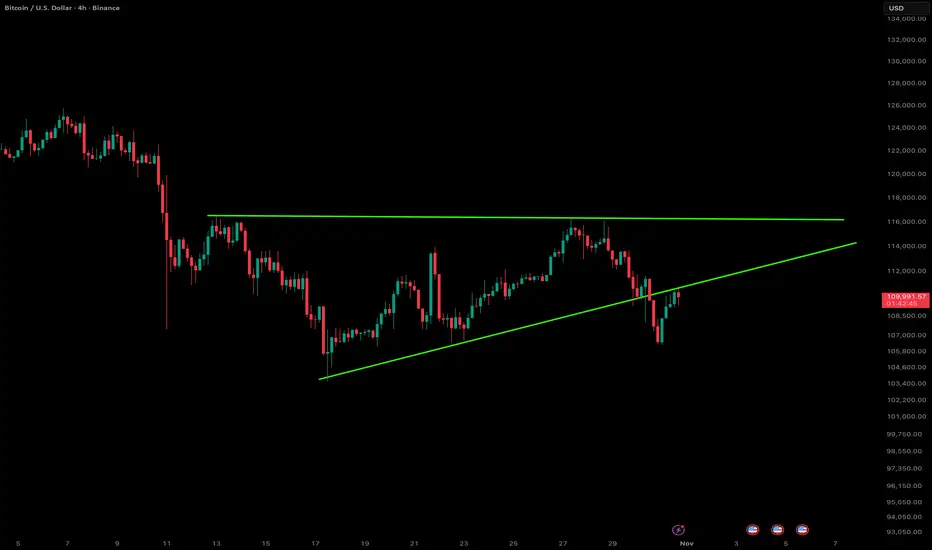
Bitcoin – Breakdown from the Ascending TriangleBitcoin just slipped below the ascending triangle support on the 4-hour chart, signaling a potential shift in short-term momentum. The structure had been forming higher lows toward the $115K resistance zone, but sellers stepped in hard near the top, breaking the trendline that’s been guiding the upt
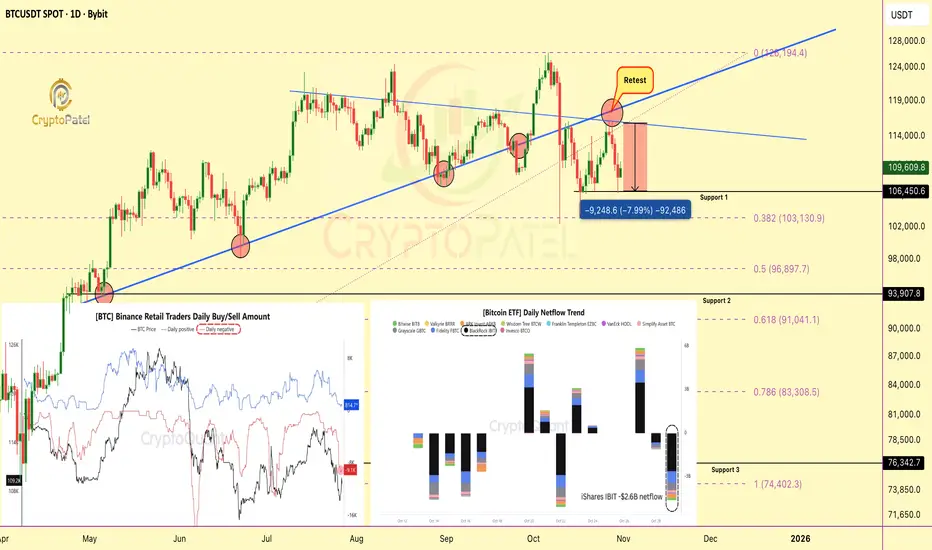
Retail Panic Meets ETF Outflows: $1B Bitcoin Sell-Off Hits MarkeRetail Panic Meets ETF Outflows: $1B Bitcoin Sell-Off Hits Markets
Bitcoin saw renewed selling pressure on Oct 30, as Binance retail traders dumped over 9,200 BTC (~$1B) around $107.7K, just days after another 12,000 BTC sell wave near $108.3K.
Technical View:
Retail traders are aggressively selli
Best Intraday SET UP for BTC for today Optimal trading strategy for Bitcoin today.
Initiate a long position above the 110,463 level, targeting 111,597. Conversely, should resistance be encountered near 110,227, anticipate a downward price movement, with a target of 108,759. Furthermore, consider short positions below 109,804 due to a bre

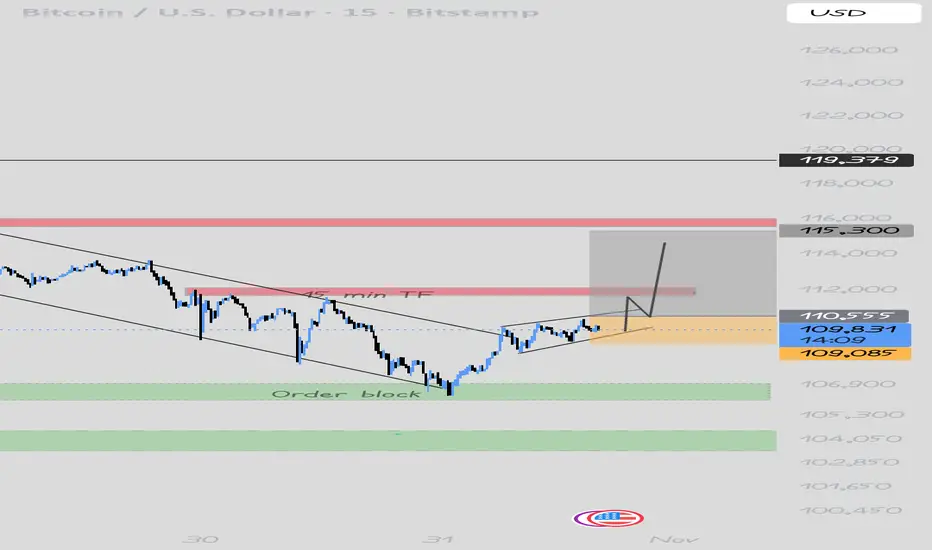
Btc current chart structure btc test the support at 106550 cBtc consolidated in 15 min TF around 110000 to 109000 and break this zone my target is 115000 previous resistance i look for
Swing according to 1 hour TF
This financial advice this is only my opinion my thoughts keep do your own anylise
Solana Price Action Turns BearishSolana’s market structure shows a gradual weakening of bullish momentum after an extended upward phase earlier in the month. The asset experienced a breakout that temporarily fueled optimism among traders, but recent sessions indicate a loss of strength as sellers began to dominate. The volume profi

BtcThis chart shows BTC/USDT on the H1 timeframe analyzed using the Kumo-Only v2.2 system.
Price is currently testing the Kumo cloud area with RSI staying above 50, suggesting potential bullish continuation.
Key levels: Cloud top and bottom, recent swing high/low.
Trade plan: Target 1.5R, stop lo

#btc next move what i want and next tp of #btc is 175k#btc next move what i want and next tp of #btc is 175k
#btc next move what i want and next tp of #btc is 175k
vv
#btc next move what i want and next tp of #btc is 175k#btc next move what i want and next tp of #btc is 175k

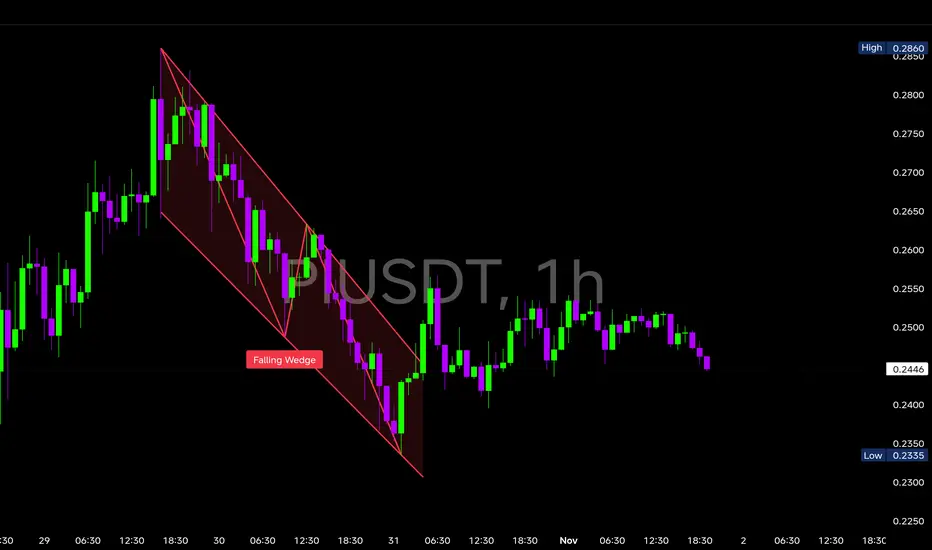
$PI is showing a Falling Wedge on the 1H chart NASDAQ:PI is showing a Falling Wedge on the 1H chart
🔹 Key Support Zones
$0.243 – $0.245: Wedge support zone (critical defense).
$0.235: Extended downside if pattern fails.
🔹 Resistance Zones
$0.252: Wedge breakout level.
$0.260: Next immediate resistance after breakout.
$0.275 – $0.280: T
Weekly & Daily BTC analysis of 10R Opportunity........On HTF weekly and daily BTC is forming good scenarios for bearish trade. Price is consolidating at higher levels for last couple of weeks and showing value adjustment in BTC. Price already shot up a lot and we may see a short term pull back.
1. BTC has created CISD after taking liquidity at weekly

Best area off value for selling ofter some selling price actionBest area off value for selling ofter some selling

See all crypto ideas
XAUUSDGold is approaching supply zone. From there it can fall to sweep sell side liquidity.
Then again continue to push up from Demand as soon as we get confirmation

XTIUSD - Analysis
Trends:
* Weekly: Strong bearish structure — lower highs from 84–86; price now inside 59–57 support area.
* Daily: Bearish continuation within 66 → 57 range; momentum still down.
* 4H/1H: Rejected from 61.0–61.3 resistance; structure confirms fresh downside move.
*LSupport & Resistance:
* *Resista

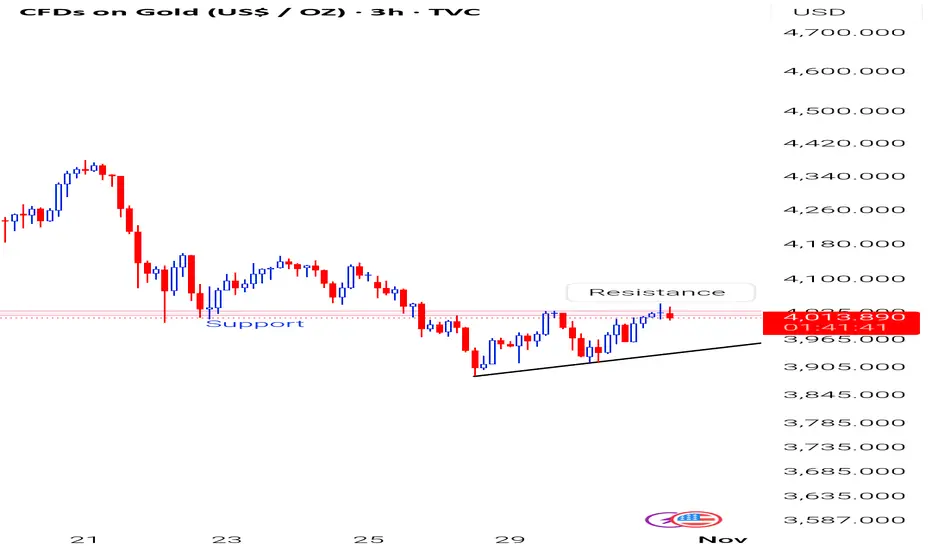
Gold Continues to Struggle at 4000We're seeing a familiar story play out in gold as it makes multiple attempts to reclaim and hold above the 4000 level, but none of these efforts are showing the conviction we need to see from buyers. The price action on the hourly chart is particularly telling ,we're witnessing similar structural pa

XAUUSDTrading is easy, but trading with convection is only possible after you have 5-6 years of experience trading in every market.
It is this experience that can tell you how high the market can go, if you are tracking the stock correctly, and only then can you estimate how much profit booking can happen

XAU/USD – Gold Eyes 4,100$ as Safe-Haven Demand Holds Firm🔍 Market Context
Gold continues to attract buyers for the second consecutive day, as renewed safe-haven demand supports a modest recovery from last week’s lows near 3,890$.
While the Fed’s hawkish stance keeps the Dollar firm, concerns over a prolonged US government shutdown and weaker macro sentim

LiamTrading - XAUUSD: Outlook $5,000 USD and Priority BUY... LiamTrading - XAUUSD: Outlook $5,000 USD and Priority BUY Strategy at POC $3973
Hello traders community,
Gold is positioned between an extremely optimistic long-term outlook (forecast $5,000 USD in the next 12-18 months by Bank of America) and short-term technical adjustments.
Although Gold has br

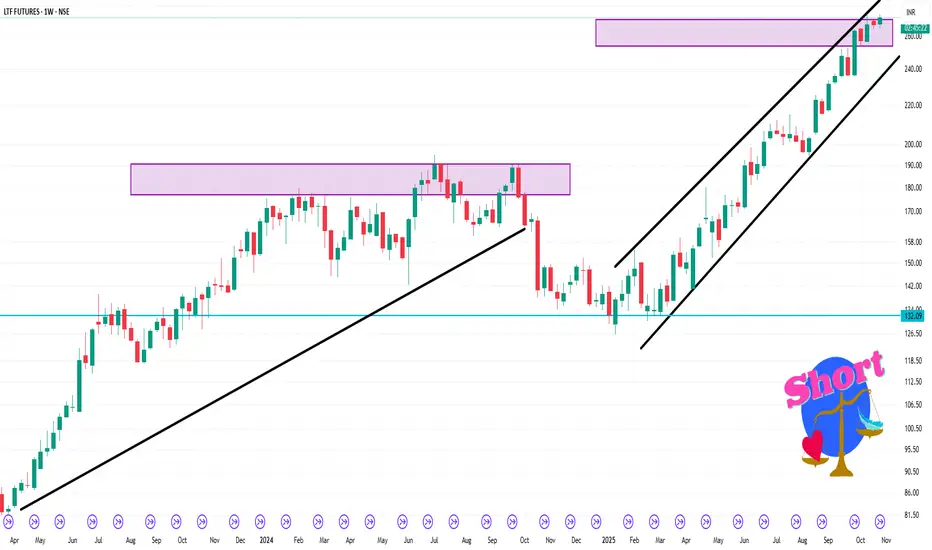
LTF 1 Week Time Frame ✅ Key Levels to Watch
Support around ₹ 265-270, which has been noted as a level where price “is above … and as long as price remains above this level, the up-trend … might continue.”
Current futures price in the recent contract is approximately ₹ 271-273.
A potential upside breakout target (if mom
Xauusd TradePrice has just touched my entry zone and trade is active. Now staying patient and focused — will hold until it reaches the target zone. Trusting the setup, not emotions 💪✨

Gold Trading Strategy for 31st October 2025📈 TVC:GOLD TRADING PLAN (31 OCT 2025)
💰 BUY SETUP:
➡️ Enter GETTEX:BUY above the high of the 1-hour candle — only after candle closes above $4063
🎯 Target Levels:
1️⃣ $4073
2️⃣ $4083
3️⃣ $4095
🛡️ Stop Loss: Low of the breakout candle or as per your risk appetite
📊 Confirm with strong bullish

Gold : if fails to hold recent high 4046 then be ready for Gold taken resistance at previous support which is very crucial juncture. Expecting a sharp fall in coming day is ready .. here RR is favourable in terms of seller .
Check your set-up .
# No recommendation
See all futures ideas
USD-JPY is in a Bullish PatternUSD-JPY is about to Break the Pattern . In 30 Min TF it is Trading in in a FLAT-TOP pattern and also it shows a Flag & Pole pattern and Both are Bullish Patterns . This type of pattern may give the Breakout on either side.
GBPCHF - CORRECTION NEAR EXHAUSTION?Symbol - GBPCHF
GBPCHF continues its corrective move, forming lower lows amid ongoing macroeconomic uncertainty and concerns related to US policy. GBPCHF remains within a bearish structure but is now approaching a key demand zone around 1.0555 – 1.0530, where buying interest could potentially emerg

USDCHF MULTI TIME FRAME ANALYSISHello traders , here is the full multi time frame analysis for this pair, let me know in the comment section below if you have any questions , the entry will be taken only if all rules of the strategies will be satisfied. wait for more price action to develop before taking any position. I suggest yo

USDCAD - SELLUSDCAD SELL 🔴
Setup: P Line + SH (Capwave 1Hr)
Confirmations:
✅ 1Hr Capwave resistance
✅ Session High + Yesterday's Daily High confluence
Bias: Bearish rejection from key zone. Watching for continuation lower.

GBPJPY for next Month -> 28 OctI'm expecting the price to move higher in GJ. there might be some pull back as well but expecting a long for long term.

Buy Trade - AUD/CADGreetings to everyone!
You can place a buy trade on AUD/CAD and check out my chart for the ideal entry, stop-loss & target placement.
Remember :-
* Move your SL to breakeven once the trade reaches 1:1 R.
* Aim for a minimum reward of 1:1.5 R.
* Don't risk more than 3% of your total margin.

AUD/USD (3H)...AUD/USD (3H) chart, here’s a breakdown of what I see and how the target can be projected:
---
🧠 Pattern Analysis
My identified a Cup and Handle pattern, which is a bullish continuation setup.
Cup low: around 0.6450
Cup rim (resistance / breakout level): around 0.6580 – 0.6590
Current price: ~

EURUSD 1H - LONGFX:EURUSD
Hello traders , here is the full multi time frame analysis for this pair, let me know in the comment section below if you have any questions, the entry will be taken only if all rules of the strategies will be satisfied. wait for more Smart Money to develop before taking any position

EURJPY Short Idea_Elliott waveI'm considering a bearish position on the EURJPY pair, with a strict stop-loss set at 178.25. Please conduct your own research before taking any trade.

See all forex ideas
| - | - | - | - | - | - | - | - | ||
| - | - | - | - | - | - | - | - | ||
| - | - | - | - | - | - | - | - | ||
| - | - | - | - | - | - | - | - | ||
| - | - | - | - | - | - | - | - | ||
| - | - | - | - | - | - | - | - | ||
| - | - | - | - | - | - | - | - | ||
| - | - | - | - | - | - | - | - | ||
| - | - | - | - | - | - | - | - |
Trade directly on the supercharts through our supported, fully-verified and user-reviewed brokers.


