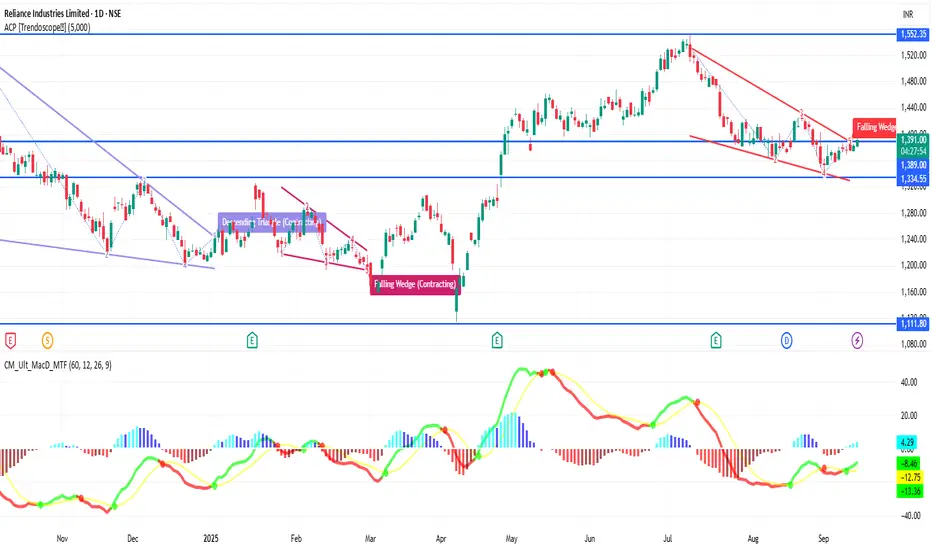
RELIANCE 1D Time frame🔢 Current Level
RELIANCE is trading around ₹1,391 – ₹1,392
🔑 Key Resistance & Support Levels
Resistance Zones:
₹1,392 – ₹1,396 (near-term resistance; breakout above this may lead to further upside)
₹1,400 (psychological resistance)
₹1,427 (stronger resistance above)
Support Zones:
₹1,380 – ₹

The best trades require research, then commitment.
Get started for free$0 forever, no credit card needed

Scott "Kidd" PoteetThe unlikely astronaut

Where the world does markets
Join 100 million traders and investors taking the future into their own hands.
Major indices
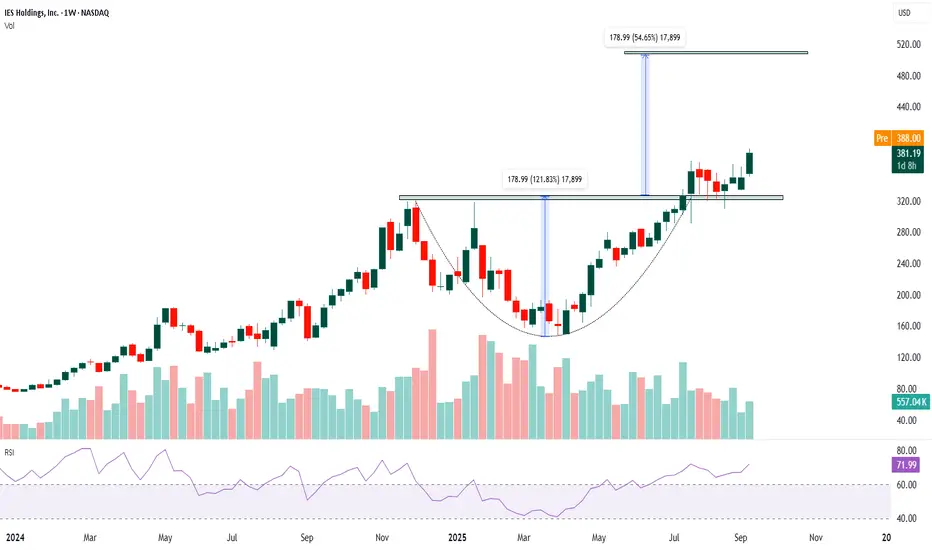
IESC- Long The chart shows a clear uptrend over the past year.
Price formed a rounded bottom (cup-shaped base) and has broken above the neckline near $320–$330, confirming a bullish continuation pattern. Current price around $381 indicates sustained bullish strength.
Volume rose meaningfully during the breakou
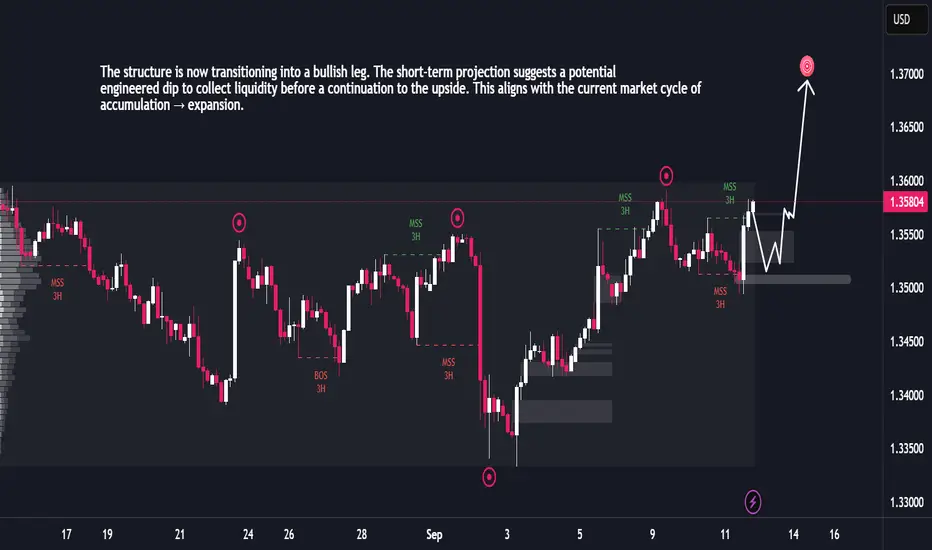
GBPUSD Ready for Expansion After Liquidity GrabThe market has been trading within a broad range, characterized by multiple liquidity grabs on both highs and lows. Each sweep has been followed by sharp reactions, confirming active smart money positioning. Recent price action shows a strong recovery after a downside liquidity sweep, indicating acc
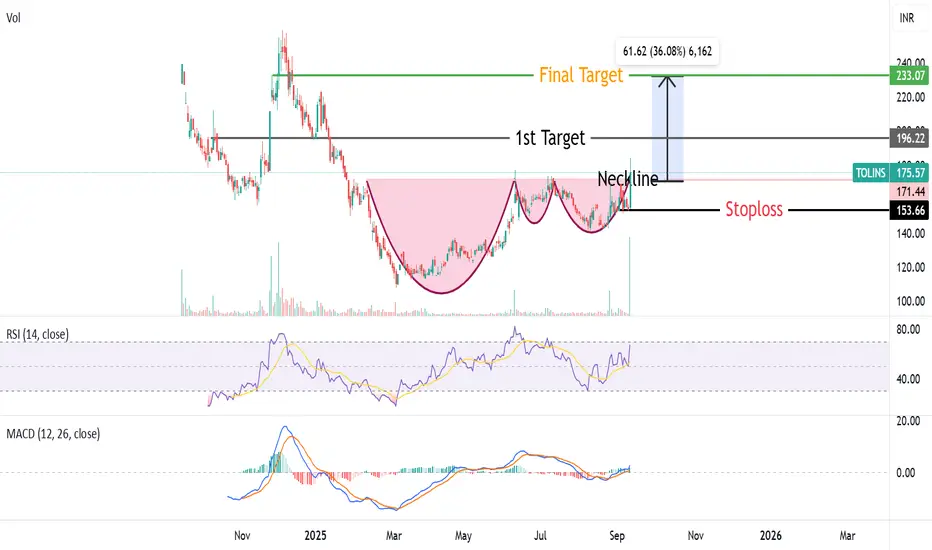
Complex Cup & Handle Pattern Breakout in TOLINS TyresTolins Tyres given Complex Cup & Handle Pattern Breakout from neckline arround 170 level. RSI & MACD also showing positive momentum ,Stock also trading above all important moving averages(50,10,200).Target of this breakout will be 230 Rs ,With a stoploss of 150Rs.
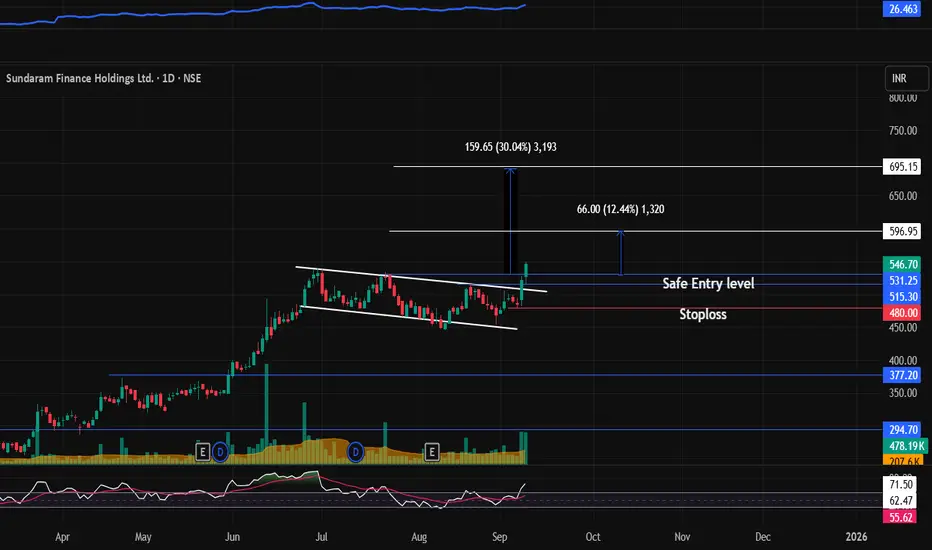
SUNDARMHLD : Breakout stock (Swing pick)#SUNDARMHLD #flagbreakout #breakoutstock #channelbreakout #swingtrading #momentumtrading
SUNDARMHLD : Swing / Short term (1-3 months)
>> Flag Breakout or Channel Breakout
>> Good Strength in stock
>> Volumes picking up
>> Low PE Stock
>> Swing Traders can Look for 10-12% Levels & Short term traders
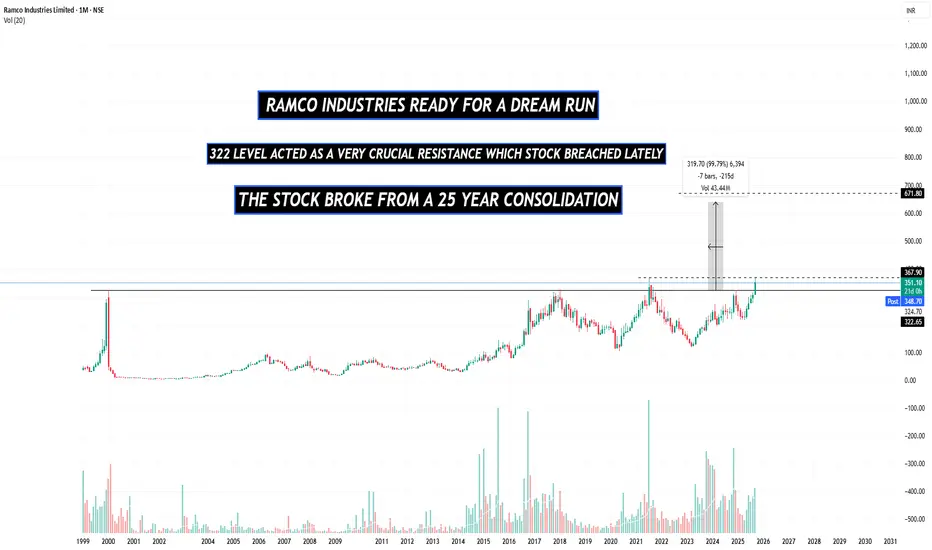
RAMCO INDUSTRIES NEAR MULTIYEAR BREAKOUTThe stock has not been able to breach the crucial resistance of 322 since 1999, pretty strange.
but now the the stock ha rallied past that level with good momentum enforcing further trust in the stock
The stock is also trading below it's book value of 488 again a pretty strange yet interesting op
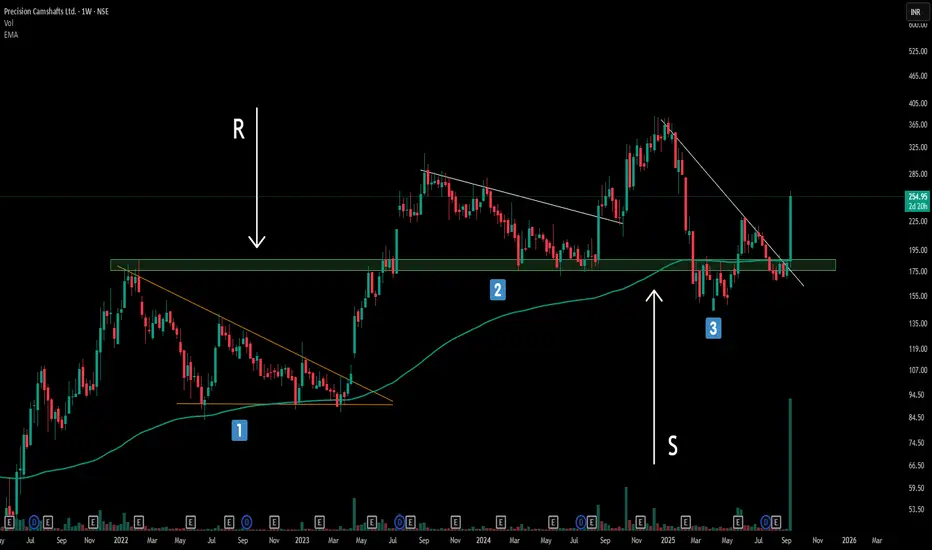
The Power of Trendline Angles : My Full time trading ExperienceBreaking Down Three Critical Trendline Structures - A Complete Analysis
Structure 1: The Power of Steep Angles (Primary Focus)
The first structure showcases what I consider the gold standard of trendline breakouts. Notice how the trendline is significantly tilted/slanted rather than following a gra
Apollo Tyre - SMC AnalysisTechnical Analysis (SMC Method)
Even it is formed bullish choch and trendline breakout in the weekly timeframe, it has to break the crucial resistance zone in daily timeframe (between 488 & 500) for confirmation. Once it's broken in daily timeframe the estimate target price will be 535/540.
== ED

Finally the breakout is done or has it not?Stock has been in long consolidation phase with ibu and para prices making lower lows since over stocking post covid. With the new initiative taken by management and prudent cash allocation from covid times, the volumes speak of more than what the PAT showcases.
Technically on weekly charts on the f
Lupin LtdDate 08.09.2025
Lupin
Timeframe : Weekly Chart
Brands
(1) Lupin Life
(2) Lupin Diagnostics
(3) Life Atharv Ability
(4) SciFlix
(5) Humrahi
(6) Pharmarack
Leadership
(1) Respiratory
(2) Diabetes Care
(3) Cardiac Care
Lupin has partnered with Amman Pharma for exclusive marketing and
commercializ

See all editors' picks ideas
VWAP Price ChannelVWAP Price Channel cuts the crust off of a traditional price channel (Donchian Channel) by anchoring VWAPs at the highs and lows. By doing this, the flat levels, characteristic of traditional Donchian Channels, are no more!
Author's Note: This indicator is formed with no inherent use, and serves

Fibonacci Sequence Circles [BigBeluga]🔵 Overview
The Fibonacci Sequence Circles is a unique and visually intuitive indicator designed for the TradingView platform. It combines the principles of the Fibonacci sequence with geometric circles to help traders identify potential support and resistance levels, as well as price expansio

ATAI Volume Pressure Analyzer V 1.0 — Pure Up/DownATAI Volume Pressure Analyzer V 1.0 — Pure Up/Down
Overview
Volume is a foundational tool for understanding the supply–demand balance. Classic charts show only total volume and don’t tell us what portion came from buying (Up) versus selling (Down). The ATAI Volume Pressure Analyzer fills that g

Market Cap Landscape 3DHello, traders and creators! 👋
Market Cap Landscape 3D. This project is more than just a typical technical analysis tool; it's an exploration into what's possible when code meets artistry on the financial charts. It's a demonstration of how we can transcend flat, two-dimensional lines and step into

ZigzagLiteLibrary "ZigzagLite"
Lighter version of the Zigzag Library. Without indicators and sub-component divisions
method getPrices(pivots)
Gets the array of prices from array of Pivots
Namespace types: Pivot
Parameters:
pivots (Pivot ) : array array of Pivot objects
Returns: array array

ZigzagLibrary "Zigzag"
Zigzag related user defined types. Depends on DrawingTypes library for basic types
method tostring(this, sortKeys, sortOrder, includeKeys)
Converts ZigzagTypes/Pivot object to string representation
Namespace types: Pivot
Parameters:
this (Pivot) : ZigzagTypes/Pivot

Angled Volume Profile [Trendoscope]Volume profile is useful tool to understand the demand and supply zones on horizontal level. But, what if you want to measure the volume levels over trend line? In trending markets, the feature to measure volume over angled levels can be very useful for traders who use these measures. Here is an att

MathEasingFunctionsLibrary "MathEasingFunctions"
A collection of Easing functions.
Easing functions are commonly used for smoothing actions over time, They are used to smooth out the sharp edges
of a function and make it more pleasing to the eye, like for example the motion of a object through time.
Easing function

Treasury Yields Heatmap [By MUQWISHI]▋ INTRODUCTION :
The “Treasury Yields Heatmap” generates a dynamic heat map table, showing treasury yield bond values corresponding with dates. In the last column, it presents the status of the yield curve, discerning whether it’s in a normal, flat, or inverted configuration, which determined by us

Time & Sales (Tape) [By MUQWISHI]▋ INTRODUCTION :
The “Time and Sales” (Tape) indicator generates trade data, including time, direction, price, and volume for each executed trade on an exchange. This information is typically delivered in real-time on a tick-by-tick basis or lower timeframe, providing insights into the traded size

See all indicators and strategies
Community trends
Complex Cup & Handle Pattern Breakout in TOLINS TyresTolins Tyres given Complex Cup & Handle Pattern Breakout from neckline arround 170 level. RSI & MACD also showing positive momentum ,Stock also trading above all important moving averages(50,10,200).Target of this breakout will be 230 Rs ,With a stoploss of 150Rs.
RELIANCE 1D Time frame🔢 Current Level
RELIANCE is trading around ₹1,391 – ₹1,392
🔑 Key Resistance & Support Levels
Resistance Zones:
₹1,392 – ₹1,396 (near-term resistance; breakout above this may lead to further upside)
₹1,400 (psychological resistance)
₹1,427 (stronger resistance above)
Support Zones:
₹1,380 – ₹
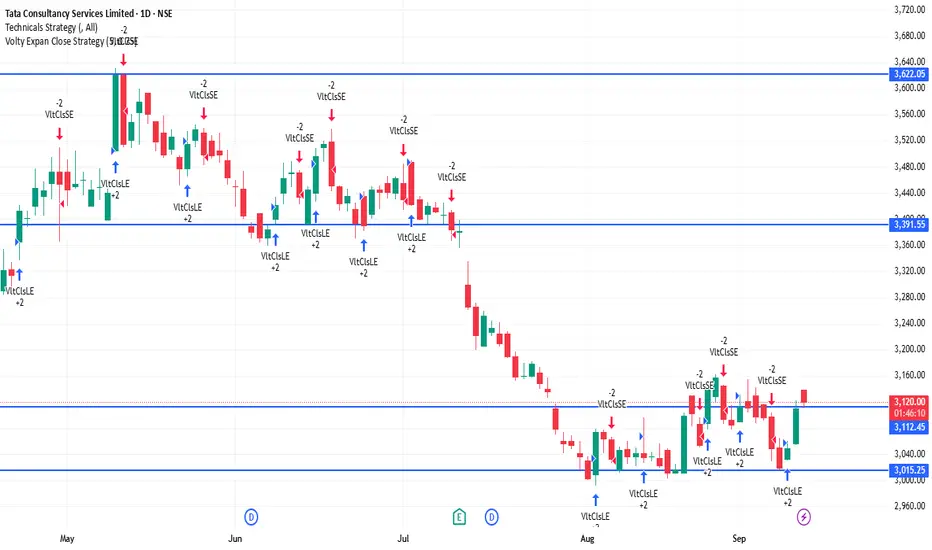
TCS 1D Time framePrice Action (Daily Chart)
Current price is around ₹3,117 - ₹3,120
Price is consolidating near support zones after a recent upward move.
Candle structure shows buying interest at lower levels, but resistance is capping the upside.
📊 Indicators
Moving Averages (MA):
Short-term MAs (5-day, 10-da
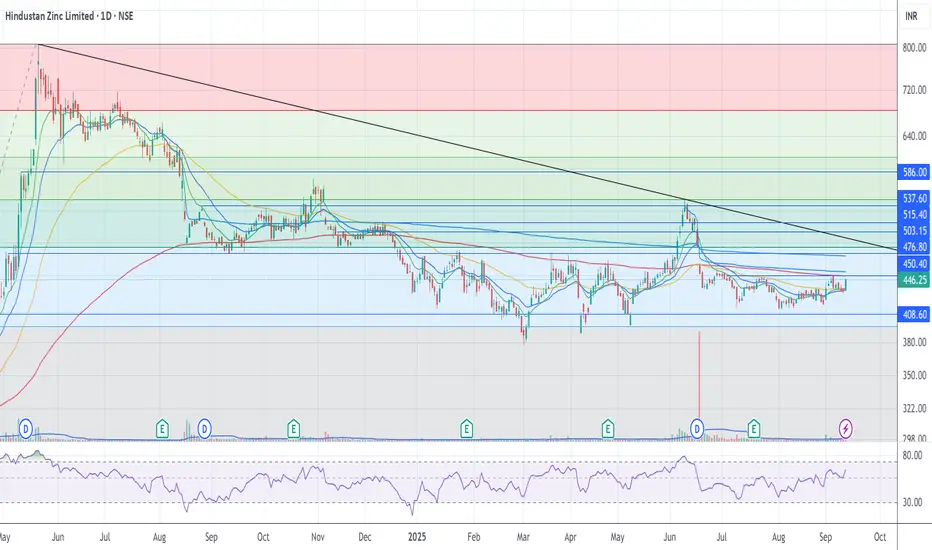
Hind Zinc - Commodity tailwindsWith its underlying commodities moving..the stock should move back above the 200EMA.
Long above 450 with a Stoploss below 430.
There is a small H&S pattern on the smaller timeline. There could also be a potential phase shift.
There is a gap fill upto 480 which could potentially get filled.
BUY TODAY SELL TOMORROW for 5%DON’T HAVE TIME TO MANAGE YOUR TRADES?
- Take BTST trades at 3:25 pm every day
- Try to exit by taking 4-7% profit of each trade
- SL can also be maintained as closing below the low of the breakout candle
Now, why do I prefer BTST over swing trades? The primary reason is that I have observed that

Buy,Retest or Wait? Backtesting Charts with Bar Replay!Using TradingView’s Bar Replay, I break down an old chart and reveal the exact logic behind whether it was a buy, sell,retest or skip trade. Perfect for traders who want to sharpen entry-decisions with real market context.

MOL LONGElliott Wave analysis shows that the stock has completed waves a, b, and c as a correction. Currently, the stock is undergoing an impulse wave.
The stock is currently in wave (i) in blue color.
This wave will unfold in five sub waves in red colour.
wave i,ii,iii and iv is completed and wave v is

tringle pattern pick up for new upside target -1376
having symmetrical pattern.
this pattern taking almost 1 year and now its time to upper break out long term 1630 pattern
WAAREE ENERGIES READY FOR A BLASTWaaree Energies is India’s largest manufacturer and exporter of solar modules. As of FY24, they hold 21% share of the domestic market for solar modules and 44% share in India's solar module exports. Its installed capacity surged from 2GW in FY21 to 13.3GW by FY24.
The stock has a crucial resistance

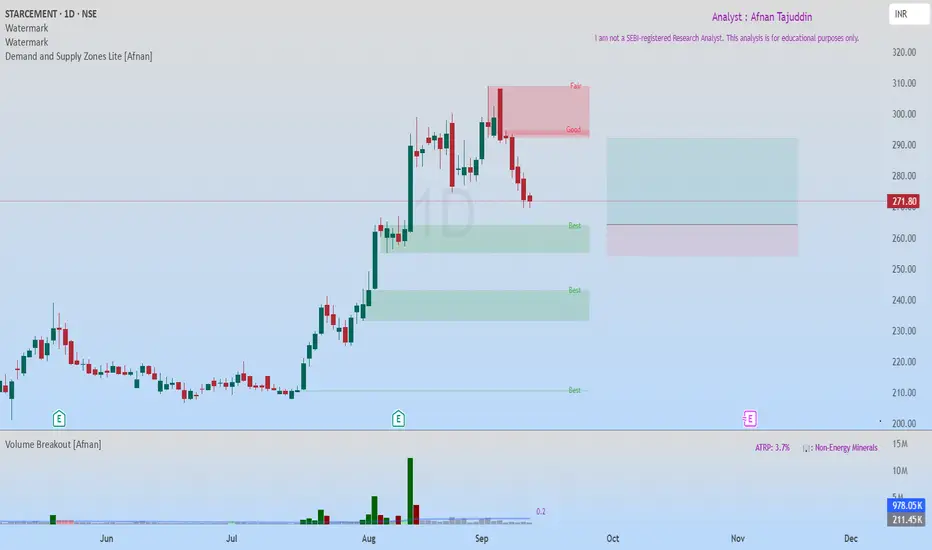
StarCement at Fresh Demand Zone – High Probability Bullish SetupStar Cement recently hit an all-time high and is now retracing towards a fresh Rally-Base-Rally (RBR) Demand Zone . This zone is of high quality, and the overall market structure remains strongly bullish. The best part? There’s no immediate supply zone until a potential 1:2 risk-to-reward target
See all stocks ideas
No scheduled reports
Community trends
Bitcoin – Trend Update Ahead of PPIBitcoin – Trend Update Ahead of PPI
Hello Traders,
The current scenario for Bitcoin is unfolding in line with expectations, with the uptrend continuing to develop strongly. Price waves are moving with solid volume, and the overall structure is progressing exactly as anticipated.
Key Levels
Price

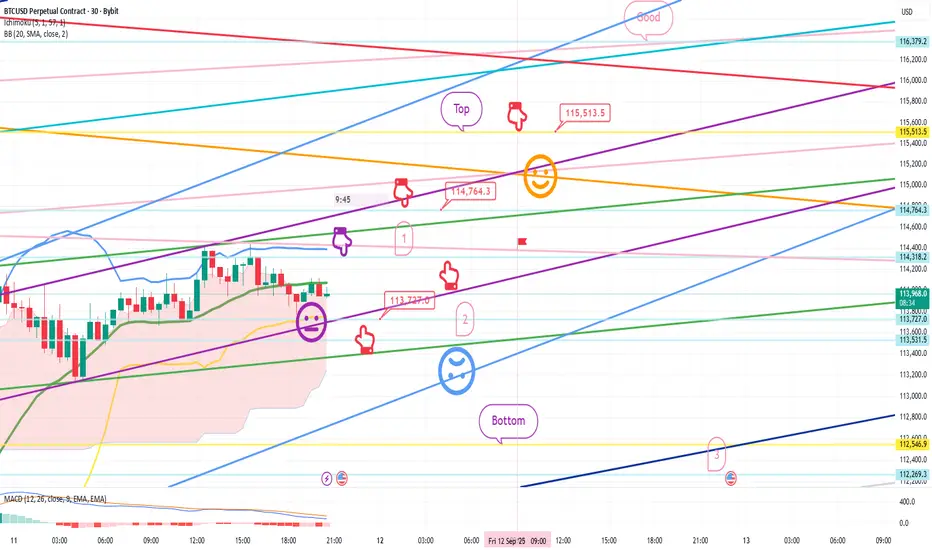
Bitcoin Bybit chart analysis September 11 (CPI)Hello
It's a Bitcoin Guide.
If you "follow"
You can receive real-time movement paths and comment notifications on major sections.
If my analysis was helpful,
Please click the booster button at the bottom.
This is Bitcoin's 30-minute chart.
The CPI indicator will be released shortly at 9:30 AM.
XAUUSD GOLD ANALYSIS ON (11/09/2025)#XAUUSD UPDATEDE
Current price - 3636
If price stay below 3660, then next target 3600,3680 and above that 3700
Plan;If price break 3640-3648 area, and stay below 3640, we will place sell order in gold with target of 3600 and 3580 & stop loss should be placed at 3660

DOGE LANDS ON WALL STREET | PipGuardDOGE LANDS ON WALL STREET | PipGuard
Hello there, my colleagues, welcome back!
Article published by PipGuard™ on the TradingView® platform – to continue this free publication, LEAVE A BOOST and a COMMENT, hit the notification bell, and never miss ANOTHER ANALYSIS.
ANALYSIS
🔥 DOGE LANDS ON

Ethereum Liquidity Sweep Setup for Bullish Continuation📊 Market Analysis Report – ETHUSD
The market has been consolidating within a range after a strong impulsive move down, followed by a period of liquidity sweeps and corrective structure. Price action shows signs of engineered liquidity grabs both above and below recent highs and lows, which indicate

Bitcoin (BTC/USD) Outlook – 4H ChartBitcoin is showing strong bullish structure while trading around $114,200, respecting its ascending channel and aiming higher.
🔎 Bullish Signals:
Ascending Channel:
Price is moving within a clear upward channel, signaling a steady uptrend.
Support Confirmation:
Strong demand zone holding around

BTC Forms Powerful Ascending Triangle – Is a Breakout Coming?What’s happening with Bitcoin right now? 🚀
Bitcoin has formed an ascending triangle after a significant drop. This is a bullish continuation pattern , signaling that buyers are slowly pushing the price higher, while sellers are still defending the resistance level. The support line is rising, cr

BITCOIN GOINGTO BOOMAfter completing the ascending diagonal, Bitcoin has confirmed a trend reversal and is now moving into an uptrend. The contracting triangle has also completed, and Bitcoin is entering the 3rd wave, with the first target at 119,437.

BTCUSDT Elliott Wave Analysis (2H Chart)Currently tracking a 5-wave Elliott structure:
Wave (1) initiated the bullish impulse.
Wave (2) retraced back with healthy correction.
Wave (3) extended strongly, showing momentum.
Wave (4) completed with a corrective pullback.
Wave (5) is in progress, approaching the liquidity zone between 117

BTC - LONGBitcoin has broken above the 200 EMA, confirming bullish bias.Price is supported by the 10 & 20 EMA crossover (short-term bullish trend). As long as BTC holds above $115,000, upside targets are $117,600 and then $120,000. If it loses $115,000, caution — the bullish setup may fail.

See all crypto ideas
Bullish Silver is looking very very hot
Its bullish Flag making if silver sustain this week above 42.25$, then it comes to 49 superfast maybe next in two days only
There's no recommendations from my side
Only for learning purpose

XAUUSD – Will Gold Continue to Print New ATH ?XAUUSD – Will Gold Continue to Print New ATHs?
Hello Traders,
The Asian session today shows that buying interest in gold remains strong. A confirmed break above 3658 would mark a key resistance level and signal that gold could extend its bullish trend further.
Technical Outlook
The Fibonacci 2.6

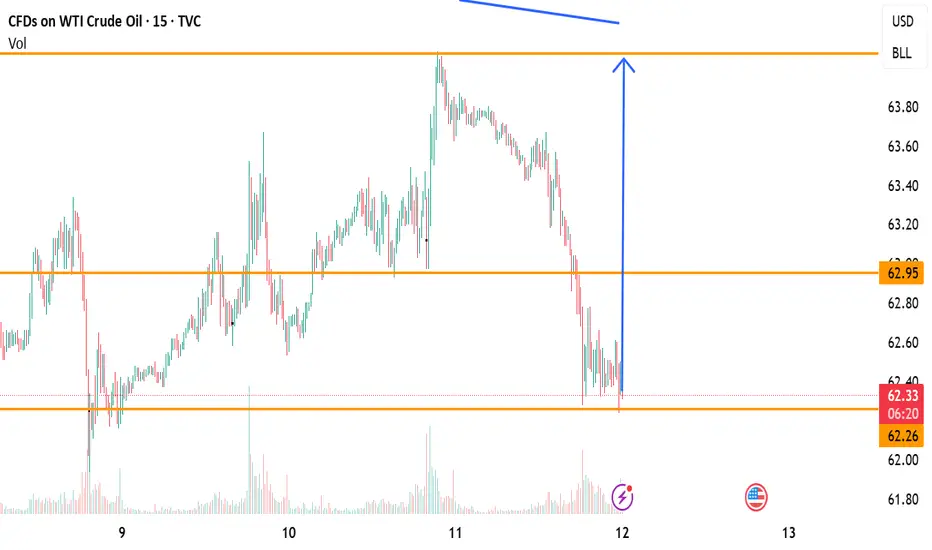
Buy Setup on 15-Min ChartCrude oil is currently holding above the key support near 62.26 and showing signs of reversal after a strong rejection from the lows.
📌 Entry Zone: 62.35 – 62.50
🎯 Target: 62.95
🛑 Stop Loss: 62.26
🔎 Analysis:
Price respected support and formed a bullish rejection wick, indicating buying pressure.
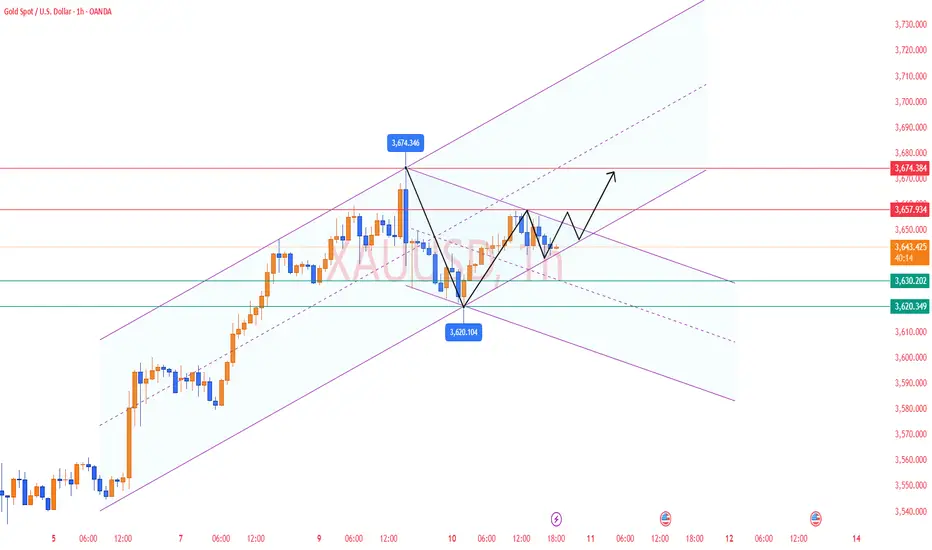
Analysis of subsequent gold price trends!Market News:
In early Asian trading on Wednesday (September 10), London gold prices fluctuated downward, currently trading around $3,621 per ounce. After hitting a record high of $3,674, the spot price plummeted nearly $50, ultimately ending the day in the red. International gold prices have recent

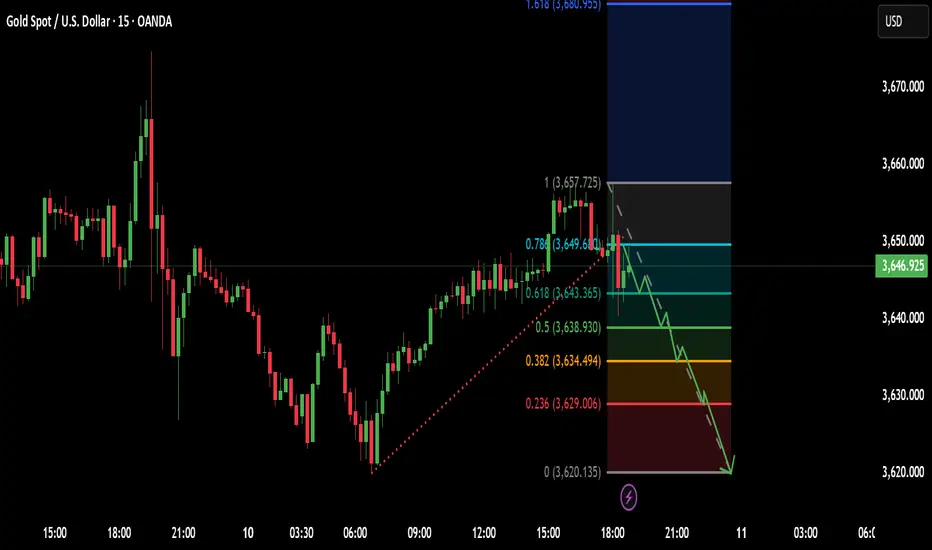
Trading Analysis for Gold Spot / U.S. Dollar (15-Minute Chart)Entery = 3649.00
Stock Loss = 3657.00
Take profit 1 = 3643.00
Take profit 2 = 3639.00
Take profit 3 = 3634.00
Take profit 4 = 3628.00
Based on the provided 15-minute chart for Gold Spot / U.S. Dollar (XAU/USD), published by NaviPips on TradingView.com on June 30, 2025, at 17:53 UTC, here’s a sugge
Gold Breaks Out: Rising Buying Power Amid USD WeaknessMarket Context:
The higher-than-expected Unemployment Claims data (263K vs 235K) has weakened the USD, providing favorable conditions for gold to rise. The University of Michigan Consumer Sentiment and Inflation Expectations remain stable, but they do not significantly impact gold’s trend.
XAUUSD

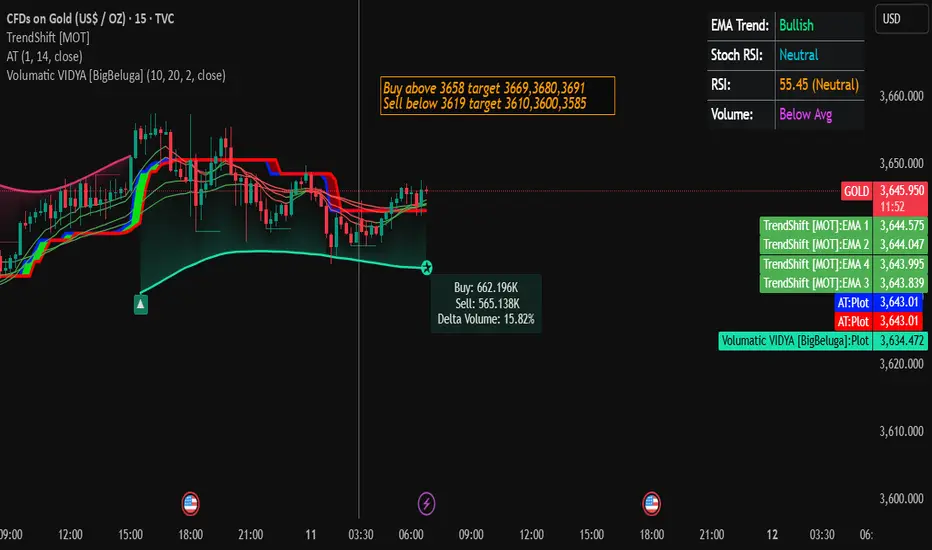
Gold Trading Strategy for 11th September 2025Detailed trading plan — GOLD (15-min breakout rules)
Raw rules :
Buy: if a 15-minute candle closes above the high at $3658 → targets $3669, $3680, $3691.
Sell: if a 15-minute candle closes below the low at $3619 → targets $3610, $3600, $3585.
Execution & order types (step-by-step)
A. Buy setup (ho
Gold 1H – CPI Liquidity Play Before ExpansionGold on the 1H timeframe is consolidating near 3,633 after multiple ChoCHs and engineered liquidity grabs. With today’s CPI release, price is expected to sweep both premium and discount liquidity zones. The structure suggests engineered spikes toward 3,688–3,691 or dips into 3,595–3,592 before expan

XAUUSD | Buy Setup | 11 Sep 2025 – 21:45 IST XAUUSD | Buy & Sell Setup | 11 Sep 2025 – 21:45 IST
Buy Zone: 3658.58 – 3641.81
Sell Zone: 3640.34 – 3612.69
Scenario : Buy
Entry: 3640.67
Stop Loss: 3620.13
Targets:
TP1 → 3657.61
TP2 → 3674.69
Analysis:
From Buy Zone (3658.58 – 3641.81) creates possibilities for a buy move.
Stay alert on up

Gold Trading Strategy | September 10-11✅ Daily Chart: The overall trend remains upward. After a continuous rally, gold hit a high near 3675 and pulled back. MA5 and MA10 are still trending upward, while MA20 around 3640 provides key support. The daily trend remains bullish but has entered a high-level consolidation phase, with resistance
See all futures ideas
GBPUSD Ready for Expansion After Liquidity GrabThe market has been trading within a broad range, characterized by multiple liquidity grabs on both highs and lows. Each sweep has been followed by sharp reactions, confirming active smart money positioning. Recent price action shows a strong recovery after a downside liquidity sweep, indicating acc
EURUSD | Buy & Sell Setup | 11 Sep 2025 – 09:20 IST EURUSD | Buy & Sell Setup | 10 Sep 2025 – 09:20 IST
Buy Zone: 1.17323 – 1.17159
Sell Zone: 1.16935 – 1.16665
Scenario : Buy
Entry: 1.17145
Stop Loss: 1.16887
Targets:
TP1 → 1.17801
TP2 → 1.17888
Analysis:
From Buy Zone (1.17323 – 1.17159) creates possibilities for a buy move.
Scenario 2 : Sell

Bearish Signal at BreakoutThe AUDCAD is on strong Buy side since the start of this month. Enough to be in overbought area.
The Channel / Rising wedge is confirming its strong buy on H1 timeframe.
Now we are waiting for the breakout of this Rising Wedge. Yet we will not trade unless it doesn't break its Lower High at 0.9

GBPUSD(20250911)Today's AnalysisMarket News:
The U.S. PPI annual rate for August hit 2.6%, the lowest since June. Traders are increasing bets on a Federal Reserve rate cut.
Technical Analysis:
Today's buy/sell levels:
1.3533
Support and resistance levels:
1.3584
1.3565
1.3553
1.3514
1.3502
1.3483
Trading Strategy:
If the pr

EUR/USD | 1H | Smart Money OutlookPrice has swept the previous low and is reacting from a key liquidity pocket. Structure remains intact for a potential bullish delivery. With CPI expected to print on the stronger side, we could see a favorable USD reaction — but the market is already pricing in the move, setting up EUR/USD for a li

BUY EURAUDTrade Idea: BUY EURAUD
The EURAUD pair is showing renewed bullish momentum as the Euro gains strength against the Australian Dollar. Market sentiment is tilted in favor of EUR, supported by stability in the Eurozone, while AUD is weighed down by softer risk appetite and commodity price pressures.

EUROUSD - LongIn this 30-minute chart of EUR/USD where we can see a hammer candle forming exactly at a key support level. A hammer candle indicates that sellers tried to push the price down but buyers came in strongly and managed to close the candle near the opening level. This shows buying interest at the suppor

NZDUSD - Sell Setup Idea 📌 Pair: NZDUSD
📅 Timeframes Used: Daily + 1H
---
🔹 Higher Timeframe Context
Daily Trend: Bearish → Market is aligned with sellers, giving us downside bias.
1H Trend: Currently bullish → This looks like a retracement against the bigger bearish move.
---
🔹 Key Liquidity & Supply Zone
Price r

Bullish Channel Breakout Setup (15M)Price action on the 15M chart is showing a well-defined falling channel. The pair recently bounced from the lower channel support, indicating that buyers are stepping in around this area.
📌 Key Observations:
Price is respecting the channel pattern.
Breakout attempt above the channel is visible.
USDJPY 1H📍 USDJPY – 1H
🔹 Support Zones
147.80 – 148.00 → Immediate intraday support
147.30 – 147.50 → Strong support; buyers likely active
146.80 – 147.00 → Major support; breakdown here may extend bearish momentum
🔹 Resistance Zones
148.50 – 148.70 → Immediate intraday resistance
149.00 – 149.20 → St

See all forex ideas
| - | - | - | - | - | - | - | - | ||
| - | - | - | - | - | - | - | - | ||
| - | - | - | - | - | - | - | - | ||
| - | - | - | - | - | - | - | - | ||
| - | - | - | - | - | - | - | - | ||
| - | - | - | - | - | - | - | - | ||
| - | - | - | - | - | - | - | - | ||
| - | - | - | - | - | - | - | - | ||
| - | - | - | - | - | - | - | - |
Trade directly on the supercharts through our supported, fully-verified and user-reviewed brokers.


