spot gold or mcx gold update as per chartgold spot looks stair pattern or now news in focus usa shut down--
technical lvl- spot gold abv 3883 looks again up side 3900-3920--3945$ where support 3860$ which break blow with volume than more down fall 33852--42--34$ expect.
mcx gold sustain abv 118300 looks 119k near where support 117700 whi

The best trades require research, then commitment.
Get started for free$0 forever, no credit card needed

Scott "Kidd" PoteetThe unlikely astronaut

Where the world does markets
Join 100 million traders and investors taking the future into their own hands.
Major indices

LIC – High Probability Breakout Setup!After a long consolidation, LIC is now approaching a falling trendline breakout with strong bullish momentum.
This is a high probability breakout setup supported by price action and structure.
📌 Plan:
✅ Entry: 900–910
❌ Stoploss: 844
🎯 Targets: 970–985 / 1068 / 1172
Highlights:
Multiple rejections

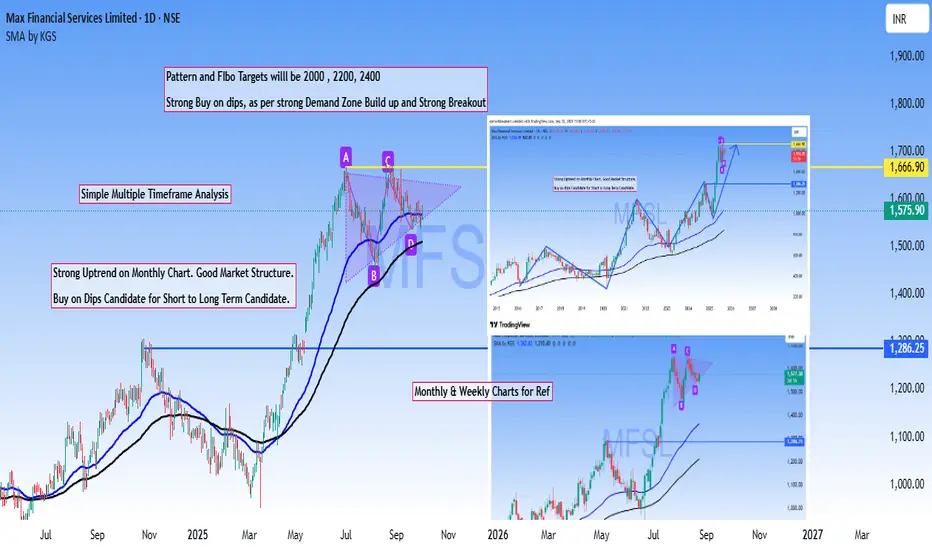
MFSL Multi time frame AnalysisMulti-timeframe confluence analysis offers traders a robust edge through straightforward yet highly effective methodology.
Based on that MFSL is a strong Buy on dips stock based on powerful breakout of previous ATH and the current market structure.
Targets are derived from #Pattern #breakout and #
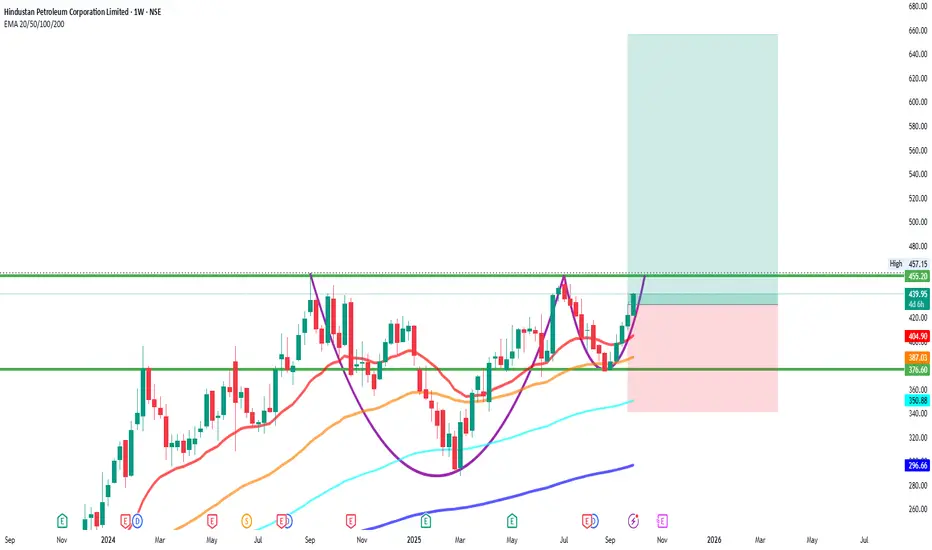
HINDPETROHINDPETRO
bullish trend is Showing on the chart.
buy signals in
technical indicators and
cup with handle chart pattern.
Watch for a breakout above 450/460 to sustain the bullish trend. If the resistance holds, there could be a retest towards 360/370 and an uptrend from here.
ICICI Bank: Resistance Turned Support Powers Next Rally🔍 Technical Analysis
ICICI Bank showcases another remarkable wealth creation story spanning over two decades. The stock has delivered an extraordinary super bullish rally, transforming from ₹40 to the current trading level of ₹1,351 - representing an impressive 33.8x growth over 20+ years.
The ₹1

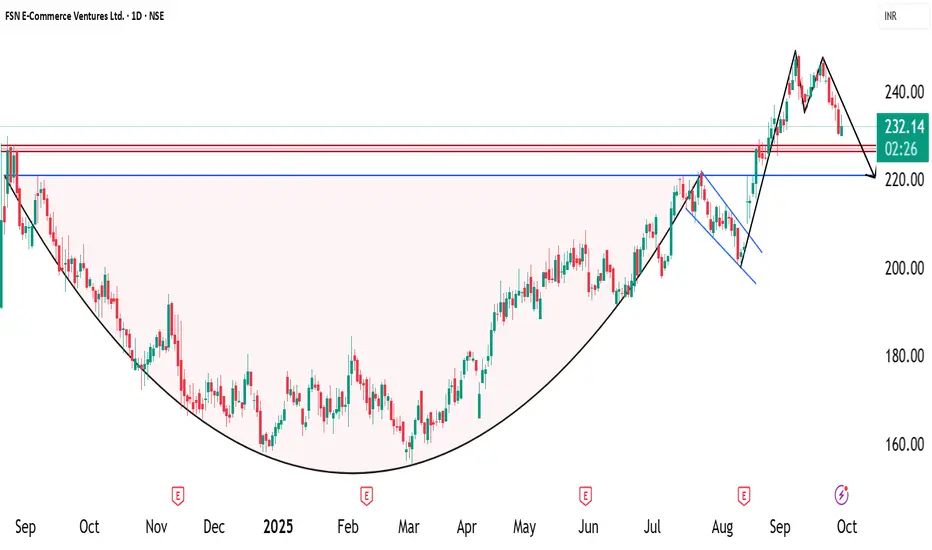
NYKAA - Cup with handle pattern📈 Pattern Analysis: Nykaa recently completed a "Cup-with-Handle Breakout" , which is a strong bullish continuation pattern. However, the breakout targets have not yet been achieved. In the past few sessions, the stock has witnessed selling pressure, forming a double-top bearish pattern on the cha
Daily analysis for Nifty50: 29/09/25Nifty is still not bullish. A trendline support test is quite possible. That comes at around 24535-24520 range of price. If that is breaching it will test lower levels of 24560, 24405 and 24360 as downside fall.
On bounce it will rise till 24630 to 24740 as resistance.

Lumax industries Look like after strong volume absorption done
Also auto part sector in trending.
Also sector given break out
Little bit late post , allready created entry just post for my trading history chart remember in future look what i have done mistake or Good point
Take 10%risk withtrade

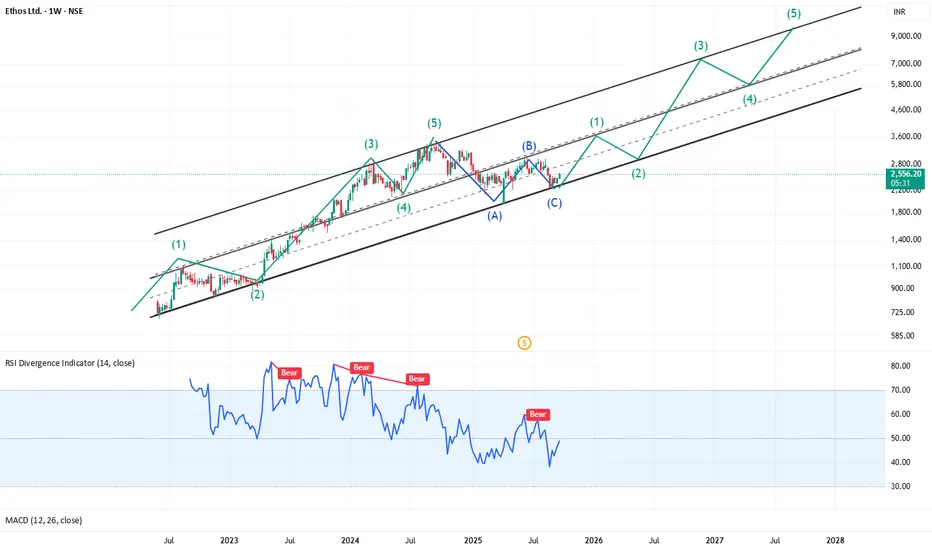
Fasten your wrist watches : CMP 2560Impulse and Corrective Structure
On the ETHOS weekly chart, the price action aligns closely with classic Elliott Wave theory. A complete 5-wave impulse pattern (labelled 1-2-3-4-5 in green) can be observed progressing within a rising parallel channel. Each impulse sequence is followed by a 3-wave c
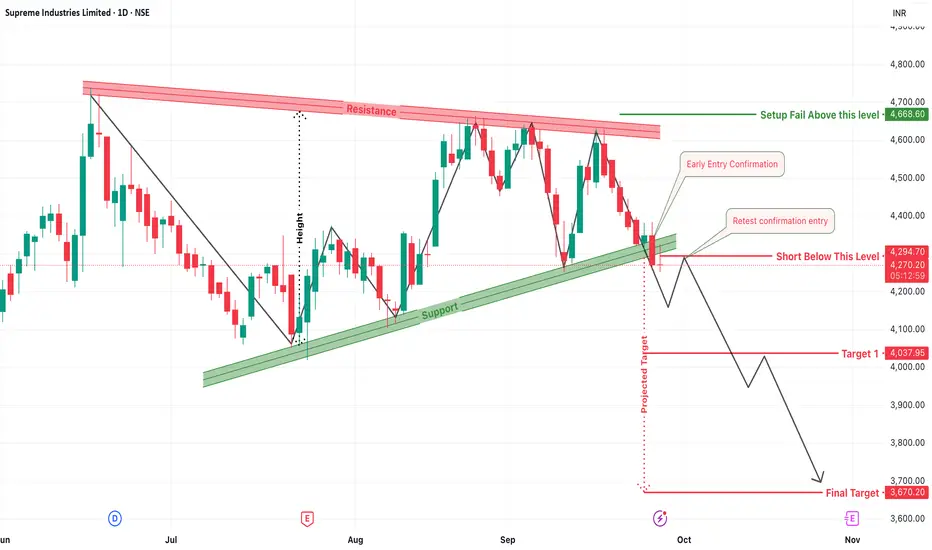
Supreme Industries: Breakdown Below Ascending SupportThe daily chart of Supreme Industries is showcasing a strong bearish signal with a breakdown below a long-held ascending trendline. The structure clearly resembles a descending triangle pattern, and the breakdown confirms growing weakness in price action, favoring sellers in the near term.
1. Bear
See all editors' picks ideas
RiskMetrics█ OVERVIEW
This library is a tool for Pine programmers that provides functions for calculating risk-adjusted performance metrics on periodic price returns. The calculations used by this library's functions closely mirror those the Broker Emulator uses to calculate strategy performance metrics (

Simple Decesion Matrix Classification Algorithm [SS]Hello everyone,
It has been a while since I posted an indicator, so thought I would share this project I did for fun.
This indicator is an attempt to develop a pseudo Random Forest classification decision matrix model for Pinescript.
This is not a full, robust Random Forest model by any stretch o

Tick CVD [Kioseff Trading]Hello!
This script "Tick CVD" employs live tick data to calculate CVD and volume delta! No tick chart required.
Features
Live price ticks are recorded
CVD calculated using live ticks
Delta calculated using live ticks
Tick-based HMA, WMA, EMA, or SMA for CVD and price
Key tick levels (S

analytics_tablesLibrary "analytics_tables"
📝 Description
This library provides the implementation of several performance-related statistics and metrics, presented in the form of tables.
The metrics shown in the afforementioned tables where developed during the past years of my in-depth analalysis of various str

Adaptive Trend Classification: Moving Averages [InvestorUnknown]Adaptive Trend Classification: Moving Averages
Overview
The Adaptive Trend Classification (ATC) Moving Averages indicator is a robust and adaptable investing tool designed to provide dynamic signals based on various types of moving averages and their lengths. This indicator incorporates multipl

Statistics • Chi Square • P-value • SignificanceThe Statistics • Chi Square • P-value • Significance publication aims to provide a tool for combining different conditions and checking whether the outcome is significant using the Chi-Square Test and P-value.
🔶 USAGE
The basic principle is to compare two or more groups and check the results

FiniteStateMachine🟩 OVERVIEW
A flexible framework for creating, testing and implementing a Finite State Machine (FSM) in your script. FSMs use rules to control how states change in response to events.
This is the first Finite State Machine library on TradingView and it's quite a different way to think about your

Trading Activity Index (Zeiierman)█ Overview
Trading Activity Index (Zeiierman) is a volume-based market activity meter that transforms dollar-volume into a smooth, normalized “activity index.”
It highlights when market participation is unusually low or high with a dynamic color gradient:
Light Blue → Low Activity (thin p

Expected Value Monte CarloI created this indicator after noticing that there was no Expected Value indicator here on TradingView.
The EVMC provides statistical Expected Value to what might happen in the future regarding the asset you are analyzing.
It uses 2 quantitative methods:
Historical Backtest to ground your anal

Bar Index & TimeLibrary to convert a bar index to a timestamp and vice versa.
Utilizes runtime memory to store the 𝚝𝚒𝚖𝚎 and 𝚝𝚒𝚖𝚎_𝚌𝚕𝚘𝚜𝚎 values of every bar on the chart (and optional future bars), with the ability of storing additional custom values for every chart bar.
█ PREFACE
This library aims to tackle s

See all indicators and strategies
Community trends
LIC – High Probability Breakout Setup!After a long consolidation, LIC is now approaching a falling trendline breakout with strong bullish momentum.
This is a high probability breakout setup supported by price action and structure.
📌 Plan:
✅ Entry: 900–910
❌ Stoploss: 844
🎯 Targets: 970–985 / 1068 / 1172
Highlights:
Multiple rejections
How to Backtest, Create a Strategy and Execute a Trade In this video I have showed a good trade is executed with proper planning and mindset .
Charts Used in this video are older than 3 months . Only for educational content .

GMR Airports Ltd – Bullish Bounce from Support ZoneThe chart of GMR Airports Ltd (Daily timeframe) is showcasing a well-respected ascending channel pattern, where price is currently bouncing off the lower support trendline, indicating a continuation of the bullish structure. This setup provides a compelling long opportunity if confirmed with price a

MFSL Multi time frame AnalysisMulti-timeframe confluence analysis offers traders a robust edge through straightforward yet highly effective methodology.
Based on that MFSL is a strong Buy on dips stock based on powerful breakout of previous ATH and the current market structure.
Targets are derived from #Pattern #breakout and #
OLAELEC Price ActionOlectra Greentech Ltd (OLAELEC) posted a strong performance today, trading around ₹1,390 with a notable upward move. The stock has been on a bullish trajectory over the past week, rebounding from its recent support near ₹1,350. Short-term moving averages indicate continued positive momentum, with th

Trade Set UpThe pattern visible suggests , its heading for one more move up
This forecast is based on 3 Stroke Move ,
This is education content
Good luck
JSWENERGY Quarterly Breakout#jswenergy Strong Breakout and Sustaining strongly on Quarterly Chart.
Good to Hold for Swing, Short and Long-term #Investment.
Strong on Technical's.
Charts never Disappoint me !

BUY TODAY SELL TOMORROW for 5%3 minutes ago
DON’T HAVE TIME TO MANAGE YOUR TRADES?
- Take BTST trades at 3:25 pm every day
- Try to exit by taking 4-7% profit of each trade
- SL can also be maintained as closing below the low of the breakout candle
Now, why do I prefer BTST over swing trades? The primary reason is that I have
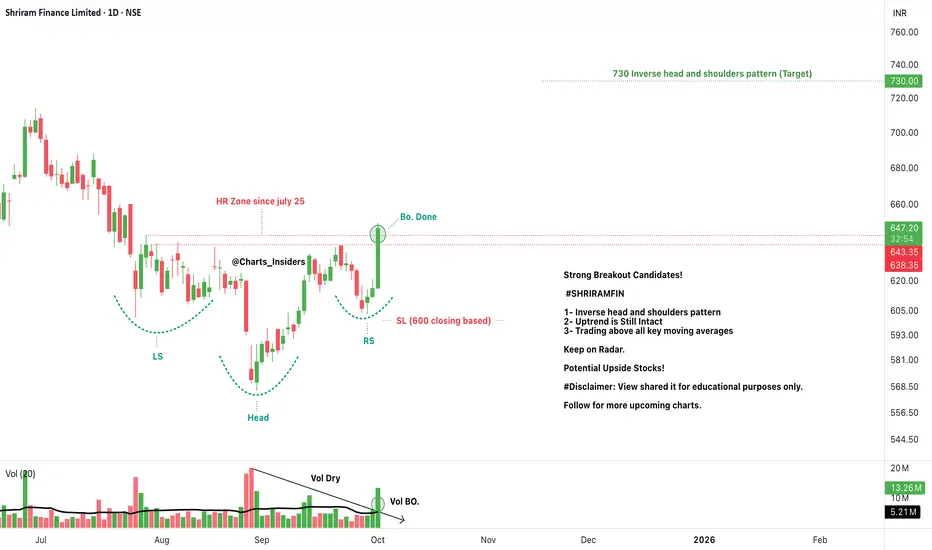
SHRIRAMFINStrong Breakout Candidates!
#SHRIRAMFIN
1- Inverse head and shoulders pattern
2- Uptrend is Still Intact
3- Trading above all key moving averages
Keep on Radar.
Potential Upside Stocks!
#Disclaimer: View shared it for educational purposes only.
Follow for more upcoming charts.
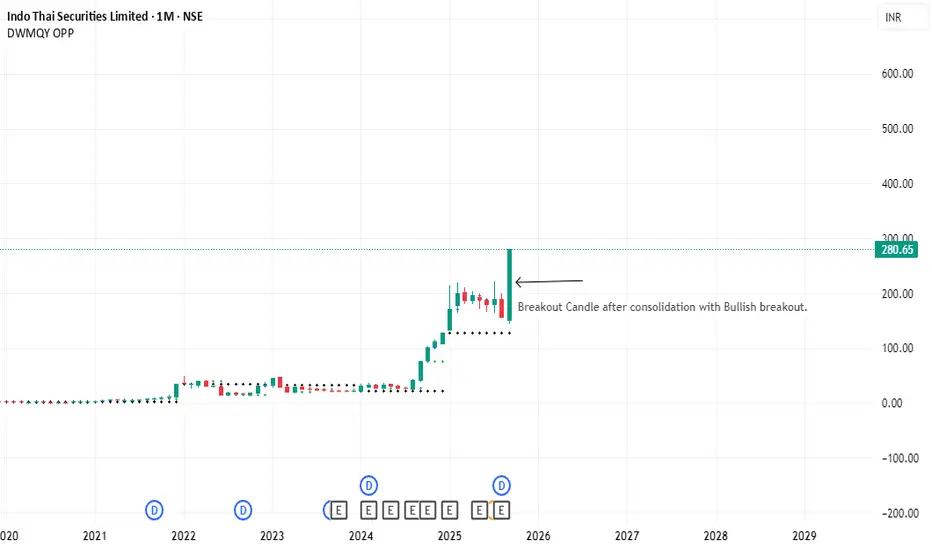
INDOTHAI SECURITIES_ATHHi traders,
Currently Stock is trading @ ATH with bullish breakout @ Monthly timeframe.
Pros:- Good set-up @ Monthly timeframe with Bullish breakout candle.
:- Stock is @ATH.
Cons:- Stock reacted 80 % gain in Sept-2025.
:- Enter after pullback in daily timeframe or weekly tim
See all stocks ideas
Oct 8
AVANTELAvantel Limited
Actual
—
Estimate
—
Oct 8
PLASTIBLENPlastiblends India Limited
Actual
—
Estimate
—
Oct 8
JTLINDJTL Industries Limited
Actual
—
Estimate
—
Oct 9
GMBREWG.M. Breweries Ltd.
Actual
—
Estimate
—
Oct 9
HCLTECHHCL Technologies Limited
Actual
—
Estimate
15.57
INR
Oct 9
IREDAIndian Renewable Energy Development Agency Ltd.
Actual
—
Estimate
—
Oct 9
TCSTata Consultancy Services Limited
Actual
—
Estimate
34.62
INR
Oct 13
DMARTAvenue Supermarts Ltd.
Actual
—
Estimate
10.70
INR
See more events
Community trends
Bitcoin – Let’s Play the Resistance Game at 114,500Bitcoin on the 1-hour chart has entered a critical resistance zone around 114,200–114,500. Price has rallied strongly from the recent lows near 113,000, but now faces a major supply area. The structure suggests that BTC could face rejection here and move back toward the support zone near 112,600 if

Bitcoin Under Pressure: Bearish Momentum BuildsBitcoin recently transitioned from a corrective decline into a consolidation phase, where price activity showed reduced volatility and market indecision. The breakout from this range has introduced renewed momentum, highlighted by strong bullish candles and a clear shift in trend dynamics. This move

Sell BTC few quantity As per BTC whatever technical but it's seems we may seen some small correction so plan a short trade with proper SL

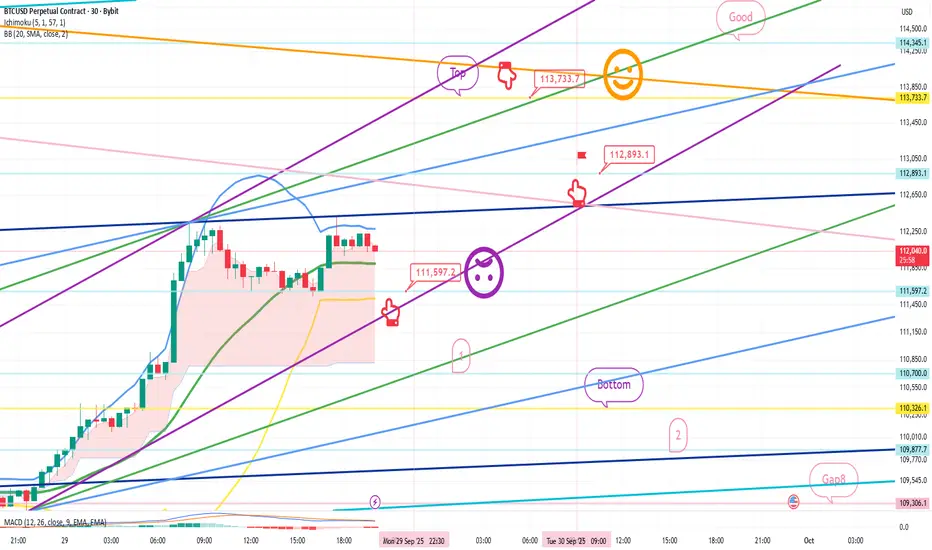
September 29 Bitcoin Bybit chart analysisHello
It's a Bitcoin Guide.
If you "follow"
You can receive real-time movement paths and comment notifications on major sections.
If my analysis was helpful,
Please click the booster button at the bottom.
This is a Bitcoin 30-minute chart.
There are no Nasdaq indicators released today.
I deve
[SeoVereign] BITCOIN BEARISH Outlook – September 30, 2025Hello everyone,
Today, as of September 30, I would like to share my perspective on a Bitcoin short position. Once again, I am leaning toward the possibility of a decline, and the basis for this view consists of two main points.
First, from the perspective of Elliott Wave Theory, the ongoing 5th wav

Ethereum: Bullish or Bearish? The Path AheadEthereum is at a critical juncture on its 4-hour chart. The price recently touched $4,180 and has started pulling back. The Fair Value Gaps (FVGs) in the $4,000–$4,100 zone suggest the market might revisit this area for a quick rebalancing before confirming the next move. In the short term, this is

BTC Long Setup – Black Line Reclaim & Demand Zone BounceBTC reached the green demand zone after the decline from 116,700.
Price stabilized near the black trend line (~112,000) – key bullish reclaim trigger.
Trade Details (Educational)
Entry (Long): Near black trend line (~112,000) after confirmation of demand.
Stop Loss: Below green demand zone (~11

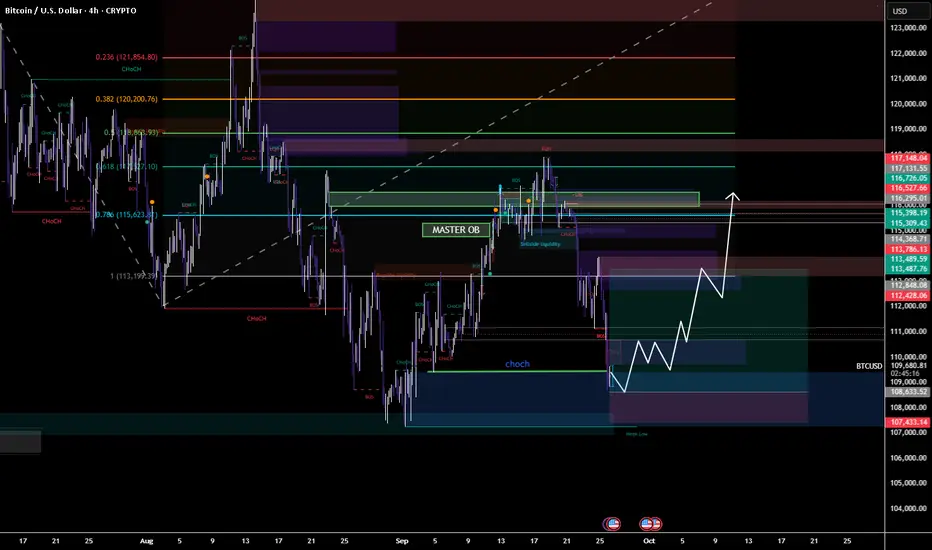
BTC Bulls Eyeing a Reversal From Liquidity SweepBTC Bulls Eyeing a Reversal from Liquidity Sweep”
📌 Description:
Bitcoin swept downside liquidity near 108k, tapping into a demand zone. If this level holds, expect a strong recovery toward the 113.5k–116.5k supply zones, with the Master OB acting as a key magnet for price.
📈 Trade Plan (4H BTCUS

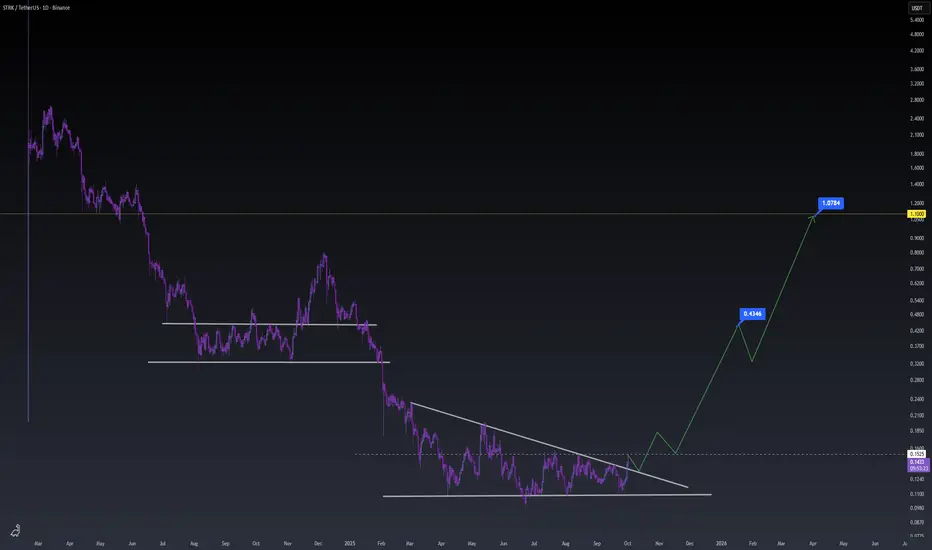
STRK shifting gearsGood to see the STARKNET team finally shifting gears and dropping bullish updates right at the start of Q4. Feels like Jew Mode is on now. Time to moon it.
See all crypto ideas
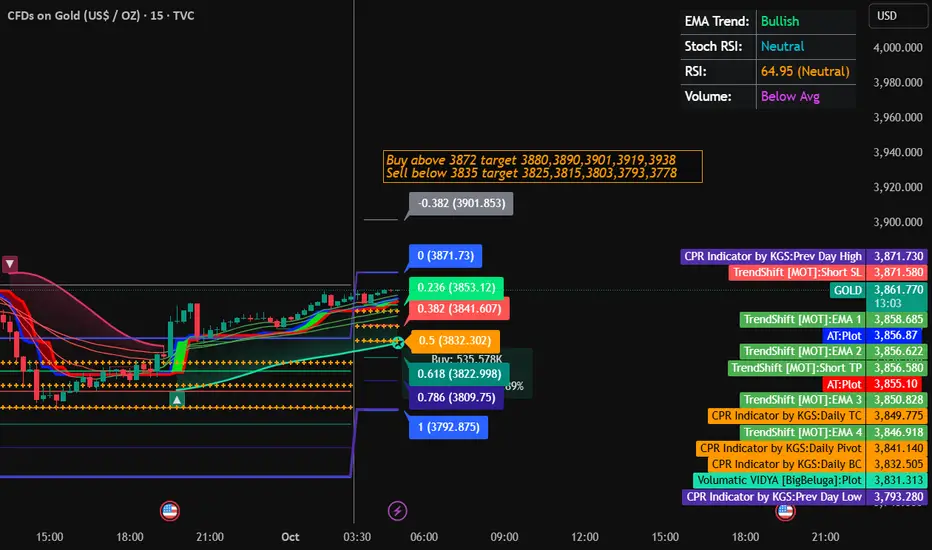
Gold Trading Strtegy for 01st October 2025📈✨ Gold Trading Setup (XAU/USD)
🔑 Buy Setup
✅ Buy above the high of the 1-hour candle if price closes above $3872
🎯 Targets: $3880,$3890,$3901,$3919,$3938
🔑 Sell Setup
✅ Sell below the low of the 1-hour candle if price closes below $3835
🎯 Targets:$3825,$3815,$3803,$3793,$3778
⚠️ Risk Management
A
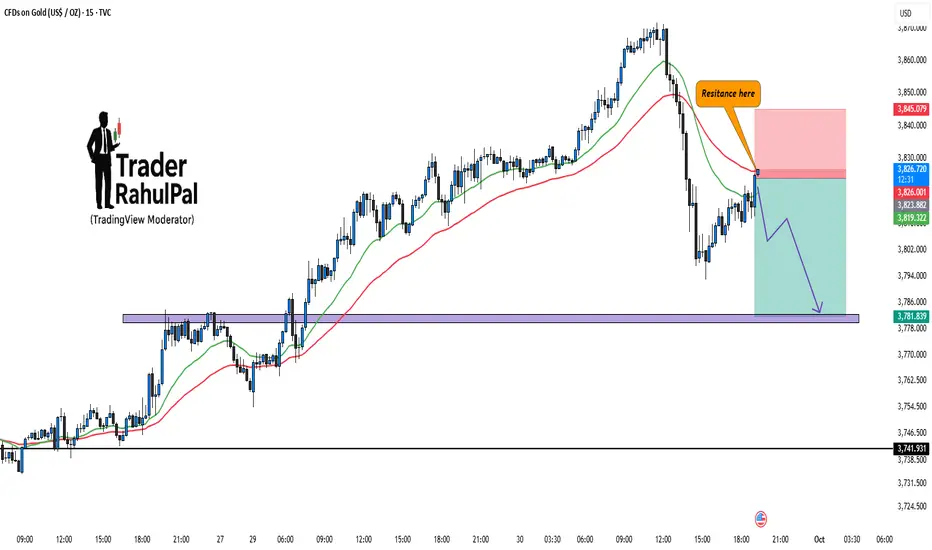
Gold – Resistance at 3840, Contra Move in Play?Gold has approached the 3825 and at high around 3840 resistance zone where sellers are likely to step in. Price rejection from this area can trigger a downside move toward the 3775–3780 support zone.
Currently, the setup favors a contra play, with risk defined above the resistance zone and reward p
GOLD H1 – THE WOLF WAVE SCENARIO IS FORMINGHello trader 👋
Gold has surged back strongly after a nearly 70-point drop yesterday. Currently, the price is fluctuating around the newly established ATH, with the potential to extend short-term targets towards 3,960 – 4,000 if the upward trend continues to hold.
On the H1 chart, the price structu

LiamTrading – Follow the Buy trend, target ATH 3915
The gold market continues to demonstrate the strength of an upward trend. After yesterday's shakeout, we witnessed a very clear Long Squeeze: all buying forces were forced to exit, but immediately after, the price quickly rebounded. This is the hallmark of a strong trend – the more it shakes out,

Market just swept stoploss – time for the next 1000 pips BUY📊 Trading Plan for Today
Main Trend: Gold has broken structure (BOS) and built strong bullish momentum. The recent sharp drop was a stoploss sweep – a liquidity grab before the next leg up.
Buy Zone:
CP Order Buy Zone: 3786 – 3784
Stop Loss: 3779
Targets (TP):
Short-term: 3820 – 3840 (Fib 1.0

ATH $3871: Shutdown Fear & 97% Fed Cut Fuel Gold Surge
Hello, investors and traders!
Gold continues to show phenomenal strength, setting a new ATH at $3,871.45/oz (on Sept 30), and closing at $3,843.43/oz. This gain confirms the strongest September since 2011, solidly confirming the explosive growth trend for the yellow metal.
Fundamental Analysis: P

“Gold Price Action: Bullish Momentum with Key Correction ZonesAnalysis of XAU/USD (Gold Spot)
The chart shows a clear uptrend channel, supported by higher highs and higher lows.
Price recently pulled back after testing the $3,915 zone, which is acting as a short-term resistance.
Multiple support zones are highlighted (around $3,760 and $3,700), which can pr

XAUUSD – Gold Daily Plan | Sharp Drop, What’s Next?Gold printed a sudden 70+ point drop from 388x to 380x, leaving traders questioning:
– Was this a big player manipulation?
– Or simply institutional profit taking?
Key reaction zones will define if Gold holds above 3800 or dives deeper.
📍 Critical Levels
🔴 SELL Reaction Zone
387x → Strong resista

Will crude drop to $61.70?hello,
according to my analysis on 2h time frame there is high probability that crude oil futures could drop to 61.7 IN FEW HOURS,

Gold Sets Record Close, Will Bulls Push Toward 3900 Next?Gold printed another all time high yesterday and closed with the strongest daily, monthly, and quarterly close on record. As expected with month-end and EOQ flows, we saw a phase of profit booking, but price quickly found support around the psychological 3800 level and Weekly R1 (3806), which is hol

See all futures ideas
USD/JPY H4 – SMC Mapping & Trading Plan1. Market Structure
Overall trend: bullish, with multiple Break of Structure (BOS) to the upside.
Currently in a corrective pullback, retesting demand zones.
Strong liquidity resting below around 146.000 (Buy Zone Liquidity).
2. Key Zones
Sell Zone (Supply/CP):
148.500 – 148.800
Supply zone a

FXHUNTER / GBPUSDGBPUSD symbol analysis: The trend of this symbol is currently bearish and in this situation we have a supply area with a liquidity area formed near it and most likely a Hunter Stop is forming.

Buy Trade - USD/JPYGreetings to everyone!
You can place a buy trade on USD/JPY and check out my chart for the ideal entry, stop-loss & target placement.
Remember :-
* Move your SL to breakeven once the trade reaches 1:1 R.
* Aim for a minimum reward of 1:1.5 R.
* Don't risk more than 3% of your total margin.

AUDUSD Buy Setup - Breakout & RetestAUDUSD is showing strength after bouncing from a daily order block and aligning perfectly with the 0.79 Fibonacci discount zone. The higher timeframe context is setting the stage for a clean upside move, but we need confirmations before execution.
🔑 Key Levels to Watch
Entry Trigger: A 4H candle clo


Euro Dollar Analysis – Corrective Rebound or Bearish Setup?EUR/USD continues to operate within a controlled market cycle. The sharp decline earlier this week highlighted strong bearish momentum, followed by a corrective rebound that served as a liquidity reset. This rebound is less about trend reversal and more about rebalancing order flow after an aggressi

AUDCAD besrish ( Sell )📌 Trade Plan (AUDCAD)
Sell Limit (Entry Zone):
0.91514
0.91493
Stop Loss (SL): Just above the marked “Caution” zone (around 0.91680–0.91700 area).
Take Profit (TP):
TP Liquidity: 0.90767
---
📌 Why Sell?
Price retesting supply zone (Caution area).
Wyckoff distribution + UTAD test conflu

AUDJPY MULTI TIME FRAME ANALYSISHello traders , here is the full multi time frame analysis for this pair, let me know in the comment section below if you have any questions , the entry will be taken only if all rules of the strategies will be satisfied. wait for more price action to develop before taking any position. I suggest yo

EURUSD, NFP WEEKEU in a weekly looks good for sells
in Dialy tf we have a clean sell FVG at the place we have one 4H candle indicating that it need to go down in until the one 4H candle close in downwards direction
In entry time frame which is 15M have a clean engulfing candle at the sell FVG of 15M

See all forex ideas
| - | - | - | - | - | - | - | - | ||
| - | - | - | - | - | - | - | - | ||
| - | - | - | - | - | - | - | - | ||
| - | - | - | - | - | - | - | - | ||
| - | - | - | - | - | - | - | - | ||
| - | - | - | - | - | - | - | - | ||
| - | - | - | - | - | - | - | - | ||
| - | - | - | - | - | - | - | - | ||
| - | - | - | - | - | - | - | - |
Trade directly on the supercharts through our supported, fully-verified and user-reviewed brokers.


