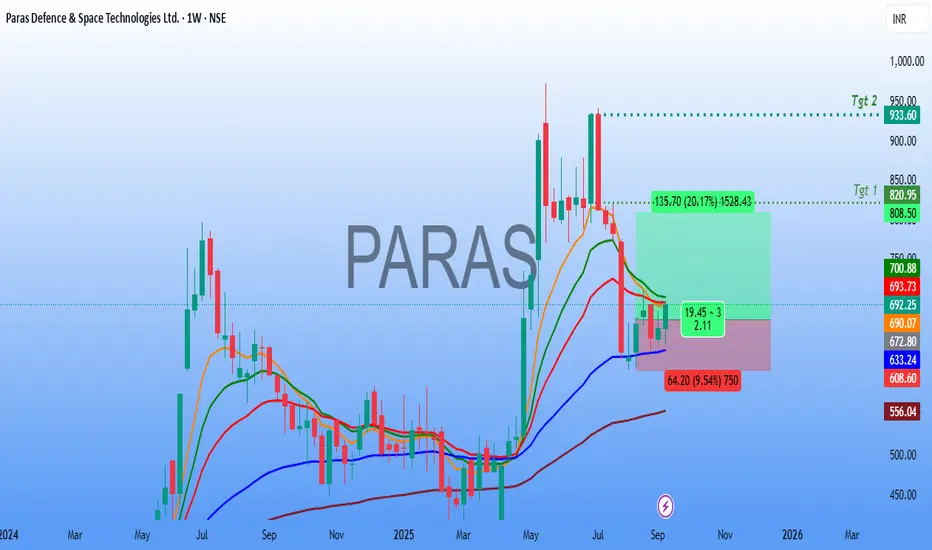
Paras Defence Technical Analysis🚀 Paras Defence & Space Technologies Ltd – Weekly Chart Analysis
The stock is showing signs of a potential reversal after consolidating near key support zones.
🔎 Technical Observations
Price Action:
After a prolonged decline from the highs, the stock has stabilized around the ₹640–660 support regi

The best trades require research, then commitment.
Get started for free$0 forever, no credit card needed

Scott "Kidd" PoteetThe unlikely astronaut

Where the world does markets
Join 100 million traders and investors taking the future into their own hands.
Major indices
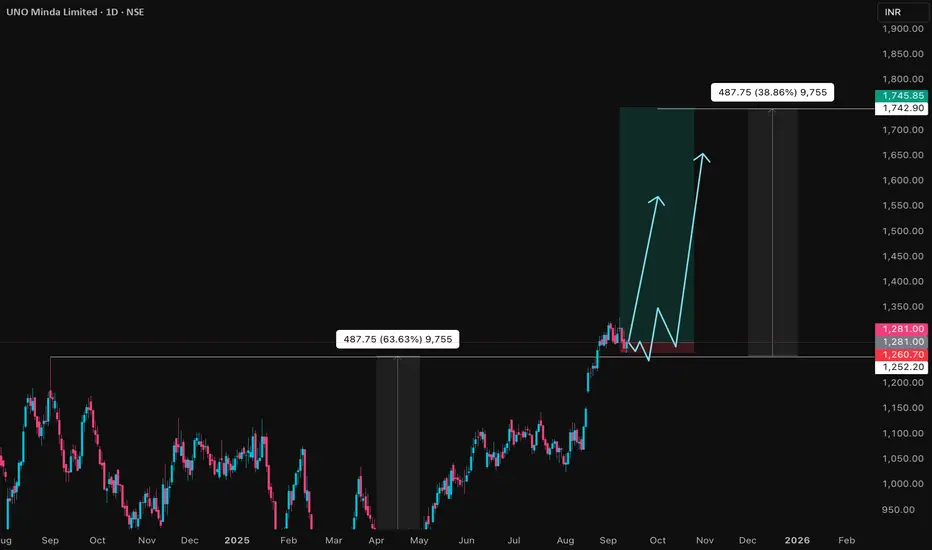
UNOMINDA Price ActionUNO Minda Ltd is trading at ₹1,282 as of September 12, 2025, delivering consistent financial and operational outperformance. For FY25, the company posted consolidated revenue of ₹16,775 crore, up 20% year-on-year, with net profit rising 9% to ₹936 crore. EBITDA grew 18% to ₹1,800 crore, and operatin
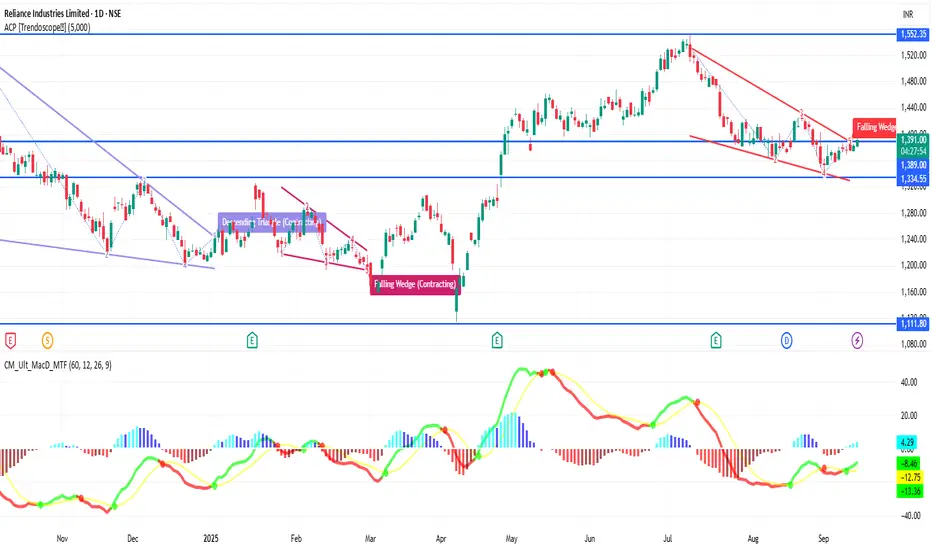
RELIANCE 1D Time frame🔢 Current Level
RELIANCE is trading around ₹1,391 – ₹1,392
🔑 Key Resistance & Support Levels
Resistance Zones:
₹1,392 – ₹1,396 (near-term resistance; breakout above this may lead to further upside)
₹1,400 (psychological resistance)
₹1,427 (stronger resistance above)
Support Zones:
₹1,380 – ₹
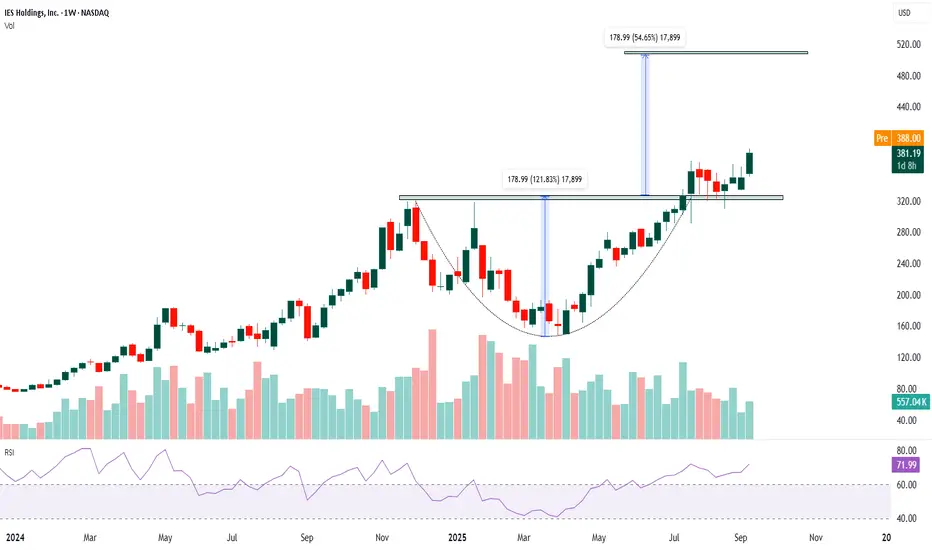
IESC- Long The chart shows a clear uptrend over the past year.
Price formed a rounded bottom (cup-shaped base) and has broken above the neckline near $320–$330, confirming a bullish continuation pattern. Current price around $381 indicates sustained bullish strength.
Volume rose meaningfully during the breakou
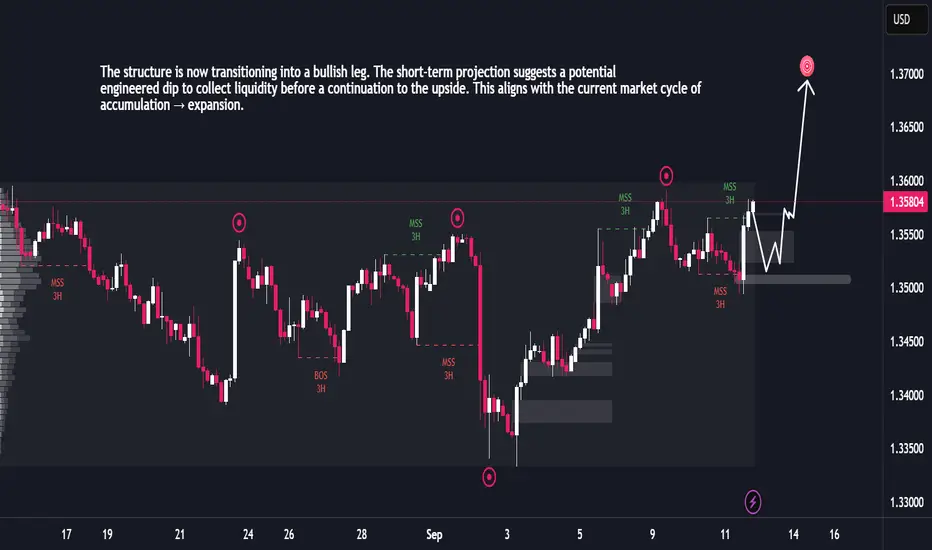
GBPUSD Ready for Expansion After Liquidity GrabThe market has been trading within a broad range, characterized by multiple liquidity grabs on both highs and lows. Each sweep has been followed by sharp reactions, confirming active smart money positioning. Recent price action shows a strong recovery after a downside liquidity sweep, indicating acc
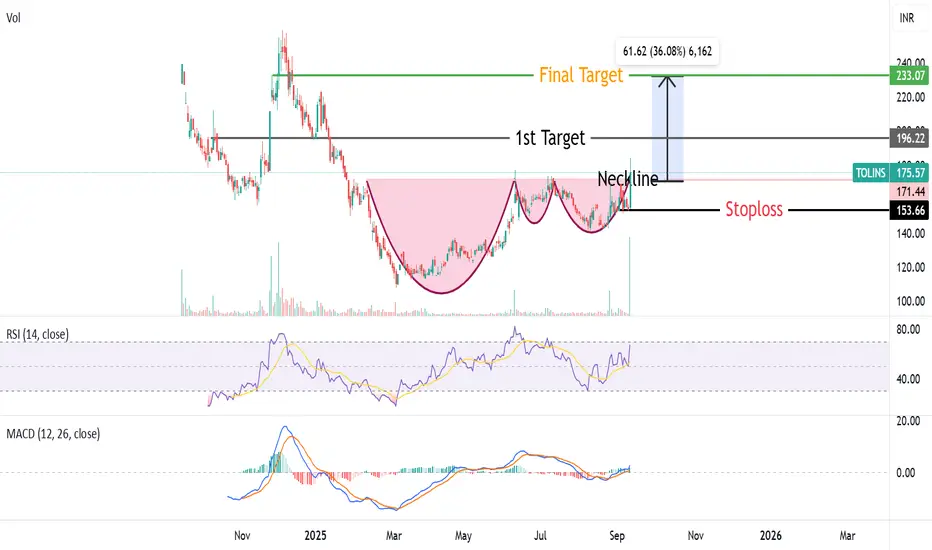
Complex Cup & Handle Pattern Breakout in TOLINS TyresTolins Tyres given Complex Cup & Handle Pattern Breakout from neckline arround 170 level. RSI & MACD also showing positive momentum ,Stock also trading above all important moving averages(50,10,200).Target of this breakout will be 230 Rs ,With a stoploss of 150Rs.
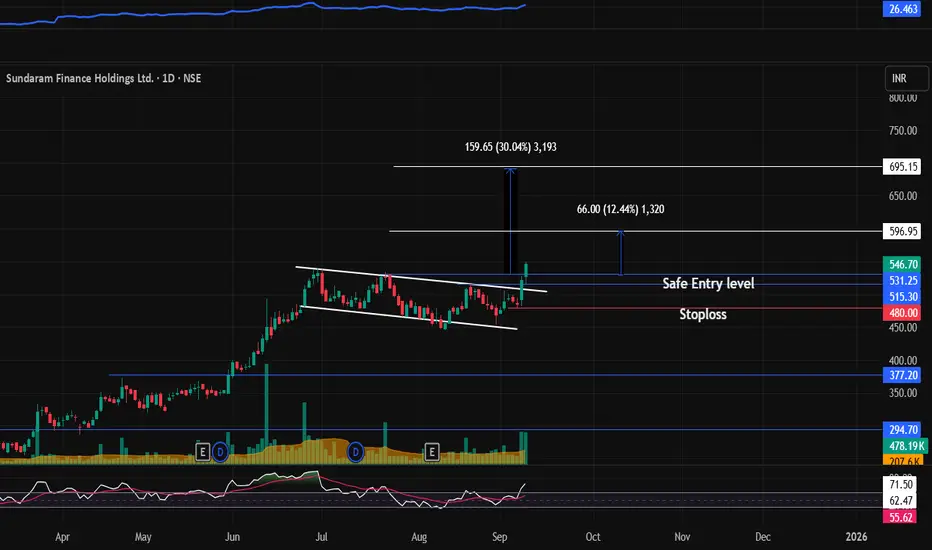
SUNDARMHLD : Breakout stock (Swing pick)#SUNDARMHLD #flagbreakout #breakoutstock #channelbreakout #swingtrading #momentumtrading
SUNDARMHLD : Swing / Short term (1-3 months)
>> Flag Breakout or Channel Breakout
>> Good Strength in stock
>> Volumes picking up
>> Low PE Stock
>> Swing Traders can Look for 10-12% Levels & Short term traders
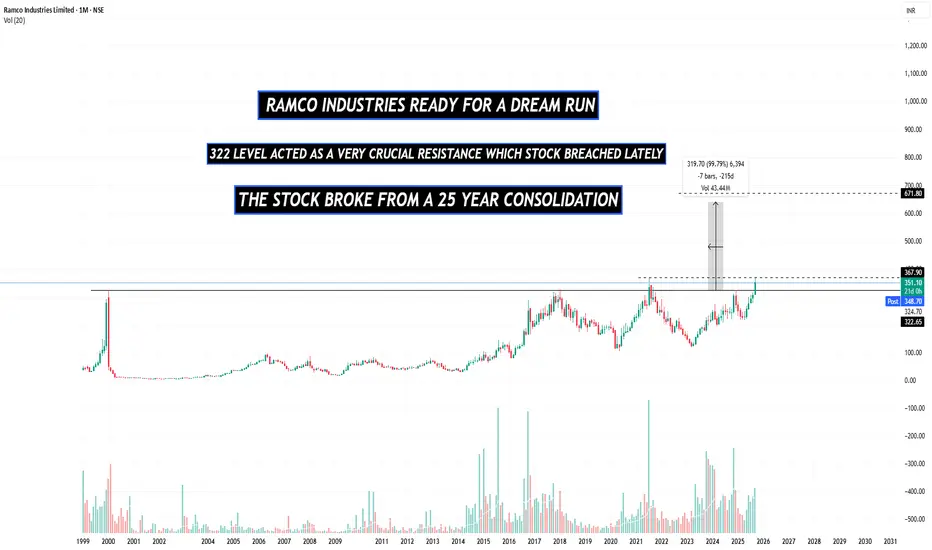
RAMCO INDUSTRIES NEAR MULTIYEAR BREAKOUTThe stock has not been able to breach the crucial resistance of 322 since 1999, pretty strange.
but now the the stock ha rallied past that level with good momentum enforcing further trust in the stock
The stock is also trading below it's book value of 488 again a pretty strange yet interesting op
The Power of Trendline Angles : My Full time trading ExperienceBreaking Down Three Critical Trendline Structures - A Complete Analysis
Structure 1: The Power of Steep Angles (Primary Focus)
The first structure showcases what I consider the gold standard of trendline breakouts. Notice how the trendline is significantly tilted/slanted rather than following a gra
Apollo Tyre - SMC AnalysisTechnical Analysis (SMC Method)
Even it is formed bullish choch and trendline breakout in the weekly timeframe, it has to break the crucial resistance zone in daily timeframe (between 488 & 500) for confirmation. Once it's broken in daily timeframe the estimate target price will be 535/540.
== ED

See all editors' picks ideas
Volume by Time [LuxAlgo]The Volume by Time indicator collects volume data for every point in time over the day and displays the average volume of the specific dataset collected at each respective bar.
The indicator overlays the current volume and the historical average to allow for better comparisons.
🔶 USAGE
Thr

FlowScope [Hapharmonic]FlowScope: Uncover the Market's True Intent 🔬
Ever wished you could look inside the candles and see where the real action is happening? FlowScope is your microscope for the market's flow, designed to give you a powerful edge by revealing the volume distribution that price action alone can't sh

VWAP Price ChannelVWAP Price Channel cuts the crust off of a traditional price channel (Donchian Channel) by anchoring VWAPs at the highs and lows. By doing this, the flat levels, characteristic of traditional Donchian Channels, are no more!
Author's Note: This indicator is formed with no inherent use, and serves

Fibonacci Sequence Circles [BigBeluga]🔵 Overview
The Fibonacci Sequence Circles is a unique and visually intuitive indicator designed for the TradingView platform. It combines the principles of the Fibonacci sequence with geometric circles to help traders identify potential support and resistance levels, as well as price expansio

ATAI Volume Pressure Analyzer V 1.0 — Pure Up/DownATAI Volume Pressure Analyzer V 1.0 — Pure Up/Down
Overview
Volume is a foundational tool for understanding the supply–demand balance. Classic charts show only total volume and don’t tell us what portion came from buying (Up) versus selling (Down). The ATAI Volume Pressure Analyzer fills that g

Market Cap Landscape 3DHello, traders and creators! 👋
Market Cap Landscape 3D. This project is more than just a typical technical analysis tool; it's an exploration into what's possible when code meets artistry on the financial charts. It's a demonstration of how we can transcend flat, two-dimensional lines and step into

ZigzagLiteLibrary "ZigzagLite"
Lighter version of the Zigzag Library. Without indicators and sub-component divisions
method getPrices(pivots)
Gets the array of prices from array of Pivots
Namespace types: Pivot
Parameters:
pivots (Pivot ) : array array of Pivot objects
Returns: array array

ZigzagLibrary "Zigzag"
Zigzag related user defined types. Depends on DrawingTypes library for basic types
method tostring(this, sortKeys, sortOrder, includeKeys)
Converts ZigzagTypes/Pivot object to string representation
Namespace types: Pivot
Parameters:
this (Pivot) : ZigzagTypes/Pivot

Angled Volume Profile [Trendoscope]Volume profile is useful tool to understand the demand and supply zones on horizontal level. But, what if you want to measure the volume levels over trend line? In trending markets, the feature to measure volume over angled levels can be very useful for traders who use these measures. Here is an att

MathEasingFunctionsLibrary "MathEasingFunctions"
A collection of Easing functions.
Easing functions are commonly used for smoothing actions over time, They are used to smooth out the sharp edges
of a function and make it more pleasing to the eye, like for example the motion of a object through time.
Easing function

See all indicators and strategies
Community trends

Paras Defence Technical Analysis🚀 Paras Defence & Space Technologies Ltd – Weekly Chart Analysis
The stock is showing signs of a potential reversal after consolidating near key support zones.
🔎 Technical Observations
Price Action:
After a prolonged decline from the highs, the stock has stabilized around the ₹640–660 support regi
BSE ChartIts Bullish Trade I have published this chart
To publish a chart on TradingView, open a chart, then click the blue "Publish" button at the top right of the screen. Select "Publish idea," add a title and description explaining your analysis, choose the idea type (Analysis or Tutorial)

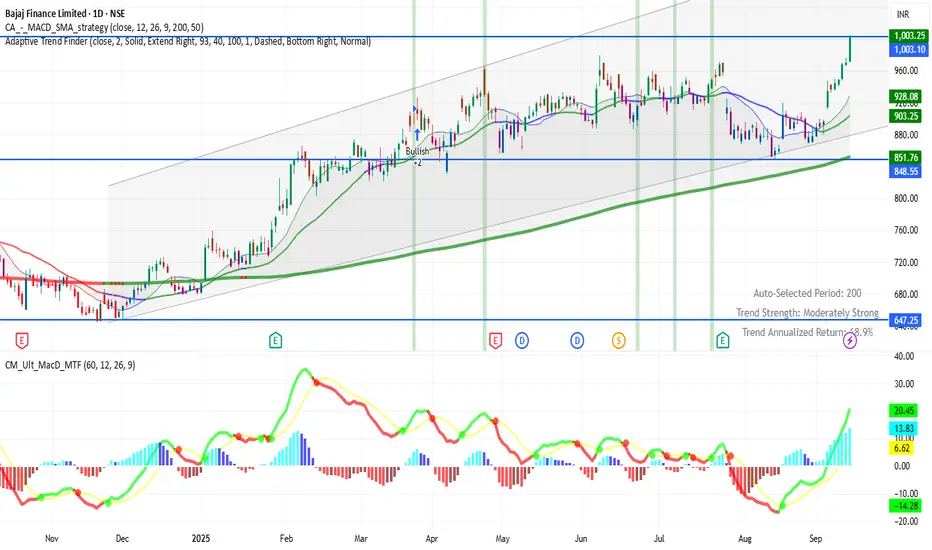
BAJFINANCE 1D Time frameCurrent Market Situation
Bajaj Finance is trading around ₹1003 in the daily chart. This level is very important because the stock has just touched its 52-week high near ₹1005. On the lower side, today’s support level is around ₹970 – ₹975, which is also close to the previous closing price.
The ove
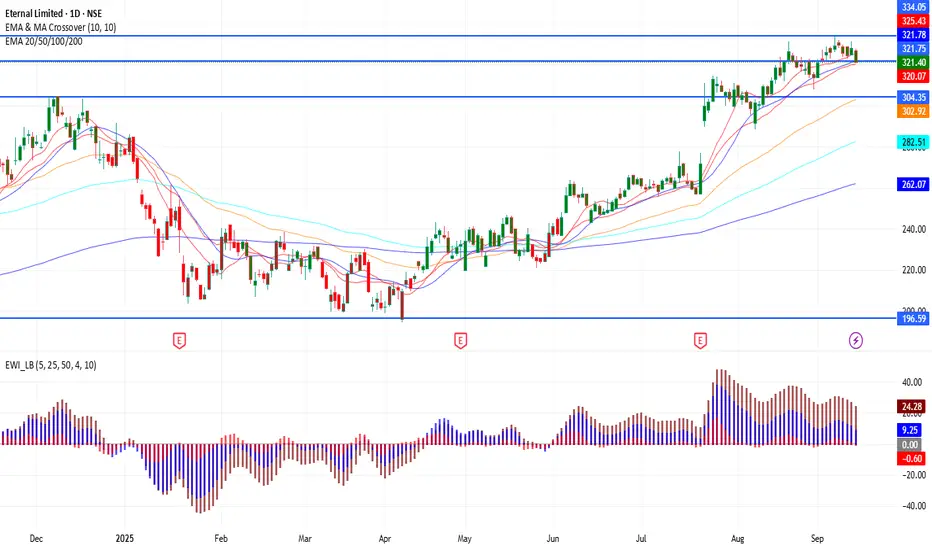
ETERNAL 1D Time frame📍 Current Price
₹321.45
Short-Term Outlook
Bullish Scenario: A sustained move above ₹327.90 could lead to a test of the 52-week high around ₹334.40.
Bearish Scenario: A drop below ₹315.00 may signal a potential pullback toward the ₹300.00 level.
Maruti Suzuki . Multi time frame analysisThe price is forming a very narrow range consolidation between 15300 and 15360 in the one-hour time frame. The price can give a breakout from here or test the trend line before moving up.
In the daily time frame, we can see double top resistance around the 15370 and 15388 zones.
Using this analysi

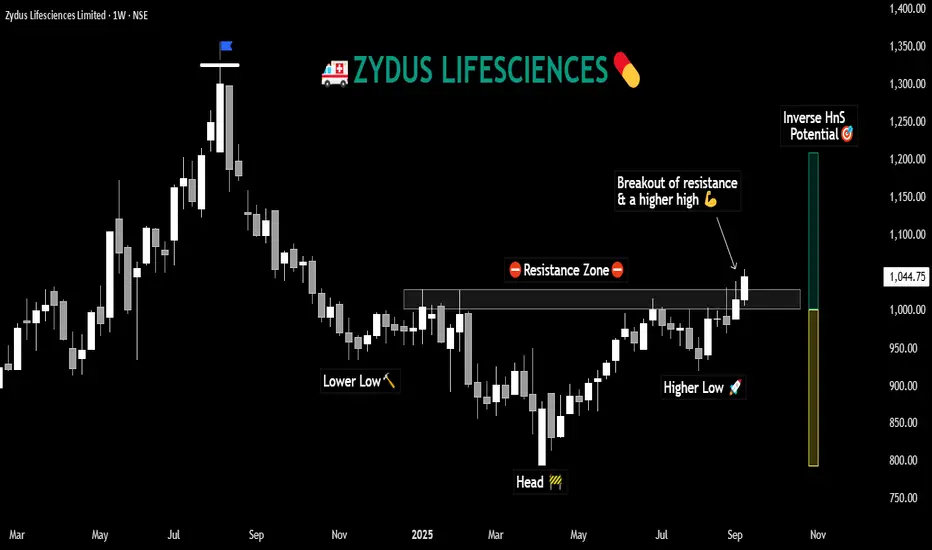
ZYDUS- Inverted Head and Shoulders PatternPattern Under Observation
⬜️ The Inverted Head and Shoulders (HnS) is one of those patterns that tells us that market might have done falling and is getting ready to rise again. An inverted HnS after a bearish run is the reciprocal of a HnS pattern at the top of a rally.
⬜️ The psychology behind
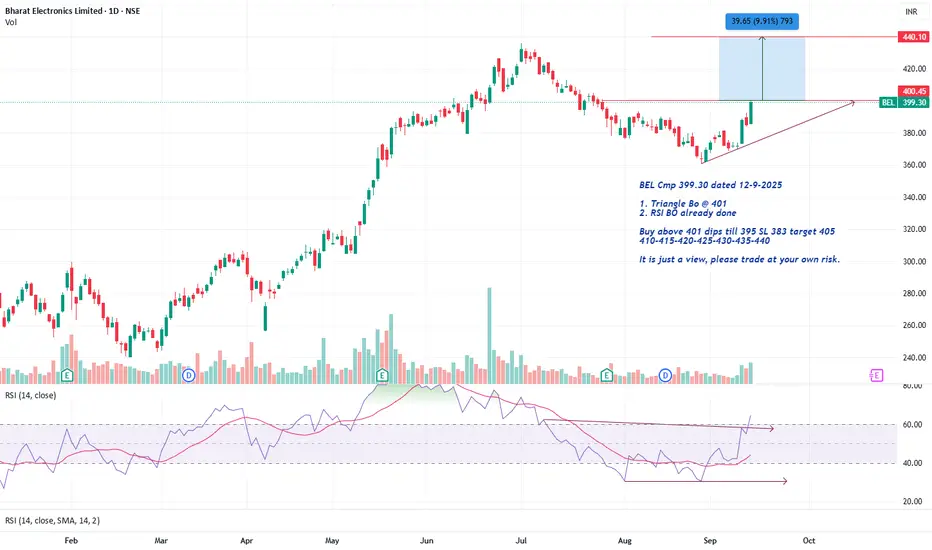
BEL Cmp 399.30 Triangle BOBEL Cmp 399.30 dated 12-9-2025
1. Triangle Bo @ 401
2. RSI BO already done
Buy above 401 dips till 395 SL 383 target 405
410-415-420-425-430-435-440
It is just a view, please trade at your own risk.
UNOMINDA Price ActionUNO Minda Ltd is trading at ₹1,282 as of September 12, 2025, delivering consistent financial and operational outperformance. For FY25, the company posted consolidated revenue of ₹16,775 crore, up 20% year-on-year, with net profit rising 9% to ₹936 crore. EBITDA grew 18% to ₹1,800 crore, and operatin
BUY TODAY SELL TOMORROW for 5%DON’T HAVE TIME TO MANAGE YOUR TRADES?
- Take BTST trades at 3:25 pm every day
- Try to exit by taking 4-7% profit of each trade
- SL can also be maintained as closing below the low of the breakout candle
Now, why do I prefer BTST over swing trades? The primary reason is that I have observed that

See all stocks ideas
No scheduled reports
Community trends
BITCOIN CRASH PREDICTIONAs per the chart pattern of Bitcoin USD Chart, there is a possibility of a downtrend and crash in bitcoin till 80k levels as major order blocks are pending on Daily / Weekly / Monthly charts. With a stop loss of 118234, a short position can be initiated for a target of 107000 short term of 2 weeks a

Ethereum sell sign in 15 min as per indicator To identify potential short-selling opportunities in the stock market, technical indicators can signal a stock is overbought, losing momentum, or entering a downtrend. Short-selling is a high-risk strategy, and these indicators are most effective when used togeth

BTC Weekly AOI Rejection | 4H Engulfing ConfirmationPrice tapped into the weekly AOI and showed strong rejection with a clean 4H bullish engulfing. Weekly structure still bullish, and rejection suggests continuation to the upside. Expecting momentum toward the $124k–$144k zone if price sustains above $110k support.
Weekly Rejection from AOI
4H E
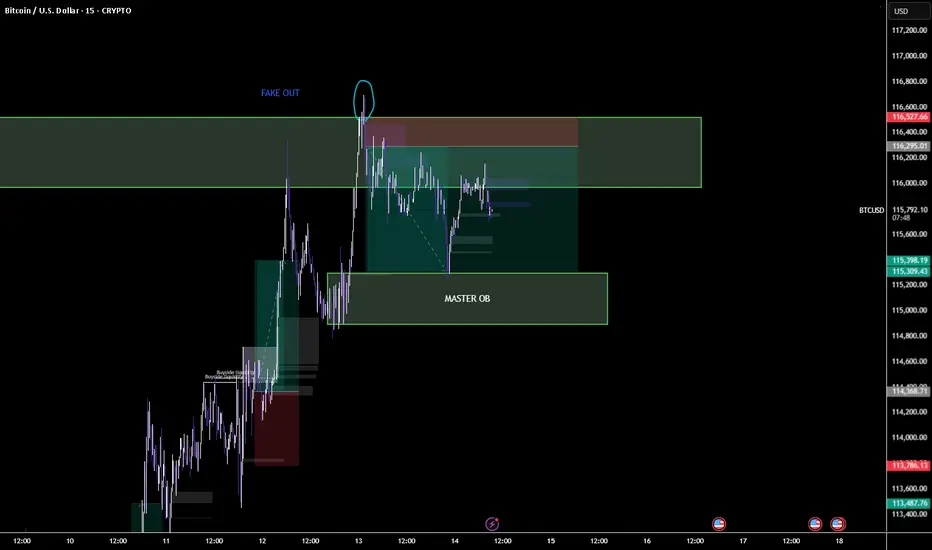
BTCUSD - Fakeout Trap & Master Order Block Setup
BTCUSD – Fakeout Trap & Master Order Block Setup
Price executed a clean **fakeout above liquidity** before dropping back into the **master order block zone**. This setup shows how liquidity hunts trap late buyers before respecting key OB demand. Watching for reaction from the **115.3k zone** to
BTC/USD: Resistance in Play – Is a Pullback Coming?BTC/USD is facing a crucial test at the top of its ascending channel. As the price reaches this resistance zone, a pullback seems likely, with support at 113,500 USD acting as the next key level.
If the bulls manage to defend this support, we could see the uptrend resume, pushing BTC/USD to new hig

BTCUSDT Elliott Wave Analysis (2H Chart)Currently tracking a 5-wave Elliott structure:
Wave (1) initiated the bullish impulse.
Wave (2) retraced back with healthy correction.
Wave (3) extended strongly, showing momentum.
Wave (4) completed with a corrective pullback.
Wave (5) is in progress, approaching the liquidity zone between 117

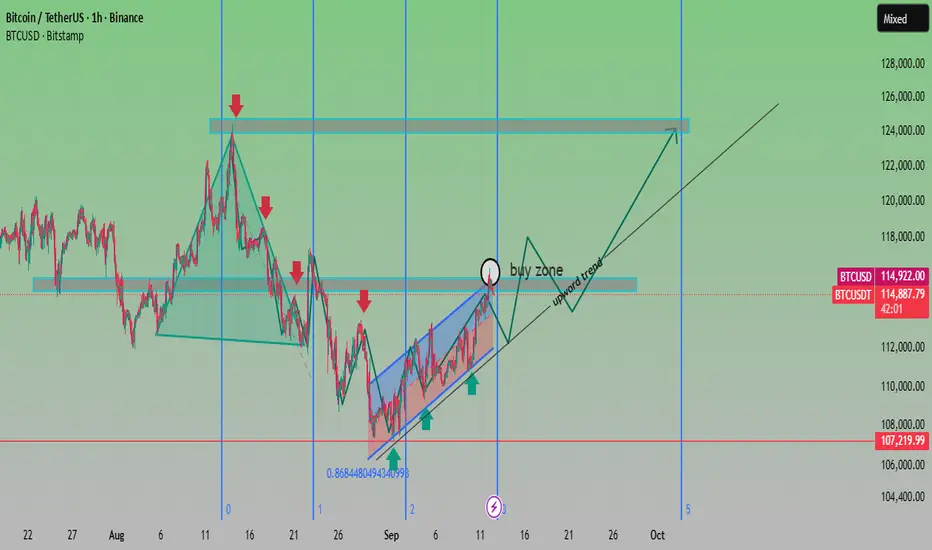
BTC Buy Zone Forming – Potential Bullish Breakout AheadAnalysis:
Trend Structure: After a corrective decline from the $124K resistance area, BTC has rebounded strongly, forming a rising channel (highlighted in blue).
Support Levels: Strong demand observed near $107,200, aligning with the 0.868 Fibonacci retracement, making it a crucial support zone.
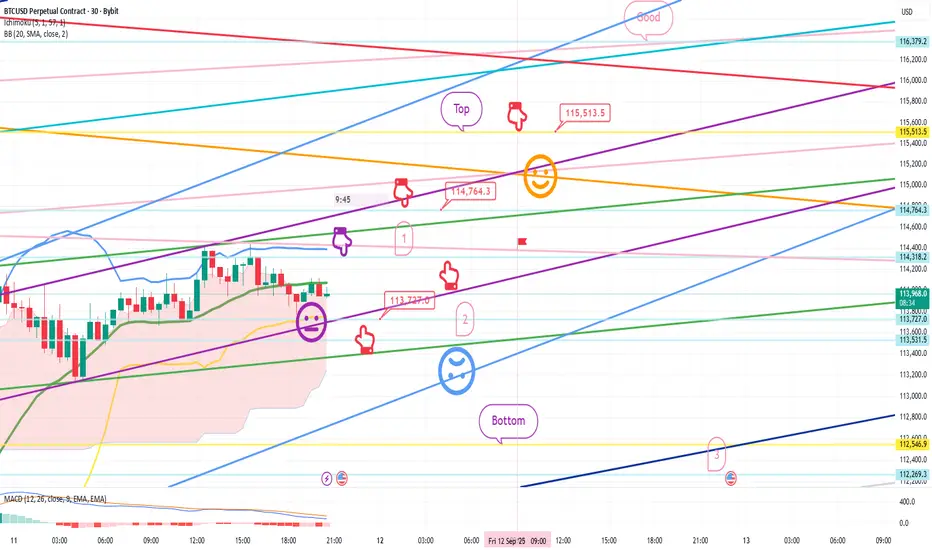
Bitcoin Bybit chart analysis September 11 (CPI)Hello
It's a Bitcoin Guide.
If you "follow"
You can receive real-time movement paths and comment notifications on major sections.
If my analysis was helpful,
Please click the booster button at the bottom.
This is Bitcoin's 30-minute chart.
The CPI indicator will be released shortly at 9:30 AM.
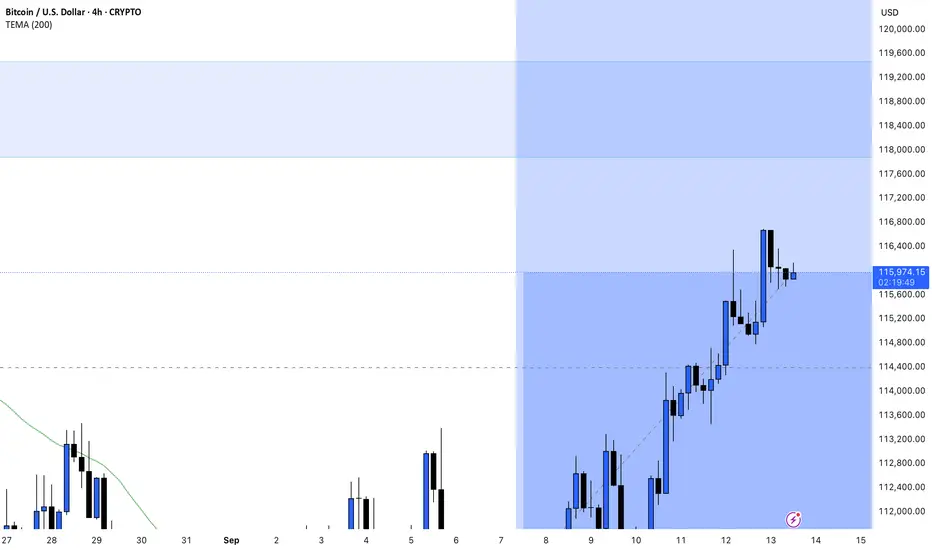
BTCUSD | Buy & Sell Setup | 14 Sep 2025 – 10:58 ISTBTCUSD | Buy & Sell Setup | 14 Sep 2025 – 10:58 IST
Buy Zone: 116094.90 – 115961.20
Sell Zone: 115694.50 – 115411.20
Scenario : Buy
Entry: 115975.00
Stop Loss: 115690.00
Targets:
TP1 → 116257.50
TP2 → 117000.00
Analysis:
From Buy Zone (116094.90 – 115961.20) creates possibilities for a buy move

Btc long setupEntry Zone
🔵 $114,800 – $115,500
Stop-Loss
🔴 $113,800
Targets
🎯 TP1: $117,700
🎯 TP2: $118,700 – $119,000
Confluence:
Liquidity sweep ✅
Demand OB ✅
Discount entry
Imbalance fill ✅
Setup is asymmetric: Risk ~1% for potential 3–4% reward in 3–7 days.

See all crypto ideas
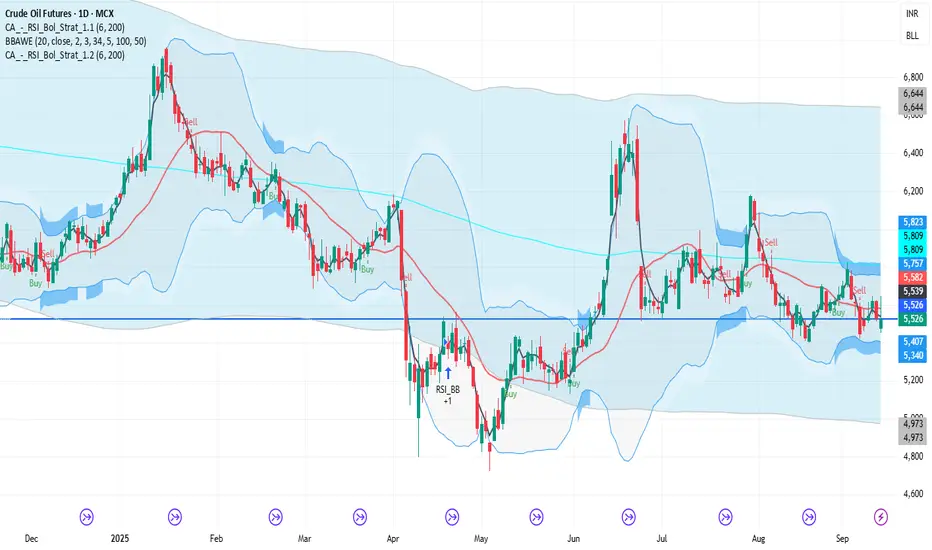
CRUDEOIL1! 1D Time frame📉 Current Market Snapshot (as of September 13, 2025)
Previous Close: ₹5,526
Day's Range: ₹5,454 – ₹5,647
Open: ₹5,480
Close: ₹5,530
📊 Key Levels
Support: ₹5,495, ₹5,442
Resistance: ₹5,663, ₹5,800, ₹5,865
Trading Analysis for Gold Spot / U.S. Dollar (15-Minute Chart)Sorry I am late in giving the signal but I will say that manipulation in XAU/USD is at extreme level. Keep portfolio at least $1000.
Take buy position in XAU/USD as much as possible.
Not more than $3630.00.
Target 1 3353.00
Target 2 3358.00
Target 3 3365.00
Target 4 3372.00
SL 3630.00
Based

NATURALGAS1! 1D Time frame📍 Current Price
₹261
🔑 Key Levels
Immediate Resistance: ₹268 → ₹272
Immediate Support: ₹257 → ₹253
52-Week High: ₹366
52-Week Low: ₹188
Short-Term Outlook
Bullish Scenario: Sustained above ₹272 → possible move toward ₹280–₹285
Bearish Scenario: Falls below ₹257 → may test ₹253–₹250

XAUUSD | FED leaning toward 50bps cut? | Buy strategy at support🟡 XAU/USD – 12/09 | Captain Vincent ⚓
🔎 Captain’s Log – Market Context
The probability of a FED -50bps cut next week has risen to 10.9% (from 8%), while a -25bps scenario is almost certain.
US jobless claims rose sharply → reflecting a weakening labor market, reinforcing expectations of FED e

XAUUSD – Breakout Confirmed & Macro Outlook📊 Market Context & Macro View
Gold (XAUUSD) has broken out above its short-term descending trendline, signalling renewed bullish momentum after several sessions of consolidation. This breakout aligns with traders pricing in slower US inflation and growing confidence that the Federal Reserve may paus

[MCX] Gold Short IdeaNote -
One of the best forms of Price Action is to not try to predict at all. Instead of that, ACT on the price. So, this chart tells at "where" to act in "what direction. Unless it triggers, like, let's say the candle doesn't break the level which says "Buy if it breaks", You should not buy at all.
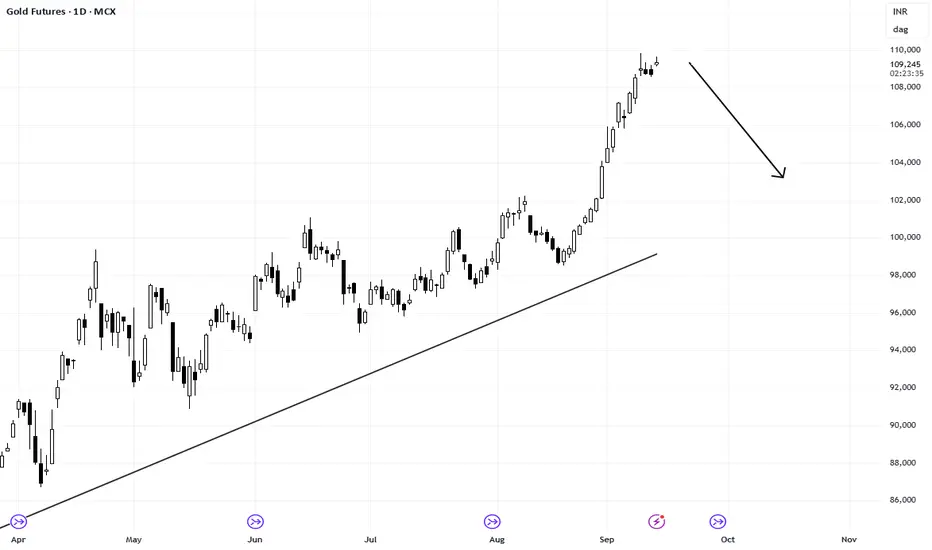
Gold /XAUUSD View -Analysis (May not Correct)Gold is still in a range and moving in between the Day High and Day Low .
As per the level marked in the chart , it can have two views One is bullish and other one is bearish.
Bullish : It might again touch the all time high and retrace back
Bearish : It might go down 3600 level and reverse .
So

Gold - Buy near 3640, target 3657-3674Gold Market Analysis:
Yesterday, gold prices saw a wild swing throughout the day due to the CPI. Gold initially fell, breaking support at a low near 3613. Buying activity took off immediately on the data. Today, we're still looking for volatility. Keeping in mind the broader trend, buying into vola

Gold’s Surge – An Opportunity You Can’t Miss!Hello everyone, what are your thoughts on the OANDA:XAUUSD trend?
Yesterday, just as we predicted, gold had a strong surge! The precious metal skyrocketed from 3612 USD to 3653 USD, gaining over 400 pips in a short period of time.
So, what’s behind this move? The answer lies in the new unemploy

Gold Dips Pre-CPI: Fed Cut Buzz Fuels Indian Trade Ops!Namaste, traders! Gold (XAU/USD) is easing today (11/09/2025) after yesterday’s PPI shocker—US wholesale inflation dropped more than expected, boosting Fed rate cut bets to 100% for a 0.25% cut and rising odds for 0.5% (CME FedWatch). Tonight’s CPI and Jobless Claims at 19:30 ET will shed light on U

See all futures ideas
AUDUSD(20250912)Today's AnalysisMarket News:
U.S. initial jobless claims surged to 263,000 in the week ending September 6, reaching a near four-year high. Traders are fully pricing in three Federal Reserve interest rate cuts by the end of 2025.
Technical Analysis:
Today's Buy/Sell Levels:
0.6636
Support and Resistance Levels:

GBPUSD Ready for Expansion After Liquidity GrabThe market has been trading within a broad range, characterized by multiple liquidity grabs on both highs and lows. Each sweep has been followed by sharp reactions, confirming active smart money positioning. Recent price action shows a strong recovery after a downside liquidity sweep, indicating acc
USDJPY Sell entry 1::5 RnRUSDJPY is forming a beautiful day trade for selling side. It can be a very good intraday trade if everything goes as per plan.
1. Price kissed 4H Iceberg Block and showed sniper liquidity and left bearish FVGs at both 30m and 15m.
2. 15m FVG is inside 30m FVG and upper side of OTE area.
3. Now it i

Bearish Signal at BreakoutThe AUDCAD is on strong Buy side since the start of this month. Enough to be in overbought area.
The Channel / Rising wedge is confirming its strong buy on H1 timeframe.
Now we are waiting for the breakout of this Rising Wedge. Yet we will not trade unless it doesn't break its Lower High at 0.9

NZDJPY SELLSNZDJPY tapped the top of daily supply, aligning with the 88.0 region. While 4H structure is bullish, higher timeframes take priority. Price already flipped 15M structure, giving early bearish confirmation. Short makes sense here with a conservative stop above the daily high. And also if you look at

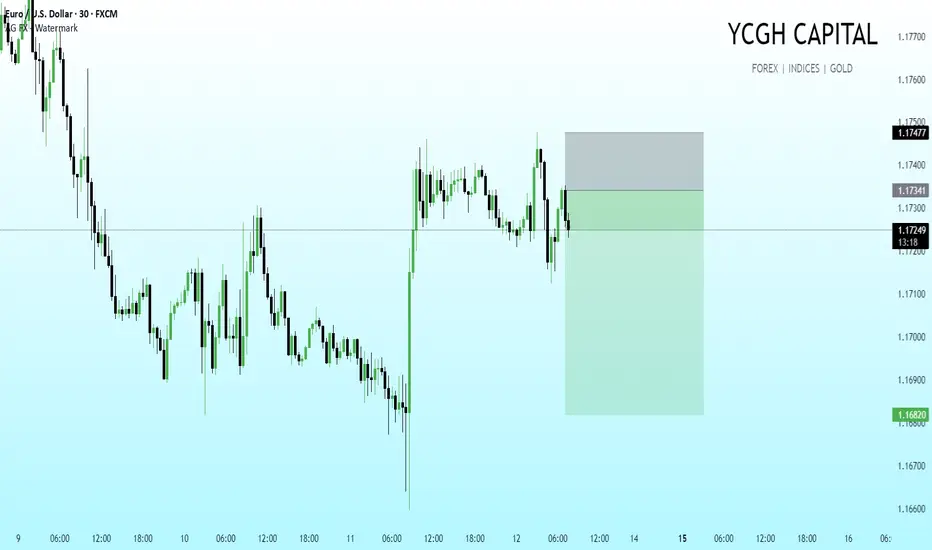
EUR/USD | 30M | Live Execution Zone
We’ve marked out our trade zone post-CPI. Price tapped into our supply pocket at 1.1747 and is now reacting as anticipated. Position structured with:
Entry at the rejection from supply
Stop above the sweep zone
Target the lower liquidity pool near 1.1680
Key narrative: Market took out liquidit
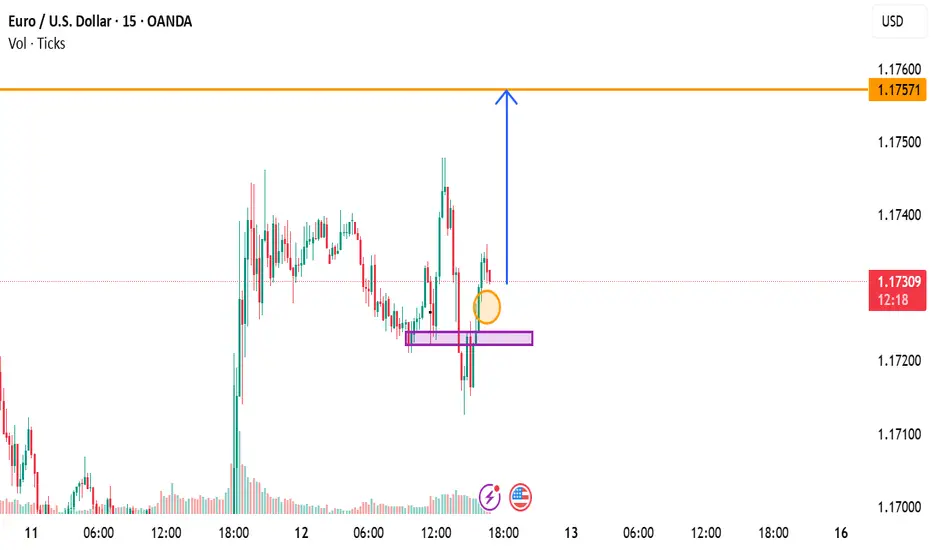
EURUSD Buy SetupPrice has successfully retested a key support zone (marked in purple) and is showing strong bullish momentum on the 15-minute chart. This retest confirms buyers are stepping back in.
📌 Entry: 1.1732
📌 Target: 1.17798
This setup offers a favorable risk-to-reward ratio, aiming for a clean move back
USDJPY | Buy & Sell Setup | 12 Sep 2025 – 11:25 ISTUSDJPY | Buy & Sell Setup | 12 Sep 2025 – 11:25 IST
Buy Zone: 148.190 – 147.479
Sell Zone: 147.278 – 146.979
Scenario : Buy
Entry: 147.603
Stop Loss: 147.090
Targets:
TP1 → 148.181
TP2 → 149.137
Analysis:
From Buy Zone (148.190 – 147.479) creates possibilities for a buy move.
Scenario 2 : Sell

BUY GBPNZD📊 Trade Idea: BUY GBPNZD
The GBP is showing resilience supported by strong economic outlook, while NZD remains under pressure from weaker global risk sentiment and softer commodity demand. This creates a bullish setup for GBPNZD.
🔹 Technical Outlook:
Price is trading above the 2.26756 support zon

See all forex ideas
| - | - | - | - | - | - | - | - | ||
| - | - | - | - | - | - | - | - | ||
| - | - | - | - | - | - | - | - | ||
| - | - | - | - | - | - | - | - | ||
| - | - | - | - | - | - | - | - | ||
| - | - | - | - | - | - | - | - | ||
| - | - | - | - | - | - | - | - | ||
| - | - | - | - | - | - | - | - | ||
| - | - | - | - | - | - | - | - |
Trade directly on the supercharts through our supported, fully-verified and user-reviewed brokers.


