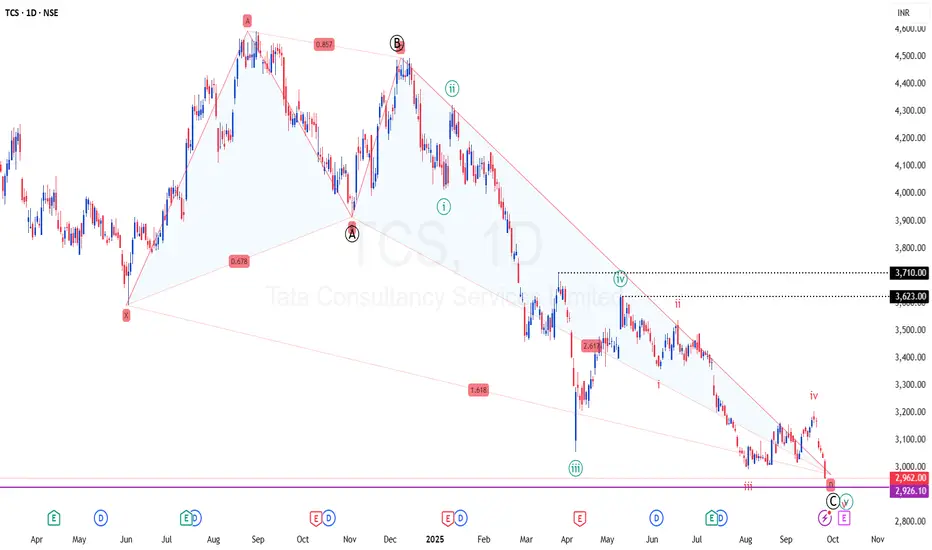
TCS - Time to go up towards 3500+ Bullish CRAB PRZ at play
TF: Daily
CMP: 2965
Here is my previous post on this script for a detailed review.
Price has completed the potential target as per the Bullish Crab pattern.
Results are due in the next couple of weeks.
I expect the stock to bounce from this zone 2900-2950 and potentially march towards 3500+ i

The best trades require research, then commitment.
Get started for free$0 forever, no credit card needed

Scott "Kidd" PoteetThe unlikely astronaut

Where the world does markets
Join 100 million traders and investors taking the future into their own hands.
Major indices
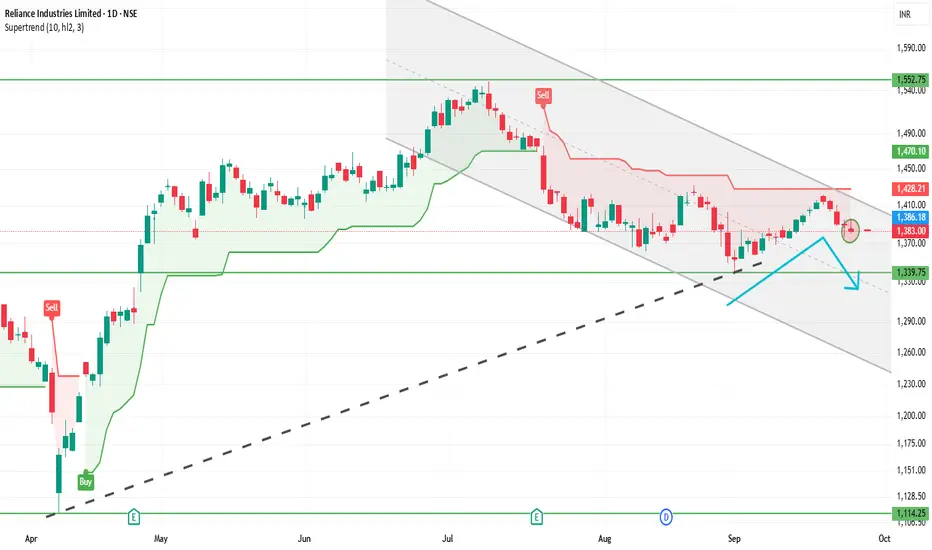
RELIANCE 1D Time frame📊 Reliance Daily (1D) Snapshot
Close: Around ₹1,382
Range of the Day: High near ₹1,396, Low near ₹1,380
Trend: Slight weakness on daily chart (mild red candle)
Stock is consolidating between support and resistance zones.
🎯 Key Daily Levels
Support Zone: ₹1,350 – ₹1,365
Strong Support: ₹1,330
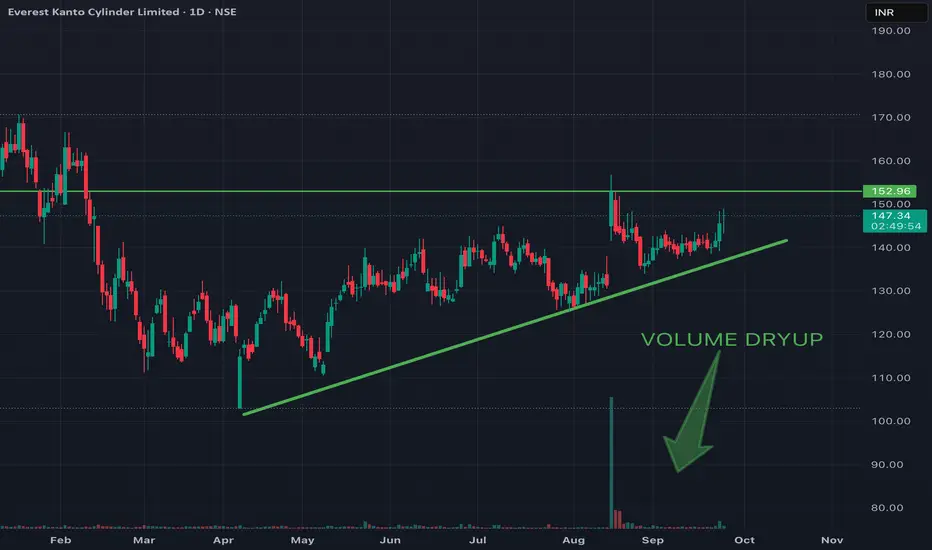
EKC LOOKING GOOD FOR 10-20% MOVE1. Volume dry-up near breakout zone.
2. Trendline Support.
3. Price sustaining at above levels and ready to move upwards from demand zone.
4. Easy 10-20% move possible.
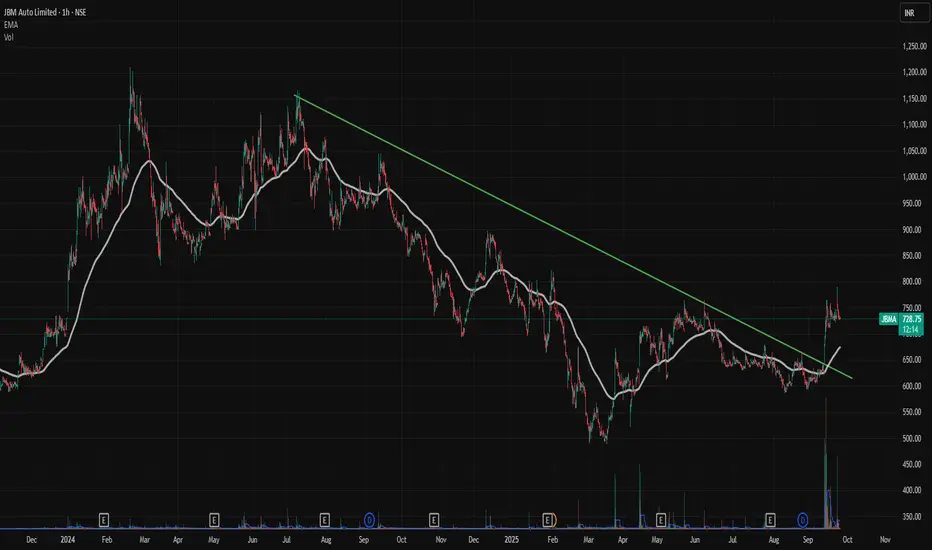
Gapup breakout in JBMAA good good gap up in JBMA.
Very healthy volumes showing up.
Very good time to enter as consolidating after gapup
Trendline breakout also.
good setup
can enter on 1 hr time frame
Risk to Reward ratio 1:2 or higher .
Thank u
Abdul Maajid Gouri
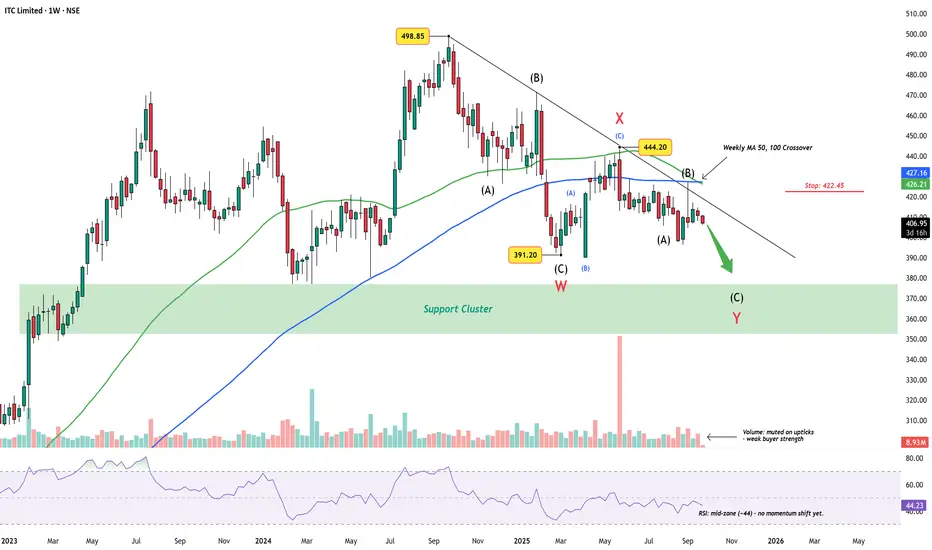
ITC Limited Weekly Chart – Wave Y Targets Support ClusterITC has been trending lower since the ₹498.85 peak, carving out what appears to be a complex W-X-Y correction. The first leg (W) found support near ₹391.20, followed by a corrective bounce into X at ₹444.20. The decline since then has kept price under a descending trendline, respecting the larger co
Tanla Platforms : Inverted Head & Shoulder in making Tanla Platforms is forming a inverted head and Shoulder pattern right shoulder . On Friday last week , the stock is just around the neckline .
The Stock just started holding above 50 and 200 DMA.
RSI daily reading is above 70 indicating a positive momentum.
Need to be watchful in next week , i

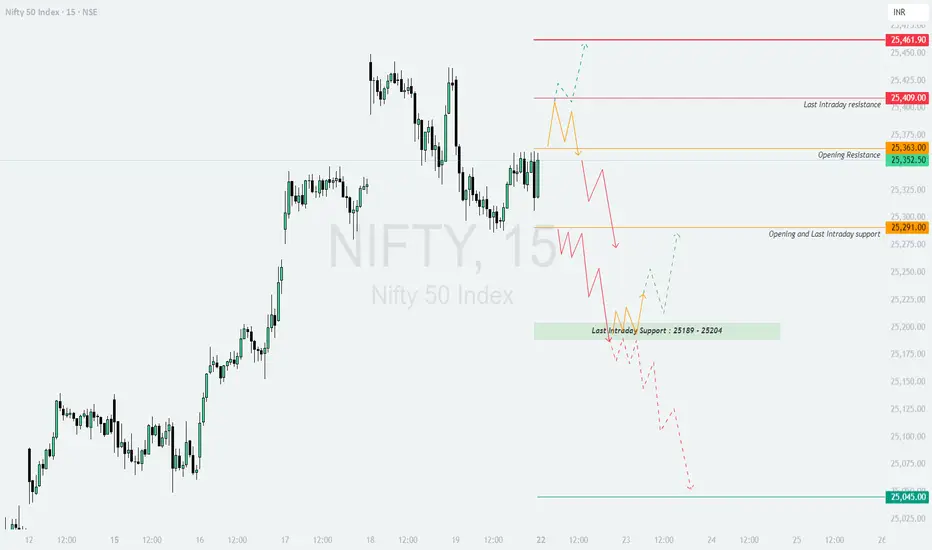
NIFTY : Trading levels and Plan for 22-Sep-2025NIFTY TRADING PLAN – 22-Sep-2025
The index closed around 25,352, with immediate opening resistance at 25,363, and higher hurdles near 25,409 (last intraday resistance) and 25,461. On the downside, supports are placed at 25,291 (opening/last intraday support) and the 25,189–25,204 zone. The critica
Positive moves on beaten down stock(Adani Green)Posititive news has come for the adani group from higher court. Adani Green is beaten down stock(may be not because of news flows but because of valuation). But now buying is there from the lower levels.
Valuations have come down in last 2-3 years(however still expensive valuation). But may be this

Sigachi’s Technical Surge: Next Resistance in SightOver the past month, Sigachi traded within a well-defined consolidation range, reflecting a period of equilibrium between buyers and sellers. However, in the most recent week, the stock decisively broke out above this consolidation zone on increased trading volume a classic signal of renewed bulli

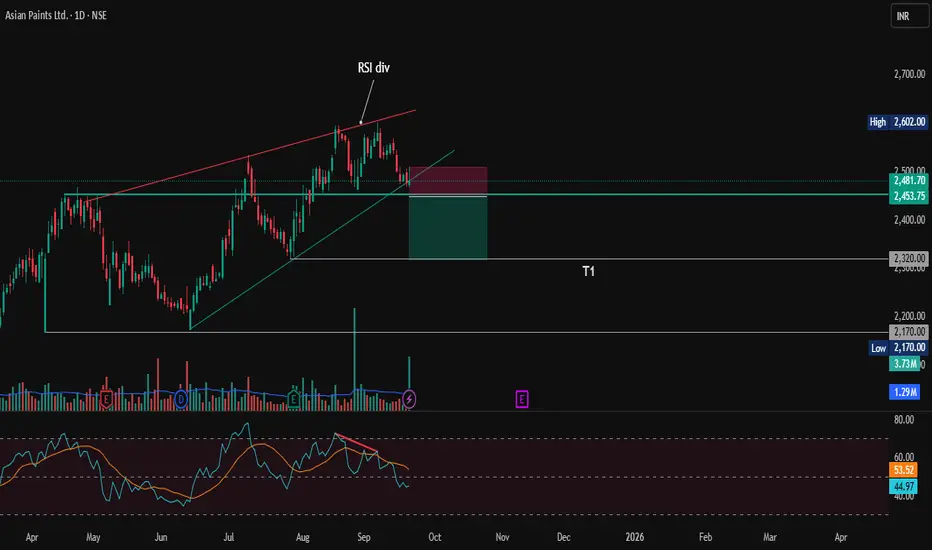
Asian Paints: Short Setup — Bearish Reversal SignalAsian Paints shows signs of a potential short opportunity after forming a bearish reversal pattern (Rising wedge) on the daily chart. The stock failed to sustain above the resistance near 2600, Formed a Double top pattern. The RSI is showing bearish divergence, signaling weakening momentum. hinting
See all editors' picks ideas
FiniteStateMachine🟩 OVERVIEW
A flexible framework for creating, testing and implementing a Finite State Machine (FSM) in your script. FSMs use rules to control how states change in response to events.
This is the first Finite State Machine library on TradingView and it's quite a different way to think about your

Trading Activity Index (Zeiierman)█ Overview
Trading Activity Index (Zeiierman) is a volume-based market activity meter that transforms dollar-volume into a smooth, normalized “activity index.”
It highlights when market participation is unusually low or high with a dynamic color gradient:
Light Blue → Low Activity (thin p

Expected Value Monte CarloI created this indicator after noticing that there was no Expected Value indicator here on TradingView.
The EVMC provides statistical Expected Value to what might happen in the future regarding the asset you are analyzing.
It uses 2 quantitative methods:
Historical Backtest to ground your anal

Bar Index & TimeLibrary to convert a bar index to a timestamp and vice versa.
Utilizes runtime memory to store the 𝚝𝚒𝚖𝚎 and 𝚝𝚒𝚖𝚎_𝚌𝚕𝚘𝚜𝚎 values of every bar on the chart (and optional future bars), with the ability of storing additional custom values for every chart bar.
█ PREFACE
This library aims to tackle s

Liquidity Void Detector (Zeiierman)█ Overview
Liquidity Void Detector (Zeiierman) is an oscillator highlighting inefficient price displacements under low participation. It measures the most recent price move (standardized return) and amplifies it only when volume is below its own trend.
Positive readings ⇒ strong up-move

DeltaFlow Volume Profile [BigBeluga]🔵 OVERVIEW
The DeltaFlow Volume Profile builds a compact volume profile next to price and enriches every bin with flow context : bullish vs. bearish participation (%), a per-bin Delta % , an optional Delta Heat Map , and a PoC band with the bin’s absolute volume. This lets you see not just

Volume by Time [LuxAlgo]The Volume by Time indicator collects volume data for every point in time over the day and displays the average volume of the specific dataset collected at each respective bar.
The indicator overlays the current volume and the historical average to allow for better comparisons.
🔶 USAGE
Thr

FlowScope [Hapharmonic]FlowScope: Uncover the Market's True Intent 🔬
Ever wished you could look inside the candles and see where the real action is happening? FlowScope is your microscope for the market's flow, designed to give you a powerful edge by revealing the volume distribution that price action alone can't sh

VWAP Price ChannelVWAP Price Channel cuts the crust off of a traditional price channel (Donchian Channel) by anchoring VWAPs at the highs and lows. By doing this, the flat levels, characteristic of traditional Donchian Channels, are no more!
Author's Note: This indicator is formed with no inherent use, and serves

Fibonacci Sequence Circles [BigBeluga]🔵 Overview
The Fibonacci Sequence Circles is a unique and visually intuitive indicator designed for the TradingView platform. It combines the principles of the Fibonacci sequence with geometric circles to help traders identify potential support and resistance levels, as well as price expansio

See all indicators and strategies
Community trends
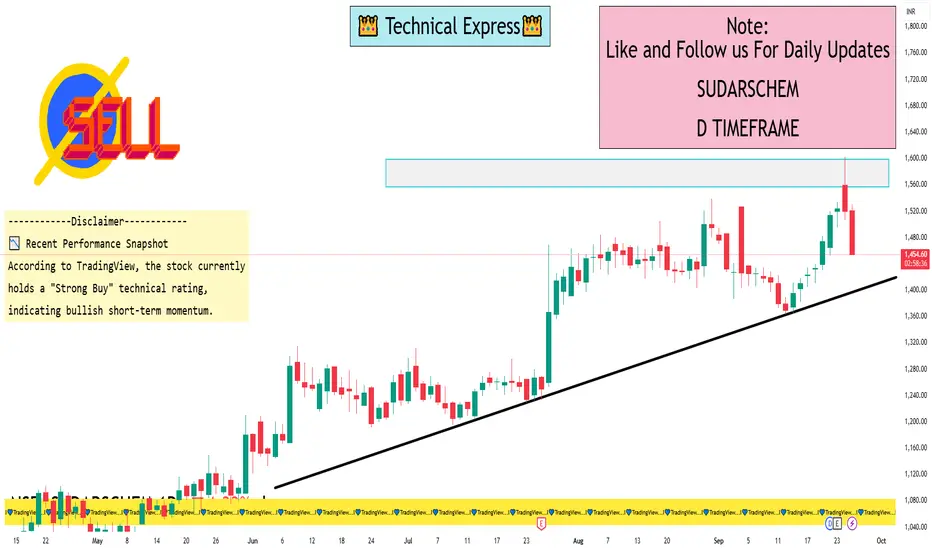
SUDARSCHEM 1 Day View📊 Key Intraday Levels
Opening Price: ₹1,521.00
Day’s High: ₹1,529.80
Day’s Low: ₹1,454.40
Previous Close: ₹1,520.50
VWAP (Volume-Weighted Average Price): ₹1,489.72
Upper Circuit Limit: ₹1,824.60
Lower Circuit Limit: ₹1,216.40
📈 Technical Overview
According to TradingView, the stock currentl
RELIANCE 1D Time frame📊 Reliance Daily (1D) Snapshot
Close: Around ₹1,382
Range of the Day: High near ₹1,396, Low near ₹1,380
Trend: Slight weakness on daily chart (mild red candle)
Stock is consolidating between support and resistance zones.
🎯 Key Daily Levels
Support Zone: ₹1,350 – ₹1,365
Strong Support: ₹1,330
TCS - Time to go up towards 3500+ Bullish CRAB PRZ at play
TF: Daily
CMP: 2965
Here is my previous post on this script for a detailed review.
Price has completed the potential target as per the Bullish Crab pattern.
Results are due in the next couple of weeks.
I expect the stock to bounce from this zone 2900-2950 and potentially march towards 3500+ i
EKC LOOKING GOOD FOR 10-20% MOVE1. Volume dry-up near breakout zone.
2. Trendline Support.
3. Price sustaining at above levels and ready to move upwards from demand zone.
4. Easy 10-20% move possible.
Gapup breakout in JBMAA good good gap up in JBMA.
Very healthy volumes showing up.
Very good time to enter as consolidating after gapup
Trendline breakout also.
good setup
can enter on 1 hr time frame
Risk to Reward ratio 1:2 or higher .
Thank u
Abdul Maajid Gouri
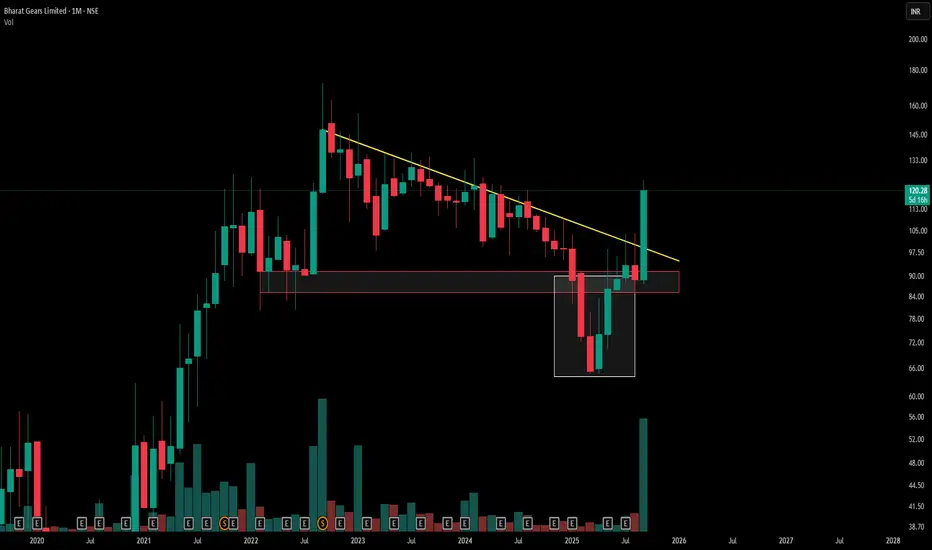
Monthly Descending Triangle & False BreakdownA descending triangle on the monthly chart shows lower highs converging toward a flat support, reflecting mounting seller pressure and key institutional interest at the horizontal base
The red counter trendline highlights corrective rallies within the broader down-sloping resistance.
The red deman
HINDCOPPER H&S BREAKOUTHindcopper breaking H&S pattern weekly
huge volume this week with bullish rsi above 60
target1 375 target2 416
trading above all key ema
NO BUY/SELL RECOMENDATION

BUY TODAY SELL TOMORROW for 5%DON’T HAVE TIME TO MANAGE YOUR TRADES?
- Take BTST trades at 3:25 pm every day
- Try to exit by taking 4-7% profit of each trade
- SL can also be maintained as closing below the low of the breakout candle
Now, why do I prefer BTST over swing trades? The primary reason is that I have observed that

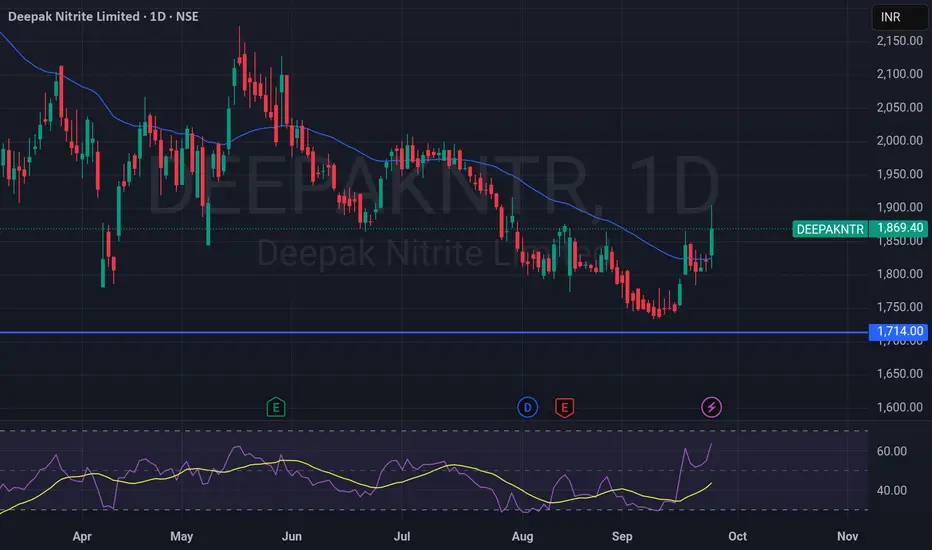
Trend Reversal or Short-Term Pullback Rally?Deepak Nitrite – Trend Reversal or Short-Term Pullback Rally?
📊 Chart Analysis (1D Timeframe)
The stock has recently taken support near the ₹1,714 zone (marked as a strong support level).
Price has bounced sharply from this support and is now trading around ₹1,869, posting a +2.65% gain today.
Th
See all stocks ideas
Oct 8
PLASTIBLENPlastiblends India Limited
Actual
—
Estimate
—
Oct 8
AVANTELAvantel Limited
Actual
—
Estimate
—
Oct 8
JTLINDJTL Industries Limited
Actual
—
Estimate
—
Oct 9
TCSTata Consultancy Services Limited
Actual
—
Estimate
34.52
INR
Oct 9
HCLTECHHCL Technologies Limited
Actual
—
Estimate
15.56
INR
Oct 9
IREDAIndian Renewable Energy Development Agency Ltd.
Actual
—
Estimate
—
Oct 9
ANANDRATHIAnand Rathi Wealth Ltd.
Actual
—
Estimate
—
Oct 9
GMBREWG.M. Breweries Ltd.
Actual
—
Estimate
—
See more events
Community trends
BTC/USD: Bearish Trend After Flash Crash and Key NewsThe BTC/USD chart shows a strong bearish trend following the "flash crash" event and contract liquidations. Currently, BTC is moving within a downward channel with support levels at 110,300 USD and 108,000 USD.
News Impact:
Morgan Stanley to Offer Crypto Trading: Morgan Stanley’s partnership wi

ETH LONG ETH long, buy at 4200 SL IS 4100 TARGET WILL BE 4500
ALL OFF THE NUMBERS ARE IN ROUND Figure
Don't avoid, it is a technical and phycological trade
Let's see guys ,how ETH will perform

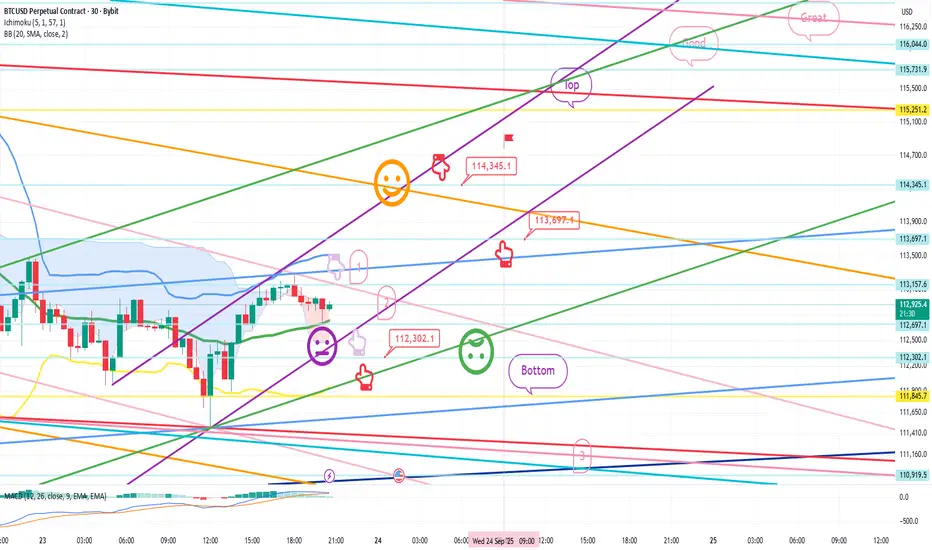
Bitcoin Bybit chart analysis September 23Hello
It's a Bitcoin Guide.
If you "follow"
You can receive real-time movement paths and comment notifications on major sections.
If my analysis was helpful,
Please click the booster button at the bottom.
This is Bitcoin's 30-minute chart.
There's an indicator release near 11:00 AM on the Nasd
BTCUSD Analysis on (24/09/2025)BTCUSD UPDATEDE
Current price- 113700
If price stay above 111000,then next target 115000,117000 and below that 109000
Plan; if price break 113500-112500 area and above that 113500 area,we will place buy oder in BTCUSD with target of 115000,117000 & stop loss should be placed at 111000

btcusdThe live Bitcoin price today is $112591.42 USD with a 24-hour trading volume of $48834864079.08 USD. We update our BTC to USD price in real-time.
$1,12,588.40

BTC LONG SETUPBTC/USDT – 1H Long Setup Analysis
🔹 Current Price: 111,653 USDT (Bitget Perpetual)
🔹 Trend: After a sharp drop from recent highs, BTC is showing signs of forming a base with a possible rebound setup.
⸻
Key Observations:
1. Support Zone:
• Strong support is visible around 110,744 – 110,747 USDT,

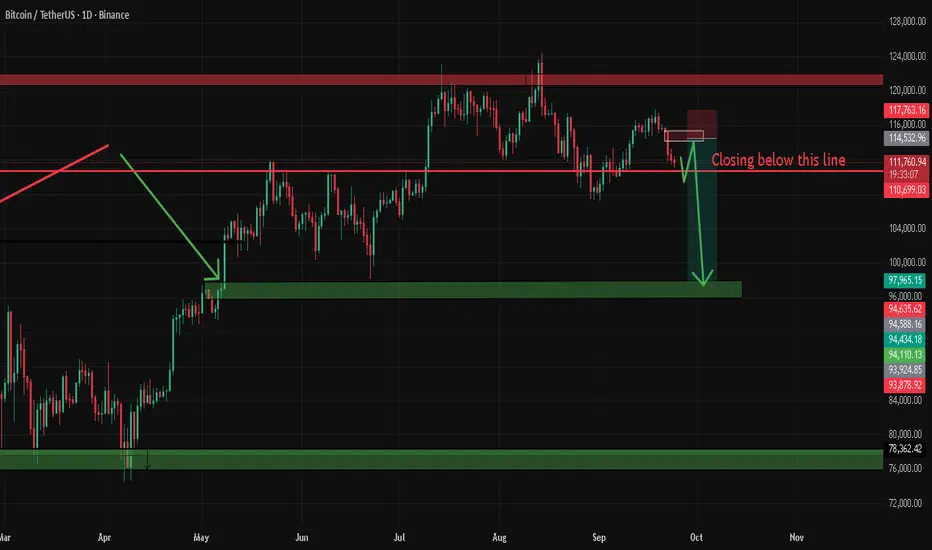
BTCUSDTBitcoin has formed an head and shoulders with 0.5-0.61 ribb rejection recently.
Look for shots only upto 97k

Gold & BitCoin (Neowave Forecast)Namaskaram Everyone
Welcome to intelligent investor, we provide market insights by synchronising and combining all the price action waves from different time frames and gives you single trend.
How To Read My Charts...Click Below

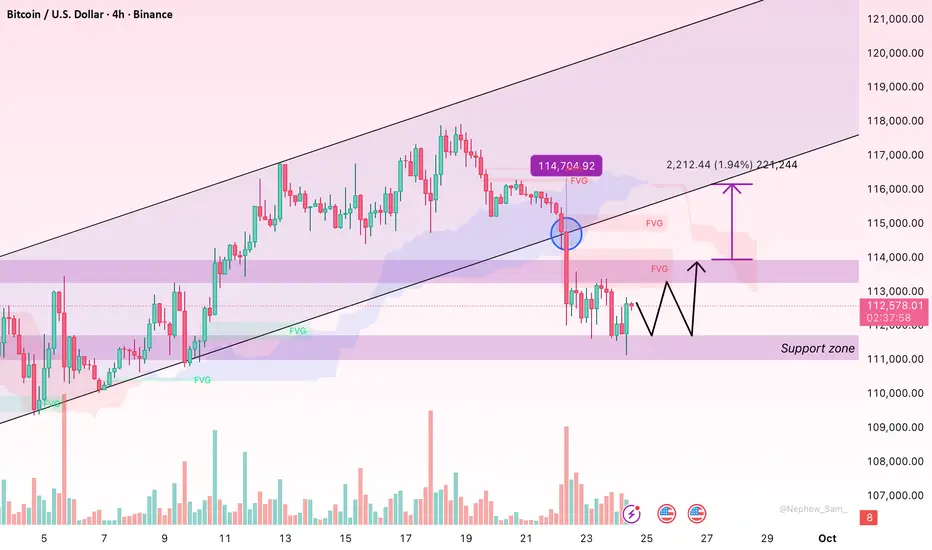
Bitcoin : Short-Term Pullback, Underlying Trend Still PositiveHello everyone,
After reaching the 113,000 USD zone, Bitcoin has seen a short-term correction, but overall the main trend remains intact. On the chart, price action is still trading above the Ichimoku cloud, which serves as a key support area in the event of deeper pullbacks. Fair Value Gaps arou
btc short entry waiting for closing as you can clearly see why i have marked demand and supply and pretty sure for a short trade once it closed below that red line
See all crypto ideas
GOLD TREND TODAY - Support and Resistance - Simple Analysis📈 Trend & Market Structure
XAUUSD
Gold is still in a clear uptrend, respecting higher highs and higher lows on H4.
Recent breakout structures (BOS) confirm bullish order flow, but price is approaching a liquidity zone near $3,800.
On the downside, unmitigated Fair Value Gaps (FVG) and Order Blo

XAU/USD H1 – Gold at Key Resistance, Potential Pullback to 0.618
💥✅🎯On the one-hour (H1) timeframe, the price of gold (XAU/USD) has reached the key resistance level of 3,766–3,770 after a strong bullish rally. This resistance zone coincides with the upper supply area marked in red, as well as the rising orange trendline channel mid-level.
Key points:
Resistanc

XAUUSD Facing Downward PressureHello traders, XAUUSD is currently facing downward pressure following recent economic news. The lower-than-expected unemployment claims data suggests economic stability, reducing the demand for gold. The higher-than-expected PCE core index increases the likelihood that the Fed will maintain high

XAUUSD – Wolfe Waves continue on H4XAUUSD – Wolfe Waves continue on H4, price returns below trendline: prioritise correction scenario
Hello Trader,
Based on the Wolfe Waves structure on the H4 frame and current price behaviour, gold has returned to trading below the trendline, indicating a weakening short-term uptrend and paving th


Gold under EMA pressure Buy at support,short scalp at resistance🟡 XAU/USD – Captain Vincent ⚓
🔎 Captain’s Log – Context & News
FED : Probability of a 25bps cut in October is 91.09% → almost certain.
US Calendar today : GDP, Jobless Claims, Durable Goods Orders, and especially speeches from 3 FED officials → strong volatility expected.
Gold yesterday : D

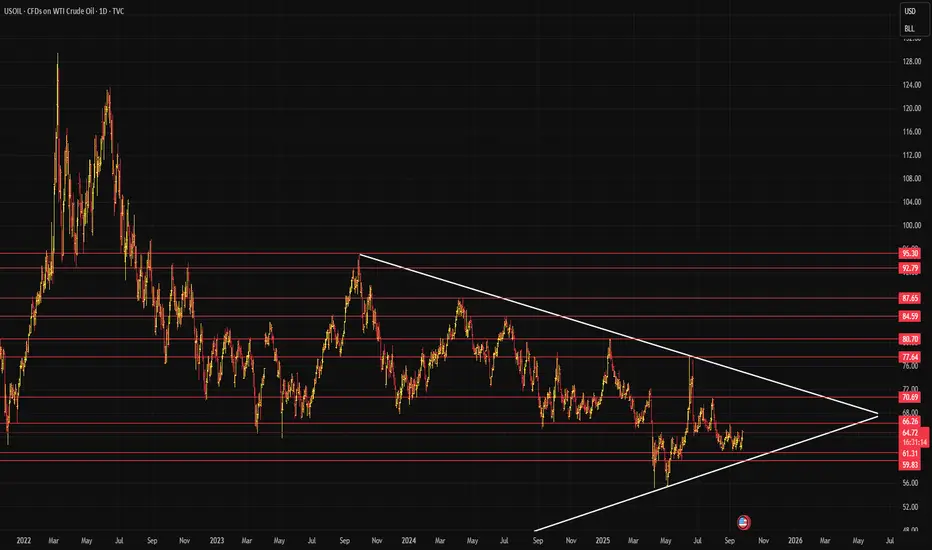
Looks like USOIL Crude has just started risingLooks like USOIL Crude has just started rising with SL near 60 / 62.
XAUUSD SHOWING A GOOD DOWN MOVE WITH 1:10 RISK REWARDXAUUSD SHOWING A GOOD DOWN MOVE WITH 1:10 RISK REWARD DUE TO THESE REASON
A. its following a rectangle pattern that stocked the marketwhich preventing the market to move any one direction now it trying to break the strong resistant lable
B. after the break of this rectangle it will boost the marke

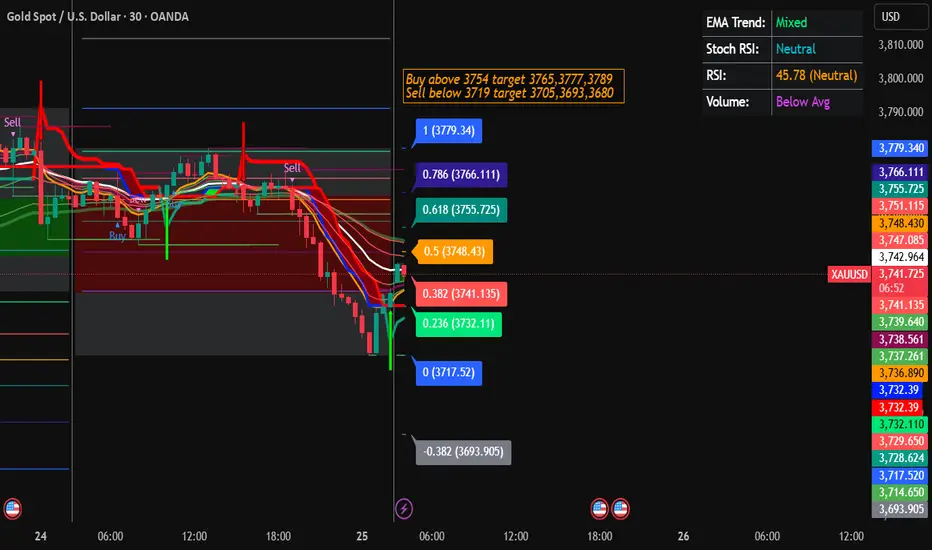
Gold Trading Strategy for 25th September 2025📊 Gold Trading Strategy
🟢 Buy Setup (Bullish)
Entry: Buy above the high of the 15-min candle if it closes above 3754.
Targets:
🎯 Target 1 → 3765
🎯 Target 2 → 3777
🎯 Target 3 → 3789
Stop Loss: Place stop loss just below 3750 (or recent swing low for safer risk management).
Confirmation Tip: Look for
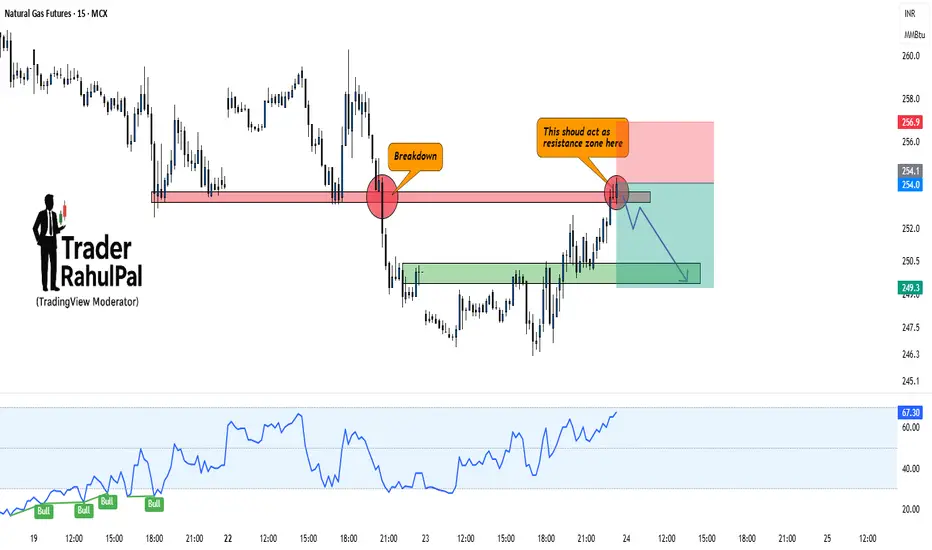
Natural Gas – Breakdown Retest Could Trigger Fresh FallHello everyone, Let's analyse Natural Gas and it has recently broken down from a key support level, turning it into resistance. The price is now retesting that zone, and unless bulls manage to reclaim it strongly, the downside remains the higher probability.
Current Setup:
Previous support arou
See all futures ideas
EURUSD MULTI TIME FRAME ANALYSISHello traders , here is the full multi time frame analysis for this stock , let me know in the comment section below if you have any questions , the position will be taken only if all rules of the strategies will be satisfied. wait for more price action to develop before taking any position. I sugge

USDJPY (Neowave Trading Idea)FX:USDJPY Namaskaram Everyone
Welcome to intelligent investor, we provide market insights by synchronising and combining all the price action waves from different time frames and gives you single trend.
Now Risk Reward is highly favourable
Trading with risk management, that is 1 percent rule

Buy Trade - EUR/USDGreetings to everyone!
You can place a buy trade on EUR/USD and check out my chart for the ideal entry, stop-loss & target placement.
Remember :-
* Move your SL to breakeven once the trade reaches 1:1 R.
* Aim for a minimum reward of 1:1.5 R.
* Don't risk more than 3% of your total margin.

EURUSD BUY PLANPair: EURUSD
Current Price: 1.17415
🔹 Market Context
Price is currently reacting at a very important Order Block (OB) zone.
Daily trend is bullish and aligns with the 4H structure, adding confluence for upside continuation.
Market is showing good upside momentum from this level.
🔹 Trade Idea
Buy Bia

Ote Refinement trade setup for currency .hoping for a long entry set up . after taking out the inducement and fvg associated with the bos .

GBP/AUD WEEKPLAN: Best Sell Zone Short StoplossFootprint Analysis OANDA:GBPAUD
Previous Trend: The candles before the 18th showed an uptrend. Specifically, the candle on the 17th had a strong positive Delta (+5.24K), with the buy volume (green) dominating the sell volume (red) at most price levels. This confirms that buyers were in control a

AUDNZD Trading Idea – Momentum & Liquidity OutlookThe pair has been in a clear expansion phase, showing strength after multiple structure breaks. Momentum has favored the upside, while recent consolidation reflects market participants taking profits and rebalancing orders.
A corrective wave appears to be unfolding, which is typical after strong im

USDJPY TRADE || M15 SETUPPrice aggressively retraced after a sharp bullish rally, sweeping equal lows and tapping into a refined demand zone. Now showing a bullish reaction from the zone with clean imbalance above acting as draw on liquidity.
🔹 Key Notes:
– Liquidity grab below short-term low ✅
– Demand zone tapped + bulli

GBPUSD – Medium-Term H1/H4 Technical Outlook
Overview: GBPUSD has recently broken below its ascending trendline/channel after failing to sustain momentum near the 1.3530–1.3575 supply zone. At present, price is testing the 0.618 retracement (~1.3366), while the RSI (5) is heavily oversold (~13–14). This signals the possibility of a short-ter

GBPJPY Short setupI see the good risk/reward ratio sell setup in GBPJPY as per elliot wave analysis. elliot wave analysis is very complex analysis method and it aways have alternate count, how ever i shorting GBPJPY as it gives good risk/reward ratio.

See all forex ideas
| - | - | - | - | - | - | - | - | ||
| - | - | - | - | - | - | - | - | ||
| - | - | - | - | - | - | - | - | ||
| - | - | - | - | - | - | - | - | ||
| - | - | - | - | - | - | - | - | ||
| - | - | - | - | - | - | - | - | ||
| - | - | - | - | - | - | - | - | ||
| - | - | - | - | - | - | - | - | ||
| - | - | - | - | - | - | - | - |
Trade directly on the supercharts through our supported, fully-verified and user-reviewed brokers.


