PAGEIND M PATTREN BREAKDOWN 31 01 2026📈 1) Pageind Pattern Structure: M-Pattern / Double Top
An M-Pattern (Double Top) is a bearish reversal pattern with the following components:
Left Top → Right Top ≈ equal highs
Neckline → horizontal support connecting the swing lows between tops
Breakdown → close below the neckline confirms the pat

The best trades require research, then commitment.
Get started for free$0 forever, no credit card needed

Scott "Kidd" PoteetPolaris Dawn astronaut

Where the world does markets
Join 100 million traders and investors taking the future into their own hands.

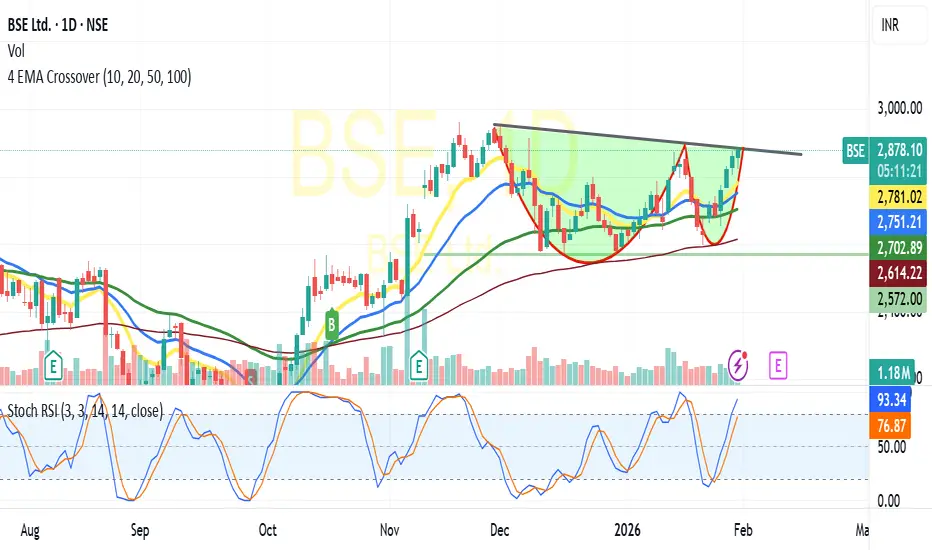
BSE-Likely Cup &Handle Break outBSE:
Trading at 2881 and above all its critical Moving averages Viz10/20/50/10 DEMA
In daily chart has formed C&H Pattern,
Based on the pattern and price volume suggests -breaking the Neckline resistance at 2880-2900 likely to test 2950/3000+ shortly(For educational purpose only)
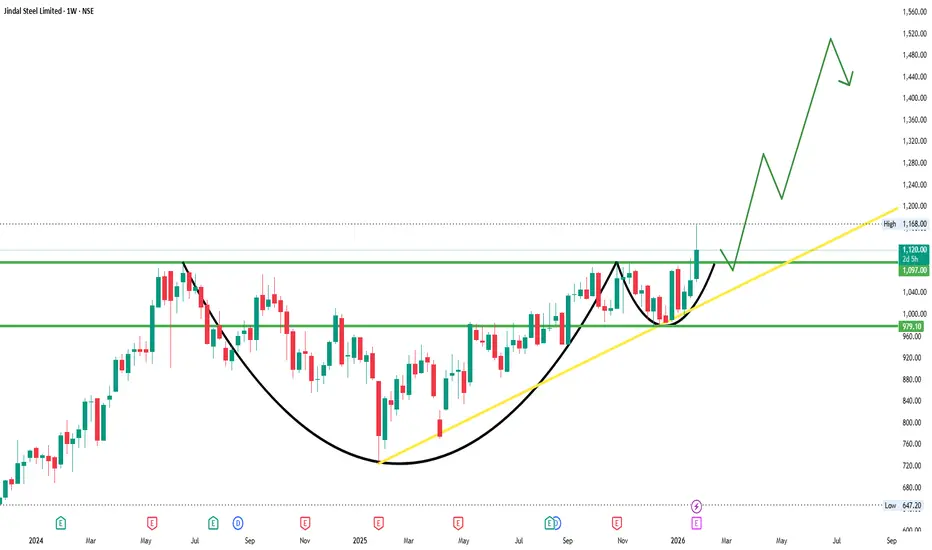
JINDALSTELJINDALSTEL
bullish trend is Showing on the chart.
buy signals in
technical indicators and
cup with handle & ascending triangle chart pattern.
BUYING RANGE 1090/1100
Watch for a breakout above 1090/1100 to sustain the bullish trend. If the resistance holds, there could be a retest towards 975/980
FUSION - Time to shine?DISCLAIMER: This is NOT a trade recommendation but only my observation. Please do your own analysis before entering your trades
Points to note:
-----------------
1. Price has been in consolidation for 8 months inside a triangle
2. Attempt to breakdown was rejected with price swiftly moving back i

TATASTEEL C&H WEEKLY BREAKOUTTatasteel breaking c&h pattern weekly basis
trading at ATH,metal sector doing well
good volume last few weeks
RSI above 60,macd crossover seen
immediate target 206,after breaking 206 can lead toward 227
NO BUY/SELL RECOMENDATION

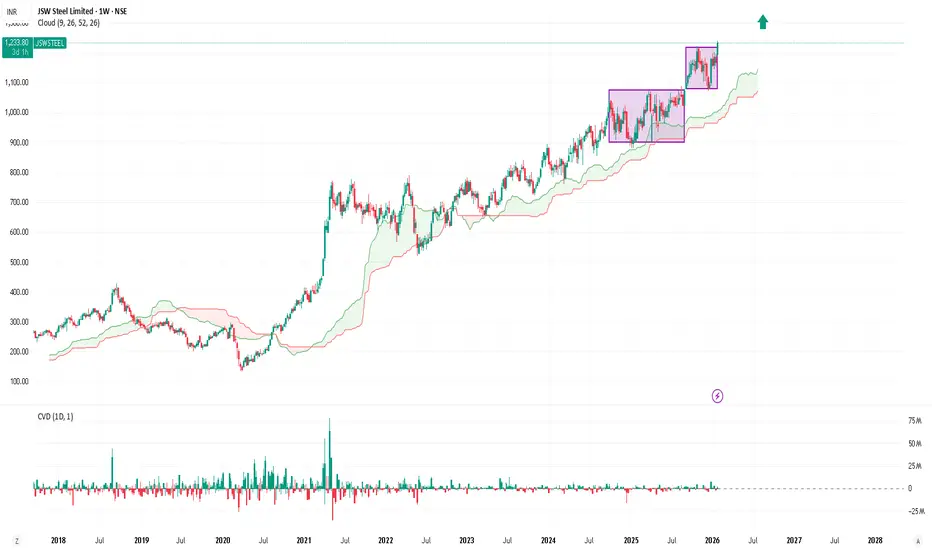
JSW Steel | Bull Continuation After Range Breakout target 1450🏭 Business Snapshot
JSW Steel is one of India’s largest integrated steel producers
Key beneficiary of infrastructure, construction, and capex-led growth
Strong domestic presence with improving capacity utilisation
Steel cycle + government infra spending provide sector tailwinds
(Business context
BUY TODAY SELL TOMORROW for 5%DON’T HAVE TIME TO MANAGE YOUR TRADES?
- Take BTST trades at 3:25 pm every day
- Try to exit by taking 4-7% profit of each trade
- SL can also be maintained as closing below the low of the breakout candle
Now, why do I prefer BTST over swing trades? The primary reason is that I have observed that

COAL INDIA (1W) – Breakout From Long Consolidation | Key Levels 🟢 What’s Happening on the Chart?
• COAL INDIA was in a strong uptrend earlier and then entered a long sideways consolidation
• Price formed a solid base with multiple rejections from the same zone
• Recently, price broke and reclaimed the key resistance area
• Old resistance is now acting as new

#DCBBANK - BreakOut in DTF with Volume Script: DCBBANK
Key highlights: 💡⚡
📈 C&H BreakOut in Daily Time Frame
📈 Volume spike during Breakout
📈 Base BreakOut
📈 RS Line making 52WH
📈 MACD Crossover
BUY ONLY ABOVE 200 DCB
⏱️ C.M.P 📑💰- 199.62
🟢 Target 🎯🏆 – 12%
⚠️ Stoploss ☠️🚫 – 6%
⚠️ Important: Market conditions are BAD, Avoid entering

JINDALSTEEL | Flag continuationStrong prior impulse, orderly flag structure
-RSI >50, EMAs rising, OBV confirms accumulation
-Sector tailwind: strength in metals
Trade plan:
-Buy > 1100 (volume confirmation required)
-SL: 1030
-Positional target: 1770
-R:R ≈ 1:11

See all editors' picks ideas
Hyperfork Matrix🔱 Hyperfork Matrix 🔱 A manual Andrews Pitchfork tool with action/reaction propagation lines and lattice matrix functionality. This indicator extends Dr. Alan Andrews' and Patrick Mikula's median line methodology by automating the projection of reaction and action lines at equidistant intervals, cr

Arbitrage Matrix [LuxAlgo]The Arbitrage Matrix is a follow-up to our Arbitrage Detector that compares the spreads in price and volume between all the major crypto exchanges and forex brokers for any given asset.
It provides traders with a comprehensive view of the entire marketplace, revealing hidden relationships among d

Wyckoff Schematic by Kingshuk GhoshThe "Wyckoff Schematic" is a Pine Script indicator that automatically detects and visualizes Wyckoff Method accumulation and distribution patterns in real-time. This professional tool helps traders identify smart money movements, phase transitions, and critical market structure points.
Key Features

Volume Cluster Profile [VCP] (Zeiierman)█ Overview
Volume Cluster Profile (Zeiierman) is a volume profile tool that builds cluster-enhanced volume-by-price maps for both the current market window and prior swing segments.
Instead of treating the profile as a raw histogram only, VCP detects the dominant volume peaks (clusters) insid

DeeptestDeeptest: Quantitative Backtesting Library for Pine Script
━━━━━━━━━━━━━━━━━━━━━━━━━━━━━━━━━━
█ OVERVIEW
Deeptest is a Pine Script library that provides quantitative analysis tools for strategy backtesting. It calculates over 100 statistical metrics including risk-adjusted return ratios (Sharpe

Arbitrage Detector [LuxAlgo]The Arbitrage Detector unveils hidden spreads in the crypto and forex markets. It compares the same asset on the main crypto exchanges and forex brokers and displays both prices and volumes on a dashboard, as well as the maximum spread detected on a histogram divided by four user-selected percenti

Multi-Distribution Volume Profile (Zeiierman)█ Overview
Multi-Distribution Volume Profile (Zeiierman) is a flexible, structure-first volume profile tool that lets you reshape how volume is distributed across price, from classic uniform profiles to advanced statistical curves like Gaussian, Lognormal, Student-t, and more.
Instead of forcin

Multi-Ticker Anchored CandlesMulti-Ticker Anchored Candles (MTAC) is a simple tool for overlaying up to 3 tickers onto the same chart. This is achieved by interpreting each symbol's OHLC data as percentages, then plotting their candle points relative to the main chart's open. This allows for a simple comparison of tickers to tr

Vdubus Divergence Wave Pattern Generator V1The Vdubus Divergence Wave Theory
10 years in the making & now finally thanks to AI I have attempted to put my Trading strategy & logic into a visual representation of how I analyse and project market using Core price action & MacD. Enjoy :)
A Proprietary Structural & Momentum Confluence System

Per Bak Self-Organized CriticalityTL;DR: This indicator measures market fragility. It measures the system's vulnerability to cascade failures and phase transitions. I've added four independent stress vectors: tail risk, volatility regime, credit stress, and positioning extremes. This allows us to quantify how susceptible markets are

See all indicators and strategies
Community trends
PAGEIND M PATTREN BREAKDOWN 31 01 2026📈 1) Pageind Pattern Structure: M-Pattern / Double Top
An M-Pattern (Double Top) is a bearish reversal pattern with the following components:
Left Top → Right Top ≈ equal highs
Neckline → horizontal support connecting the swing lows between tops
Breakdown → close below the neckline confirms the pat
SHARDACROP: Strong Q3, Descending Trainlge BO, Chart of the WeekFrom Descending Triangle Breakout to Q3FY26 Glory: Why Sharda Cropchem's Could Be Your Next Big Move Lets Understand in "Chart of the Week"
As per the Latest SEBI Mandate, this isn't a Trading/Investment RECOMMENDATION nor for Educational Purposes; it is just for Informational purposes only. The

GENCON - Ready to lift up?Strong Resistance Zone was: 48.50 – 49.40
Status: Successfully breached today with strong volume
Current Market Price (CMP): 51.01
Trade Setup (Observation Only):
- Long Entry: CMP
- Stop Loss (SL): 47.36
- Target (TGT): 64
- Risk-to-Reward Ratio: 1:5

(MCX) — EMA Alignment & Momentum Continuation Setup target 2800🧠📈 MCX — When Structure Aligns Better Than Greek Geometry
🏛 Company Profile
Multi Commodity Exchange of India Ltd (MCX) is India’s dominant commodity derivatives exchange — essentially a high-moat, asset-light cash machine.
No inventory, no working capital drama, no capex headache.
Just volatilit

JINDALSTELJINDALSTEL
bullish trend is Showing on the chart.
buy signals in
technical indicators and
cup with handle & ascending triangle chart pattern.
BUYING RANGE 1090/1100
Watch for a breakout above 1090/1100 to sustain the bullish trend. If the resistance holds, there could be a retest towards 975/980
Hindustan Copper Limited - Breakout Setup, Move is ON...#HINDCOPPER trading above Resistance of 602
Next Resistance is at 896
Support is at 458
Here are previous charts:
Chart is self explanatory. Levels of breakout, possible up-moves (where stock may find resistances) and support (close below which, setup will be invalidated) are clearly defin

FORTIS Near Strong Support – Bounce PossibleFortis has corrected from the top and moved down into a strong support area.
This trendline has acted as support before, and once again price is reacting positively from here.
Selling pressure is slowing down and buyers are starting to step in.
As long as this support holds, a bounce towards the u

BSE-Likely Cup &Handle Break outBSE:
Trading at 2881 and above all its critical Moving averages Viz10/20/50/10 DEMA
In daily chart has formed C&H Pattern,
Based on the pattern and price volume suggests -breaking the Neckline resistance at 2880-2900 likely to test 2950/3000+ shortly(For educational purpose only)
BUY TODAY SELL TOMORROW for 5%DON’T HAVE TIME TO MANAGE YOUR TRADES?
- Take BTST trades at 3:25 pm every day
- Try to exit by taking 4-7% profit of each trade
- SL can also be maintained as closing below the low of the breakout candle
Now, why do I prefer BTST over swing trades? The primary reason is that I have observed that

AMBUJACEM 1 Month View 📈 1-Month Price Range (Most Recent Data)
📊 Last Traded Price:
• Around ₹510.15 – ₹510.20 as of 30 Jan 2026 close.
🔥 1-Month Highest Price:
• ₹573.10 – observed in early January 2026.
❄️ 1-Month Lowest Price:
• ₹507.90 – recent intra-month low.
➡️ Typical Trading Range Over Last Month:
• High: ~₹

See all stocks ideas
Today
LATENTVIEWLatent View Analytics Limited
Actual
—
Estimate
2.50
INR
Tomorrow
SAKSOFTSaksoft Limited
Actual
—
Estimate
—
Tomorrow
VINATIORGAVinati Organics Limited
Actual
—
Estimate
11.35
INR
Tomorrow
MPSLTDMPS Limited
Actual
—
Estimate
26.80
INR
Tomorrow
POLICYBZRPB Fintech Limited
Actual
—
Estimate
3.65
INR
Tomorrow
THERMAXThermax Limited.
Actual
—
Estimate
12.49
INR
Tomorrow
INTERARCHInterarch Building Solutions Ltd
Actual
—
Estimate
18.60
INR
Tomorrow
UNIECOMUnicommerce eSolutions Limited
Actual
—
Estimate
—
See more events
No scheduled reports
Community trends
[SeoVereign] BITCOIN BULLISH Outlook – January 31, 2025Bitcoin is currently deciding its next move around the recent daily low of 80,700 USDT.
At this point, there are three main scenarios that could unfold for Bitcoin. First, it does not break below 80,700 USDT and continues to rise. Second, it breaks below 80,700 USDT but forms a whipsaw movement, fu

Astro Timing🧭 TRADER’S ASTRO-COMPASS: Saturday, Jan 31, 2026 Timezone: New York (EST)
📉 MARKET PROBABILITY: The market has a split personality today. The pre-market session offers high probability setups (an echo of yesterday's Jupiter), but the main session turns into a volatility trap. Rule of the day: "Hit a

Two Very Different Futures for Bitcoin Two Very Different Futures for Bitcoin 🔥
Don’t skip this one - the monthly chart decides
Bitcoin is approaching a critical decision zone on the monthly timeframe — one that could shape market behaviour well beyond short-term volatility.
From a structural and macro lens, a few developments stand ou


BTC getting ready for upsideBitcoin is most likely completing wave D of an expanding triangle and ready to enter wave E, which will be corrective in itself.
The move will be invalidated below ~80,500 which was the last important low formed on 21Nov'25.
Will keep you guys updated!


BTCUSD Near Demand Zone as Selling Pressure ContinuesBTCUSD is trading with a clear bearish structure after a strong downward move. The price has been forming lower highs and lower lows, showing that selling pressure is still present in the market. Earlier pullbacks failed near the resistance area of 89,500–90,200, where sellers became active again. T

ETHUSD 45-Min Chart — Counter-Trend Long From Demand After Major
Chart Analysis:
Market Structure:
Ethereum broke decisively below the 2,855 resistance zone, confirming a bearish structure shift. The move down was impulsive, followed by weak consolidation — classic distribution → continuation behavior.
Support / Demand Zone:
Price is reacting around 2,485–2,5

BTC 1D UpdateThe Hook: Blood in the streets? Or the opportunity of 2026? 🩸📉
If you’re feeling the heat today, you’re not alone. Bitcoin just took a massive swing, slicing through supports to hit a local low around $80,553. The "Fear & Greed Index" has officially tanked into Extreme Fear (20/100), and the timelin


See all crypto ideas
Silver planThough this moves was really unexpected but i am seeing silver to target it's fvg and if it holds then all time high else we will be heading towards another low

Silver Price structure like a Clockwork?TVC:SILVER prices recently made a blow-off top, touching $121, before receding 25%.
While on the one hand, TVC:GOLDSILVER touched the lower boundary of 46 before rising sharply (suggesting Gold may outperform Silver in the near future), on the other hand, the long-term chart of Silver may repea

Silver Futures: Parabolic Breakdown & Bearish LiquidationSilver Futures: Parabolic Breakdown & Bearish Liquidation (Analysis)
Part 1: Historical Context (The "Why") To understand this violent -17% move, we must look at Silver's distinct "personality" compared to Gold.
1. The "Beta" Factor (Silver vs. Gold) Silver is often called "Gold on steroids." Whil

XAUUSD (H4) – Liam Weekly ForecastXAUUSD (H4) – Liam Weekly Outlook
Uptrend under pressure, but not broken | Focus on retests and reactions
Quick summary
Gold has experienced a sharp corrective move after an extended bullish run. The recent sell-off has broken the steep short-term uptrend, but price has not confirmed a full trend

Gold (XAUUSD) Short Setup – Target $4,890Gold is showing signs of weakness after a failed attempt to reclaim higher levels. Here is the breakdown:
Context: After a significant drop, the price pulled back into a clear Supply Zone (blue box) around the $5,075 - $5,085 area.

XAUUSD (Gold) – 4H Chart Analysis (Short & Clear)XAUUSD (Gold) – 4H Chart Analysis (Short & Clear)
Market Structure
Overall strong uptrend intact (higher high–higher low).
Recent move shows sharp rally → profit booking / pullback.
Current price ~5127, bounced from below 5000 area.
Key Levels
Resistance:
5250–5280 (minor)
5450–5600 (major s

SILVER (XAGUSD) 1HRSWING TRADE
- EARN WITH ME DAILY 10K-20K –
SILVER (XAGUSD) Looking good for Downside..
When it break level 106.86 and sustain.. it will go Downside...
SELL @ 106.86
Target
1st 101.79
2nd 96.177
Enjoy trading traders.. Keep add this STOCK in your watch list..
Big Investor are welcome..
Like thi

If You Want to Catch the Bottom, First Wait for RSI.To Do Nothing.
Right now, staying out is already a win.
The market is moving fast, noisy, and uncomfortable. Both buyers and sellers are getting trapped — not because direction is unclear, but because the market has not finished its process yet.
This is a moment to stay calm and observe, not to f

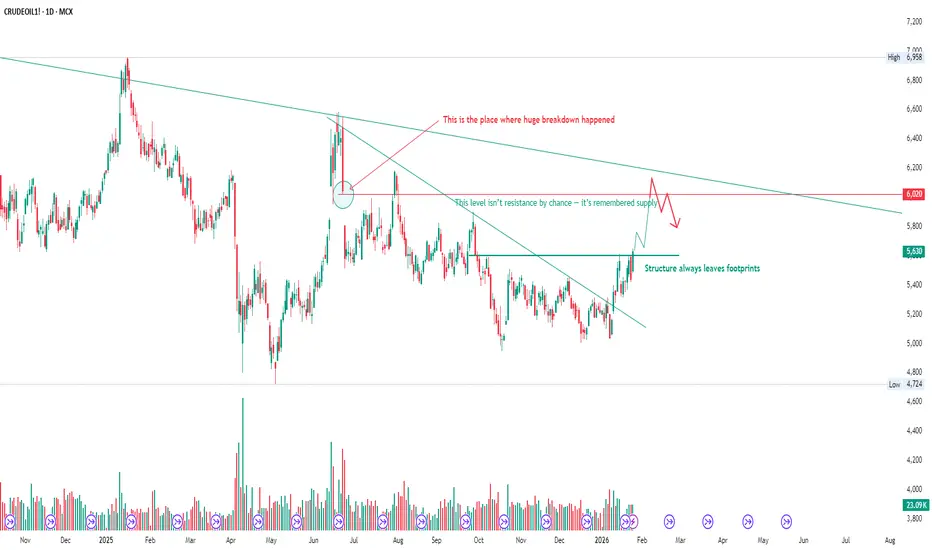
Crude Oil: The Market Is Revisiting the Scene of the BreakdownCrude Oil is revisiting a level where a major structural breakdown occurred in the past.
Markets don’t forget such zones easily. What once triggered aggressive selling often turns into active supply when revisited.
The recent move is not random strength — it’s a retest of prior imbalance, followed
XAUUSD Gold Next Move In Upcoming 2 Weeks ExpectedGold is Now Moving to 5600 to 5615 Which is Retracement level of 1.618 For Golds Previous Swing Extension levels and can expect a retracement of till 5000 to 5100 Levels In Upcoming Weeks Lets See WhatS Going to Happen..........# XAUUSD .. Check My 4hr chart Frame

See all futures ideas
EURUSD 2H CHART EUR/USD Long Setup
Entry Zone: After price touches the bullish order block (OB) and shows rejection/reversal signals.
Direction: Long
Invalidation Level: Below the order block low.
Target: Next higher structure high (or previous swing high / liquidity zone above).
Rationale: Price is expected t

USDCHF 1W T/F ANALYSIS---
USDCHF 1w t/f analysis----
📊 Market Structure Explanation (usdchf – 1w):-
Centeral structure are a vibrancy (Explanation of Vibrancy structure > this structure are first volume contraction and bended both side also then empulsive move and break it`s sel

Just a Normal setupTake the buy ONLY if one of these happens:
4H or 1H strong bullish close from the zone
Long lower wick + bullish body (rejection)
5m/15m break of structure upward, then pullback
Sweep below demand → fast reclaim above 1.184

Expecting audcad sell delivery for buy setupsBetween these two red lines inside weekly+daily imb, the set-up could be find for buys
Why? Price already taken the liquidity above and it possible scenario
shows the probability
of retracement ( where structure shift indicates sellside delivery,
however buys will be
more safer approach fundam

USDJPYGreetings!
Welcome traders.
By choosing to "Follow", you can stay updated with the latest information promptly. Kindly consider clicking "Boost" as well.
Wishing you a pleasant day.

AUDJPY : Bulls Defending the Line 106.60 !AUDJPY has undergone a significant correction, sliding from the 109.00 peak down to the 106.20 region. However, the bears have hit a massive roadblock. We are currently seeing a strong reaction from a historical demand zone (105.80 – 106.00), marked by the clear rejections in the shaded circles on t

USD/JPY Intraday Short – Liquidity Sweep & Shift in Market STRFollowing a period of distribution near the 153.750 level, price has shown a clear rejection of recent highs, likely sweeping buy-side liquidity (BSL) before breaking lower.

EURUSD to test the highs !!ICT Concepts: Price delivering out of a 1hr FVG. SMT with GBPUSD. Price now should move from a IRL to the ERL.

#GBP/USD Sell Trade Scenario.Here’s an up-to-date GBP/USD Sell trade outlook (technical + fundamental) to help you assess whether positioning for a Downside makes sense right now.
Thank You......

USDJPY Pullback Explained: Trend Support in Focus!For me, USDJPY is still behaving like a healthy uptrend, not a market that is rolling over. Price has been respecting a clear rising channel structure, with buyers consistently defending higher lows.
The recent move lower looks more like a pullback into major trend support rather than a sign of wea

See all forex ideas
| - | - | - | - | - | - | - | - | ||
| - | - | - | - | - | - | - | - | ||
| - | - | - | - | - | - | - | - | ||
| - | - | - | - | - | - | - | - | ||
| - | - | - | - | - | - | - | - | ||
| - | - | - | - | - | - | - | - | ||
| - | - | - | - | - | - | - | - | ||
| - | - | - | - | - | - | - | - | ||
| - | - | - | - | - | - | - | - |
Trade directly on Supercharts through our supported, fully-verified, and user-reviewed brokers.


