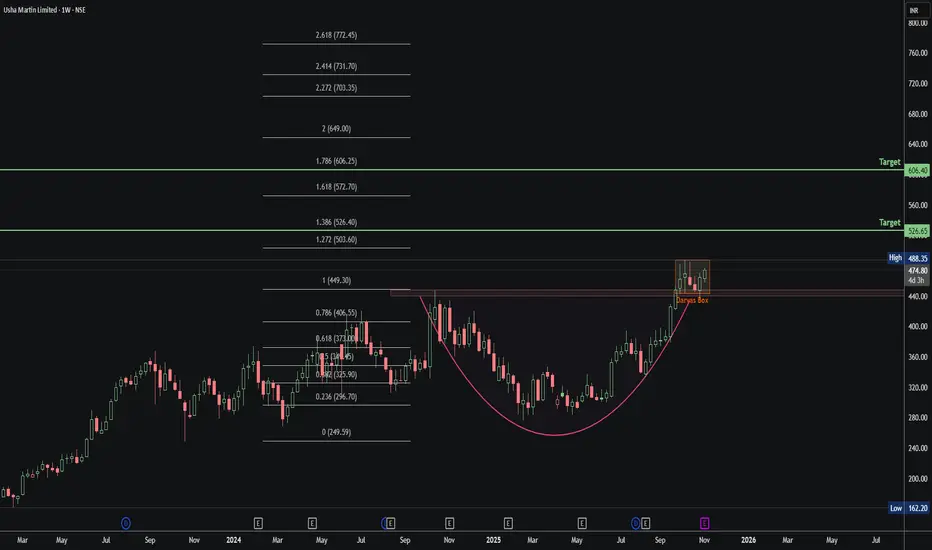
Usha Martin: Cup & Handle Breakout Loading!🧩 1. Cup & Handle Setup
Smooth U-shaped Cup with a tight Darvas Box Handle on top.
Classic bullish continuation structure — breakout confirmation above ₹488.
📈 2. Fibonacci Outlook
0.786 (₹406) → Neckline retest
1.0 (₹449) → Cup breakout
1.272 (₹503) / 1.386 (₹526) → 🎯 Short-term targets
1.61

The best trades require research, then commitment.
Get started for free$0 forever, no credit card needed

Scott "Kidd" PoteetThe unlikely astronaut

Where the world does markets
Join 100 million traders and investors taking the future into their own hands.
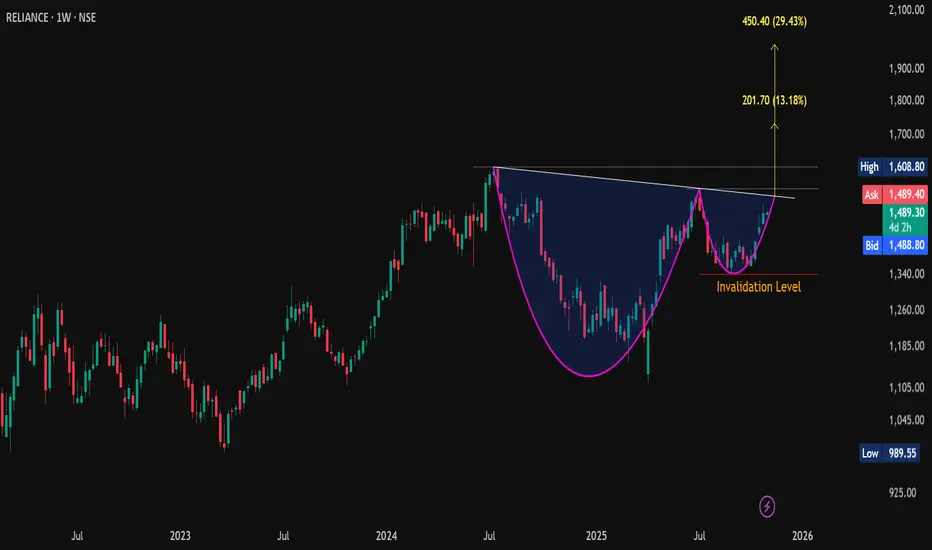
#Reliance | Cup & Handle Breakout Setup📊 CMP: 1489
💥 Breakout Level: WCB above Handle Neckline
🎯 Pattern Targets: 1730 / 1980+ (16 & 33% from CMP)
🛡 Support: 1456 / 1407-1409
🚧 Resistance: 1527-1551 / 1597-1609
❌ Invalidation Level: Below 1340.60 (WCB)
#CupnHandle #ChartPattern #PriceAction #SwingTrade
📌 Disclaimer: Thi
Privi Speciality Chemicals Ltd – Weekly Breakout SetupPrivi has shown a clean breakout from a long consolidation zone, backed by steady volume expansion. After months of range-bound action, the stock finally broke above ₹2,600 and is now sustaining well above its breakout zone — indicating the start of a new upward leg.
Price action shows strong bullis

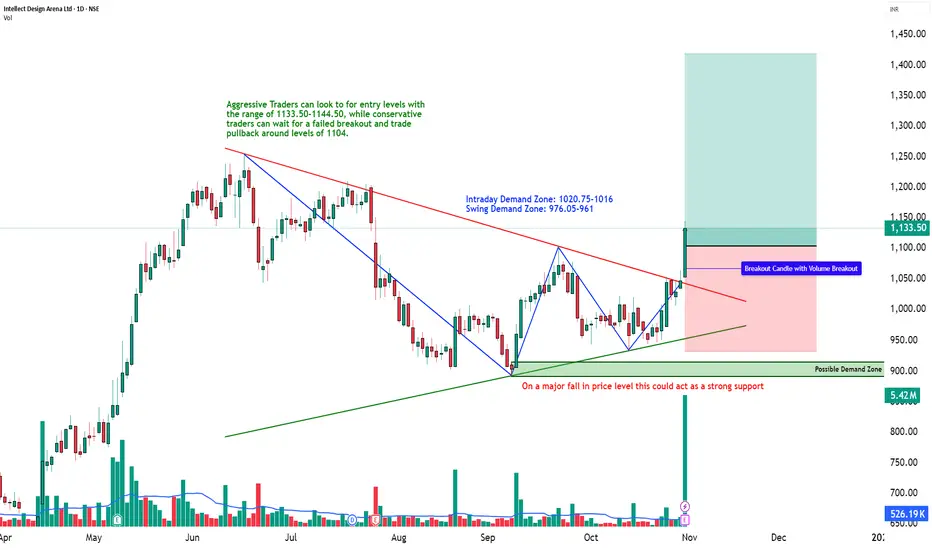
Descending Triangle Breakout with Institutional Volume | STWP💹 Intellect Design Arena Ltd (NSE: INTELLECT)
Sector: IT – FinTech Solutions | CMP: ₹1,133.50 | View: Bullish Momentum Breakout Setup
📊 Price Action:
Intellect Design Arena has delivered a strong bullish breakout from its multi-month descending trendline, marking a structural shift from a consolida
NIFTY Breakout Retest — Bulls Getting ReadyNIFTY appears to be forming a classic Cup and Handle pattern, a strong bullish continuation setup. Recently, the index successfully broke out above the handle resistance zone, confirming the pattern’s validity. Currently, it is pulling back to retest the breakout level, which often serves as a healt

USD-JPY is in a Bullish PatternUSD-JPY is about to Break the Pattern . In 30 Min TF it is Trading in in a FLAT-TOP pattern and also it shows a Flag & Pole pattern and Both are Bullish Patterns . This type of pattern may give the Breakout on either side.

vaibhav global good support made around 180 levels and lot of consolidation in tight range now seeing weekly breakout and strong close above downvtrendline a big move can be seen in next 2-3 quarters towards 500 .this view fails if price monthly start closing below 180 levels .

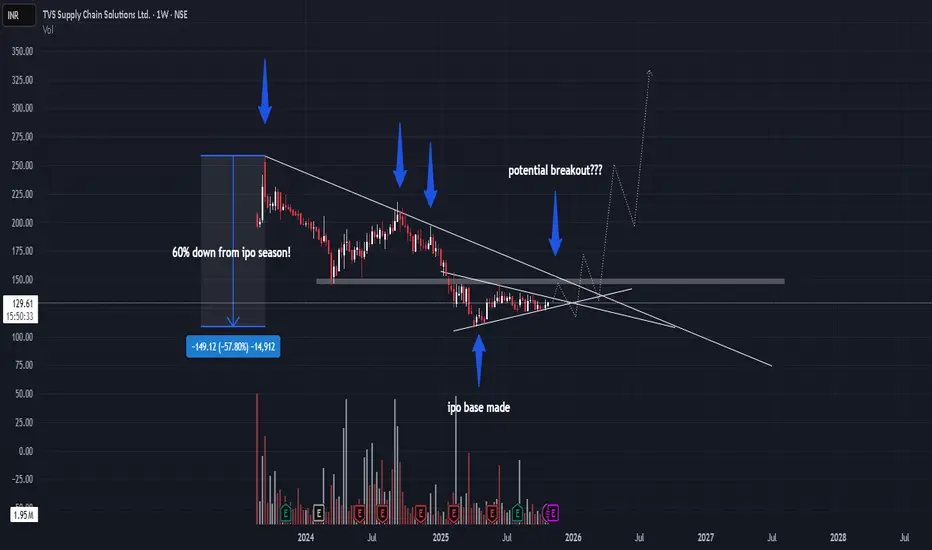
potential multibagger? TVSSCS buy trigger above 150 level
holding for more than 2-3years
hoping TVSSCS is going to be 2-3x
TVS SCS (TVS Supply Chain Solutions) is from the TVS Group, which also includes TVS Motor Company. Both companies are part of the larger TVS Mobility Group, and TVS Motor Company has increased its stake i
Indraprastha Medical Ltd | Bullish Flag Breakout | Swing SetupCompany Overview (Fundamental)
Indraprastha Medical Corporation Ltd (IMCL) operates under the Apollo Hospitals Group and manages the Indraprastha Apollo Hospital, New Delhi — one of India’s largest multi-specialty hospitals. Company financially strong, consistent profitability, improving margins,

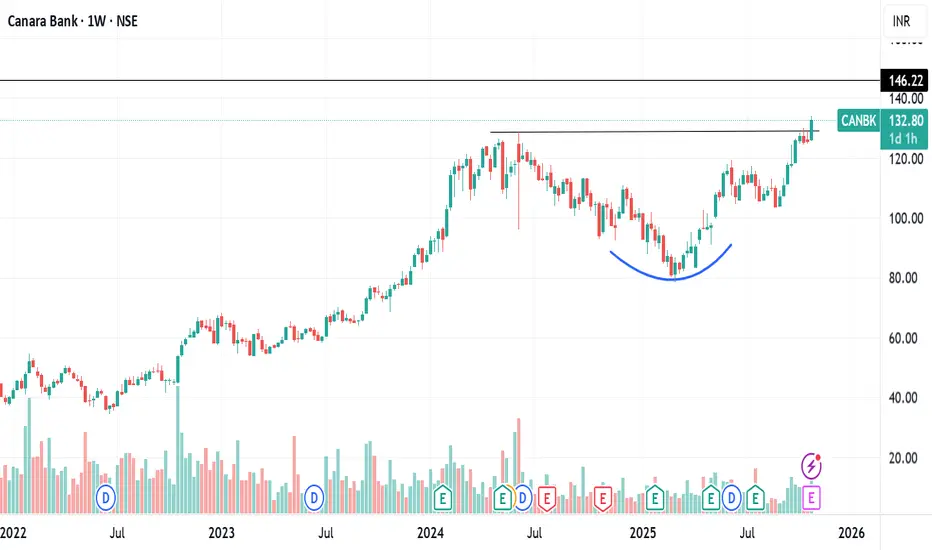
CANARA BANK ROUNDING BOTTOM BREAKOUTCanara bank breaking rounding bottom weekly
with huge volume this week
RSI above 60 bullish
heading towards 15 yr high
q2 net profit rises 19% +ve
target 146 then can lead to ATH 164 also
NO BUY/SELL RECOMENDATION
See all editors' picks ideas
LogNormalLibrary "LogNormal"
A collection of functions used to model skewed distributions as log-normal.
Prices are commonly modeled using log-normal distributions (ie. Black-Scholes) because they exhibit multiplicative changes with long tails; skewed exponential growth and high variance. This approach i

Range Oscillator (Zeiierman)█ Overview
Range Oscillator (Zeiierman) is a dynamic market oscillator designed to visualize how far the price is trading relative to its equilibrium range. Instead of relying on traditional overbought/oversold thresholds, it uses adaptive range detection and heatmap coloring to reveal where pri

Volume Surprise [LuxAlgo]The Volume Surprise tool displays the trading volume alongside the expected volume at that time, allowing users to spot unexpected trading activity on the chart easily.
The tool includes an extrapolation of the estimated volume for future periods, allowing forecasting future trading activity.
🔶 U

Smooth Theil-SenI wanted to build a Theil-Sen estimator that could run on more than one bar and produce smoother output than the standard implementation. Theil-Sen regression is a non-parametric method that calculates the median slope between all pairs of points in your dataset, which makes it extremely robust to o

Fair Value Gaps by DGTFair Value Gaps
A refined, multi-timeframe Fair Value Gap (FVG) detection tool that brings institutional imbalance zones to life directly on your chart.
Designed for precision, it visualizes how price delivers into inefficiencies across chart, higher, and lower (intrabar) timeframes — offering a fl

TASC 2025.11 The Points and Line Chart█ OVERVIEW
This script implements the Points and Line Chart described by Mohamed Ashraf Mahfouz and Mohamed Meregy in the November 2025 edition of the TASC Traders' Tips , "Efficient Display of Irregular Time Series”. This novel chart type interprets regular time series chart data to create an ir

Simplified Percentile ClusteringSimplified Percentile Clustering (SPC) is a clustering system for trend regime analysis.
Instead of relying on heavy iterative algorithms such as k-means, SPC takes a deterministic approach: it uses percentiles and running averages to form cluster centers directly from the data, producing smoo

Adaptive Volume Delta Map---
📊 Adaptive Volume Delta Map (AVDM)
What is Adaptive Volume Delta Map (AVDM)?
The Adaptive Volume Delta Map (AVDM) is a smart, multi-timeframe indicator that visualizes buy and sell volume imbalances directly on the chart.
It adapts automatically to the best available data resolution

Dynamic Equity Allocation Model"Cash is Trash"? Not Always. Here's Why Science Beats Guesswork.
Every retail trader knows the frustration: you draw support and resistance lines, you spot patterns, you follow market gurus on social media—and still, when the next bear market hits, your portfolio bleeds red. Meanwhile, institution

First Passage Time - Distribution AnalysisThe First Passage Time (FPT) Distribution Analysis indicator is a sophisticated probabilistic tool that answers one of the most critical questions in trading: "How long will it take for price to reach my target, and what are the odds of getting there first?"
Unlike traditional technical indicators

See all indicators and strategies
Community trends
#Reliance | Cup & Handle Breakout Setup📊 CMP: 1489
💥 Breakout Level: WCB above Handle Neckline
🎯 Pattern Targets: 1730 / 1980+ (16 & 33% from CMP)
🛡 Support: 1456 / 1407-1409
🚧 Resistance: 1527-1551 / 1597-1609
❌ Invalidation Level: Below 1340.60 (WCB)
#CupnHandle #ChartPattern #PriceAction #SwingTrade
📌 Disclaimer: Thi
Usha Martin: Cup & Handle Breakout Loading!🧩 1. Cup & Handle Setup
Smooth U-shaped Cup with a tight Darvas Box Handle on top.
Classic bullish continuation structure — breakout confirmation above ₹488.
📈 2. Fibonacci Outlook
0.786 (₹406) → Neckline retest
1.0 (₹449) → Cup breakout
1.272 (₹503) / 1.386 (₹526) → 🎯 Short-term targets
1.61
BUY TODAY SELL TOMORROW for 5%DON’T HAVE TIME TO MANAGE YOUR TRADES?
- Take BTST trades at 3:25 pm every day
- Try to exit by taking 4-7% profit of each trade
- SL can also be maintained as closing below the low of the breakout candle
Now, why do I prefer BTST over swing trades? The primary reason is that I have observed that

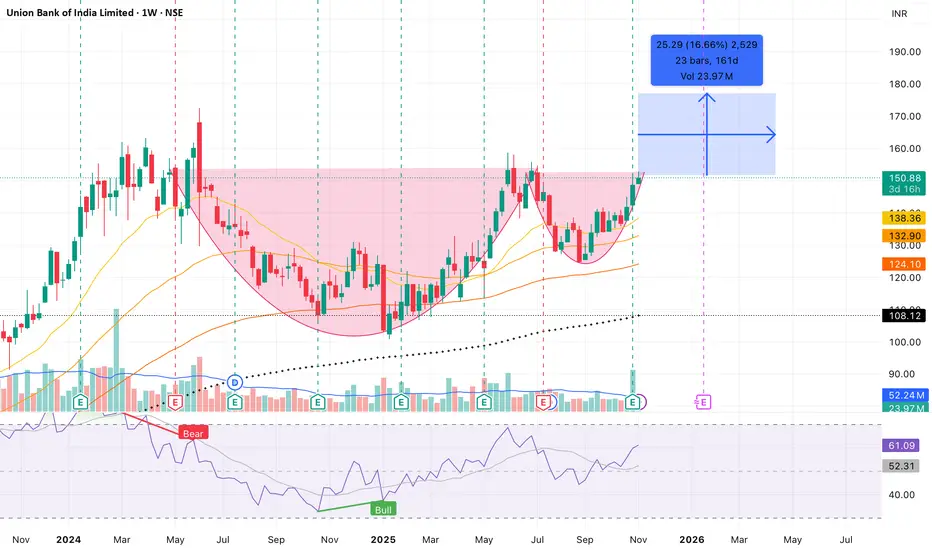
Union Bank of India – Cup and Handle Breakout Formation on Week.Union Bank (NSE: UNIONBANK) is displaying a classic Cup and Handle formation on the weekly timeframe, indicating a potential continuation of the long-term uptrend.
Technical Overview:
• Pattern: Cup & Handle
• Breakout Zone: ₹150–155
• Target Zone: ₹175–180 (≈16–17% potential)
• Support Levels: ₹13
Volume Contraction Pattern Amidst Dual TrendlinesThe chart reveals important price structure and behavior over the past 18 months, featuring both a prominent counter trend line (marked in red) and a long-term support trendline (marked in green). Each element signifies distinct phases of supply absorption and buyer interest.
• Counter Trend Line (
PNB 1 Month Time Frame 📊 Key price data
Latest close: ₹116.94 (approx)
52-week high: ~ ₹120.20
1-month range: roughly ₹112-₹124
🧭 Support & Resistance Levels
Support zone: ~ ₹112-₹114 — recent monthly lows around ₹112.02.
Resistance zone: ~ ₹123-₹124 — recent highs in that band.
Resistance zone: ~ ₹123-₹124 — recent

Privi Speciality Chemicals Ltd – Weekly Breakout SetupPrivi has shown a clean breakout from a long consolidation zone, backed by steady volume expansion. After months of range-bound action, the stock finally broke above ₹2,600 and is now sustaining well above its breakout zone — indicating the start of a new upward leg.
Price action shows strong bullis
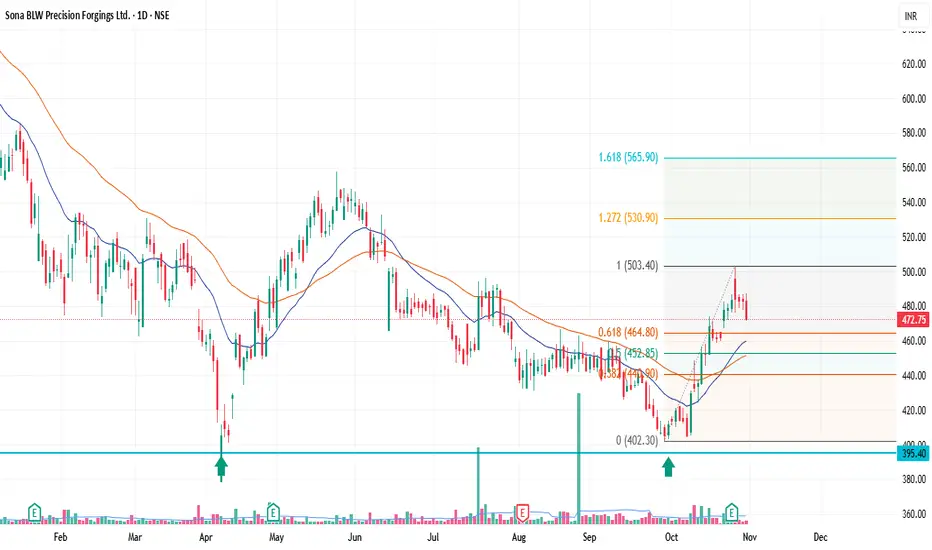
Sona BLW Precision Forgings Ltd. (SONACOMS) — pullback setup(SONACOMS) — Bullish Pullback Setup
📅 Timeframe: 1D | 💰 CMP: ₹472.75 | 📈 Volume: Above average
Technical View
Sona BLW has completed a strong impulse wave from ₹402 → ₹503, followed by a healthy pullback.
Price is now retracing near the 0.618 Fib level (₹464.8), aligning with the 21EMA — a zone
Bank of India Signals Bullish Continuation on Monthly ChartBank of India (NSE: BANKINDIA) is currently trading at ₹139.88 and presents a technically strong setup for bullish trend continuation. A closer look at the monthly chart reveals several key developments that reinforce this outlook.
🔍 Technical Highlights
✅ Intermediate Downtrend Reversal
The stock

Websol - Next leg of growthWith the company commercializing its new cell line last month..the future of the company is bright..We still have more demand than supply of cells so atleast for a few quarters the co should do extremely well.
The results this quarter might be muted coz production was stopped for a couple weeks to

See all stocks ideas
Nov 3
BHARTIARTLBharti Airtel Limited
Actual
11.30
INR
Estimate
10.54
INR
Nov 3
BPCLBharat Petroleum Corporation Limited
Actual
15.08
INR
Estimate
11.90
INR
Today
GATEWAYGateway Distriparks Limited
Actual
—
Estimate
1.25
INR
Today
ABBABB India Limited
Actual
—
Estimate
19.83
INR
Today
SUKHJITSSukhjit Starch & Chemicals Ltd.
Actual
—
Estimate
—
Today
SIYSILSiyaram Silk Mills Limited
Actual
—
Estimate
—
Today
VIMTALABSVimta Labs Limited
Actual
—
Estimate
—
Today
ARIHANTSUPArihant Superstructures Limited
Actual
—
Estimate
—
See more events
Community trends
BTC/USDT (4h timeframe)...BTC/USDT (4h timeframe), I can summarize what’s visible and help interpret my targets:
Current price: Around $107,469
Chart setup: my using Ichimoku Cloud (Kumo) with marked zones:
Resistance level (green zone) around $107,000 – $108,000
Two target points drawn on the chart:
First target point:

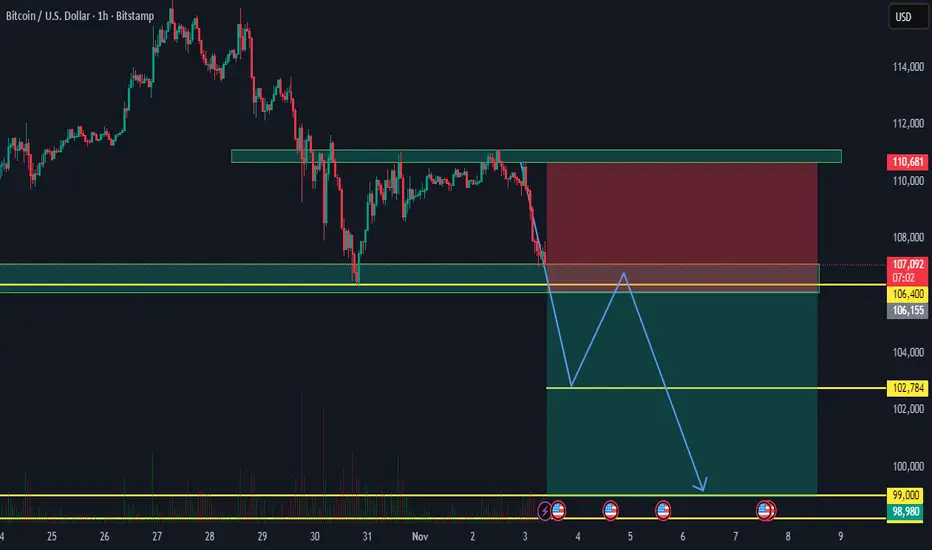
BITCOIN 1HRSWING TRADE
- EARN WITH ME DAILY 10K-20K –
BITCOIN Looking good for Downside..
When it break level 106400 and sustain.. it will go Downside...
SELL @ 106400
Target
1st 102784
2nd 99000
Enjoy trading traders.. Keep add this STOCK in your watch list..
Big Investor are welcome..
Like this Post??? H
$LTC to $500–$1000? Could Explode in the Next Alt SeasonCRYPTOCAP:LTC to $500–$1000? Could Explode in the Next Alt Season
CRYPTOCAP:LTC has been slow-growing, but I see strong potential here. I’m holding tight.
Imo, CRYPTOCAP:LTC could easily hit $500 during the next alt season. If it drops below or near $90, that’s a solid opportunity to accumulat

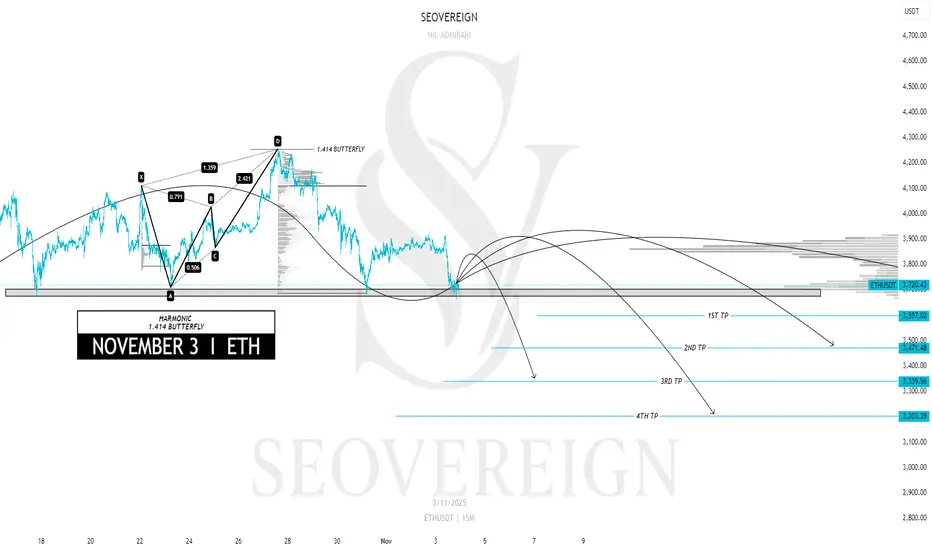
[SeoVereign] ETHEREUM BEARISH Outlook – November 03, 2025I would like to share my Ethereum idea as of November 3.
This idea is an extension of the one from October 27. The short positions entered on the 27th will be closed in profit in connection with this idea, and I plan to add some additional positions at the same time.
Basis — Harmonic 1.414 Butterf
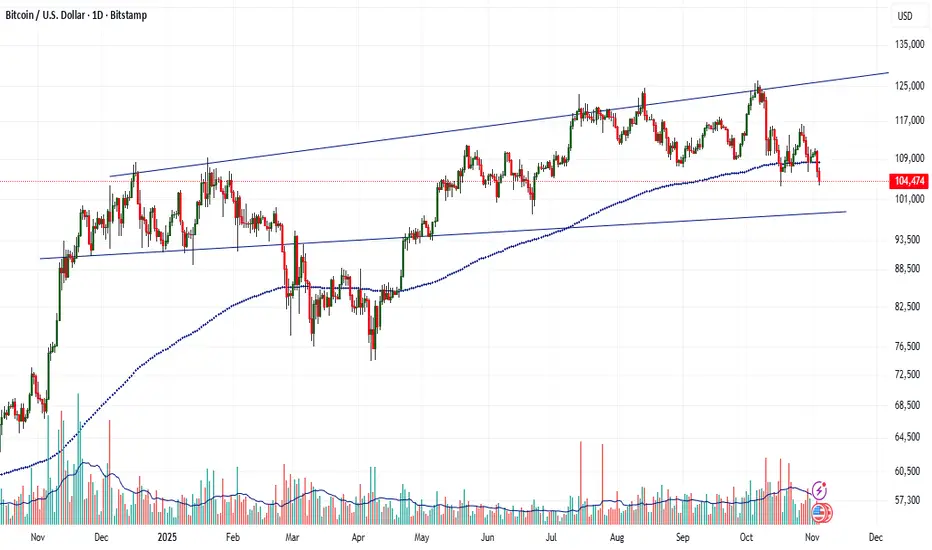
BTCUSD Technical Analysis – Imp Levels to WatchBitcoin (BTC/USD) Technical Analysis – Key Levels to Watch (Nov 2025 Update)
Bitcoin is currently showing a sideways-to-weak trend as the price struggles to stay above the $107,000 zone. After reaching its recent high near $125,000, BTC faced selling pressure and started moving lower. Let’s look

SYN – Quiet Accumulation Before the Pop?LSE:SYN has been grinding sideways near a key multi-month support zone around the $0.07–$0.08 range after an extended downtrend. This level has acted as a solid demand base before, and price has once again respected it - forming a clear accumulation range.
Despite the rough YTD drawdown, the struc

FIL 4H Technical Analysis — Cycle & Key Levels Overview📊 Cycle Structure:
HWC (Higher Wave Cycle): Bullish 🔽
MWC (Middle Wave Cycle): Range 🔁
LWC (Lower Wave Cycle): Bearish 🔼
📌 Market Context & Structure:🔽
FIL is moving within a box-like consolidation after a recent upward move.
Volume shows slight weakening, suggesting potential for a controlle

totally bearishI think market bearish till 3500 zone if eth survive 3500 zone and give an upside direction we can see new hisgh

Btc buying side preparing for liquidity sweep SMC ICT appliedAs per recent structure BTC has taken support at previous order block and also 200 ema, with hammer. So seems like going for liquidity sweep of sellers.

See all crypto ideas
XAU/USD (Gold Spot vs. U.S. Dollar) 1-hour chart XAU/USD (Gold Spot vs. U.S. Dollar) 1-hour chart on TradingView.
Here’s what I can observe:
There is a symmetrical triangle pattern (a type of consolidation pattern) drawn on the chart.
The price appears to be breaking out upwards from the triangle.
There’s an arrow drawn upward with a “target p

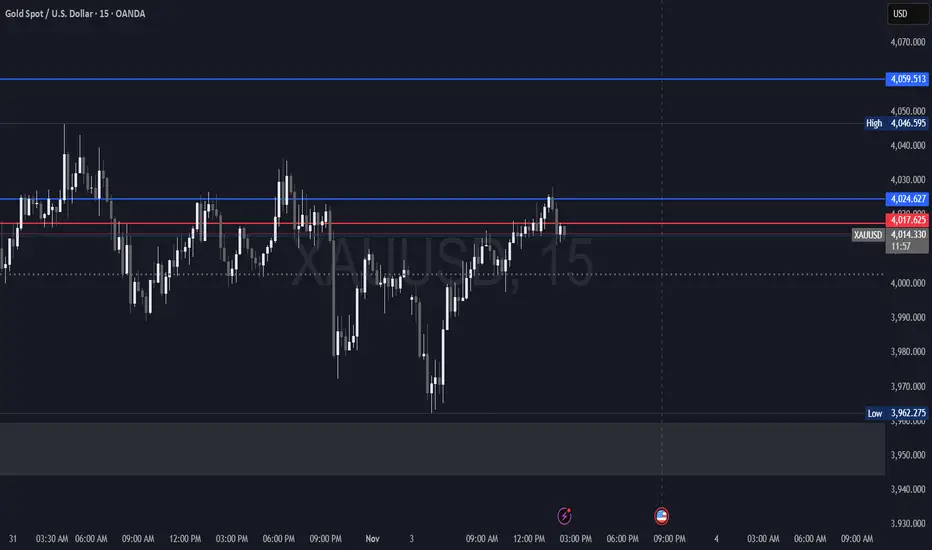
SHORT SCALP IN XAUUSD GOLD AT RESISTANCE and will be selling here with SL above swing breaking resistance and target at 3999 .
Leading Diagonal possibleIts still possible to complete a leading diagonal and then a wave 2 down.
Or it will turn into a running flat inside an expanding flat.

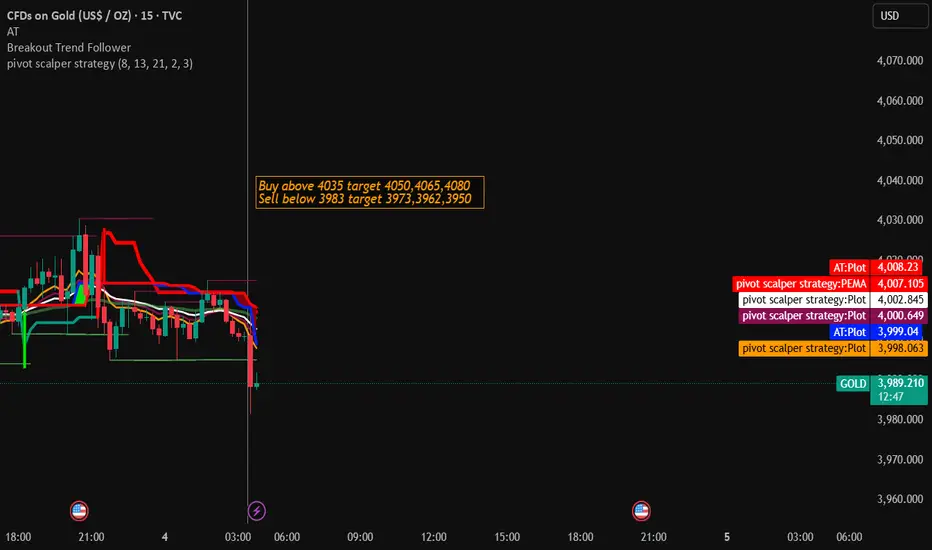
Gold Trading Strategy for 04th November 2025💰 GOLD TRADING PLAN (INTRADAY STRATEGY)
🟢 BUY SETUP (Bullish Scenario)
📈 Condition to Enter (Buy Entry):
➡️ Wait for a 30-minute candle to close ABOVE $4035.
➡️ Once a candle closes above this level, look to buy above the high of that same candle.
💵 Example:
Suppose a 30-min candle closes at $4036
Pattern Unfolding Hello Friends I just explained what i am looking the in Gold Futures
I request you to take notes as study materials and analyze before taking live trade
This is education content
Good luck

Gold Squeeze: Range Breakout Can Trigger $4,100+ MoveLooking at the current gold price action on the H1 chart, we're seeing a technical setup that's been developing over the past several sessions. The market has clearly established a well-defined range between approximately $3,900 and $4,040, with price respecting both the upper and lower boundaries

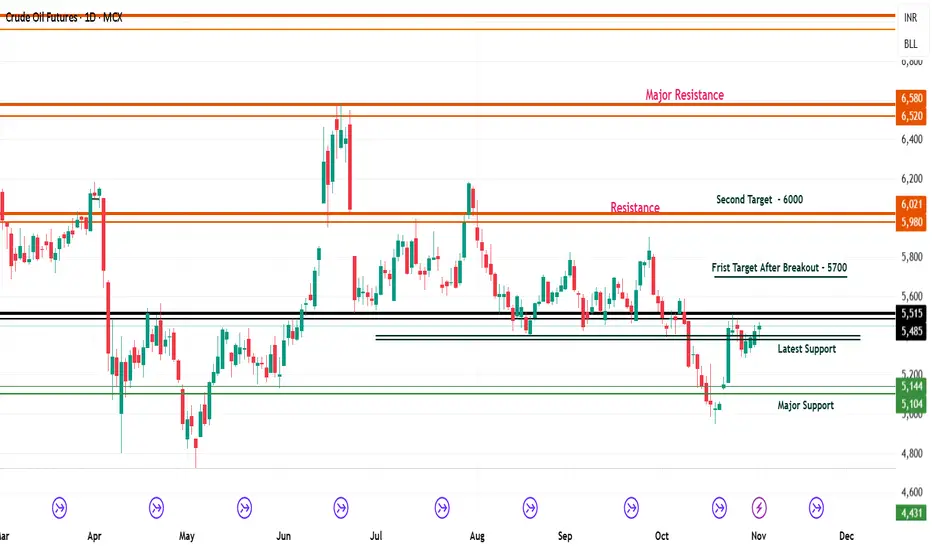
Crude Oil Futures Technical Analysis with TargetsCrude Oil Futures (MCX) Technical Analysis – Key Levels and Price Outlook
(November 2025 Update)
- Crude oil prices have shown some recovery this week after a continuous downtrend seen in October.
- The market is now trying to build a base above ₹5,10
Prime area for reversalThere has been an explosive price surge that is not supported by corresponding volume, and the chart is currently near its seasonal highs. This move appears overextended, increasing the likelihood of a gap-filling correction in the near term. Traders should watch closely for signs of reversal, as in

Gold Range Compression — Breakout Imminent🟥 Resistance Zone (Key Supply Zone): 4028 – 4045
Price has tested this zone multiple times but failed to break through.
A clean break above this red zone will signal strong bullish continuation.
🟦 Support Zone (Key Demand Zone): 3995 – 4005
This is the immediate support keeping price from falling

LiamTrading - $XAUUSD$: Second Scenario – BUY UP Priority ...LiamTrading - OANDA:XAUUSD $: Second Scenario – BUY UP Priority After BREAKING RESISTANCE $4002$
With the Support of the US Treasury Secretary
Hello traders community, LiamTrading is back with detailed OANDA:XAUUSD $ analysis for the start of the week!
The Gold market is receiving strong support

See all futures ideas
Intraday EURUSD Selling Levels EURUSD available at Daily Support become resistance zone so at H1 two key levels available that may do continuation of trend till bigger supports

Market ThinkingThe market had been under pressure, but now it’s starting to show some bullish momentum building up — higher lows are forming, and each dip is getting bought up a little faster.
The entry around 0.6544 could be the start of a fresh upward impulse if price continues to hold above that zone. I’ll be

USDJPY – Weekly Triangle Near a Big Decision !!The pair has been stuck inside a large weekly triangle formation, compressing price action after years of volatility. These types of structures usually lead to powerful breakouts, and the direction will depend on how the BoJ policy stance and the Fed’s rate cut cycle unfold.
Chart validation:
Pri

EUR/USD Outlook: Buyers Regain ControlThe EUR/USD market is beginning to show early signs of recovery momentum as sentiment gradually turns constructive. After an extended period of controlled weakness, the pair is attracting renewed interest from institutional participants positioning for a potential upward rotation in the coming sessi

AUD/CAD Approaching Support: Strong Bounce IncomingAUD/CAD has finished a strong 5-wave move to the upside, completing Wave (1)/(A). Since then, price has been moving in a corrective channel and is now forming an A-B-C decline toward the lower support zone. The current structure suggests one more push down to complete Wave C of (2)/(B), where buyers


GBP AUD BUYING SWING TIMEFRAME Buying GBPAUD on technical basis prices touched demand and gave further selling rejection and holding long till nearest supply. Also Stoploss is placed in system.

EURGBP - CONSOLIDATES AFTER BREAKOUT RUNSymbol - EURGBP
EURGBP continues to renew its local highs as part of an ongoing rally triggered by a breakout above consolidation resistance within a broader bullish trend.
The pair remains in a upward structure, with consolidation taking shape in the form of a bullish continuation pattern, reflec

EUR/USD – Long SetupPrice swept liquidity below intraday low and tapped into demand zone. Strong bullish reaction confirms short-term reversal probability.
Entry taken on confirmation candle with tight invalidation and clear liquidity target above 1.1520.
Bias: Bullish (Scalp to Intraday)
Entry: 1.1509
SL: 1.1505
TP:

AUDCAD Short_Elliot Wave I anticipate a bearish trend in AUDCAD, potentially completing a five-wave downward movement. The trade setup offers a risk-to-reward ratio of 1:3. Please conduct your own research before making any investment decisions."

See all forex ideas
| - | - | - | - | - | - | - | - | ||
| - | - | - | - | - | - | - | - | ||
| - | - | - | - | - | - | - | - | ||
| - | - | - | - | - | - | - | - | ||
| - | - | - | - | - | - | - | - | ||
| - | - | - | - | - | - | - | - | ||
| - | - | - | - | - | - | - | - | ||
| - | - | - | - | - | - | - | - | ||
| - | - | - | - | - | - | - | - |
Trade directly on the supercharts through our supported, fully-verified and user-reviewed brokers.


