VST Tillers"Here’s a quick breakdown of a beautiful daily setup on VST Tillers.
After a strong 75% move earlier, the stock spent months forming a tight re-accumulation base.
Low volatility… higher lows… and price is surfing the 8 and 21 EMAs perfectly.
Last few days?
Super tight candles… almost no volatility

The best trades require research, then commitment.
Get started for free$0 forever, no credit card needed

Scott "Kidd" PoteetThe unlikely astronaut

Where the world does markets
Join 100 million traders and investors taking the future into their own hands.

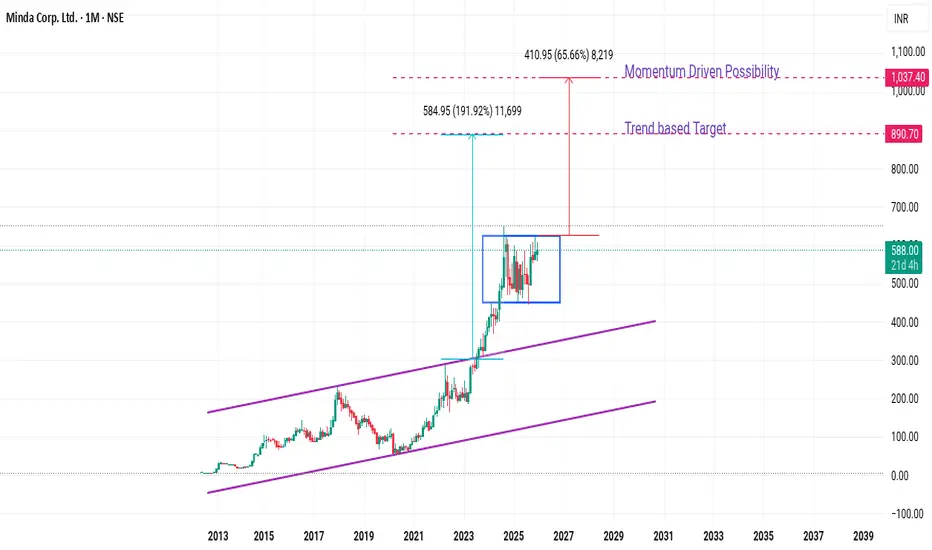
Minda Corp: A Technical Breakout Story with Strong FundamentalsThe chart reveals a compelling multi-year growth trajectory. From 2013 to 2023, Minda traded within a well-defined upward channel, building a strong foundation between ₹100-400 levels. The real excitement began in 2023 when the stock broke out of a decade-long accumulation pattern.
The most signifi
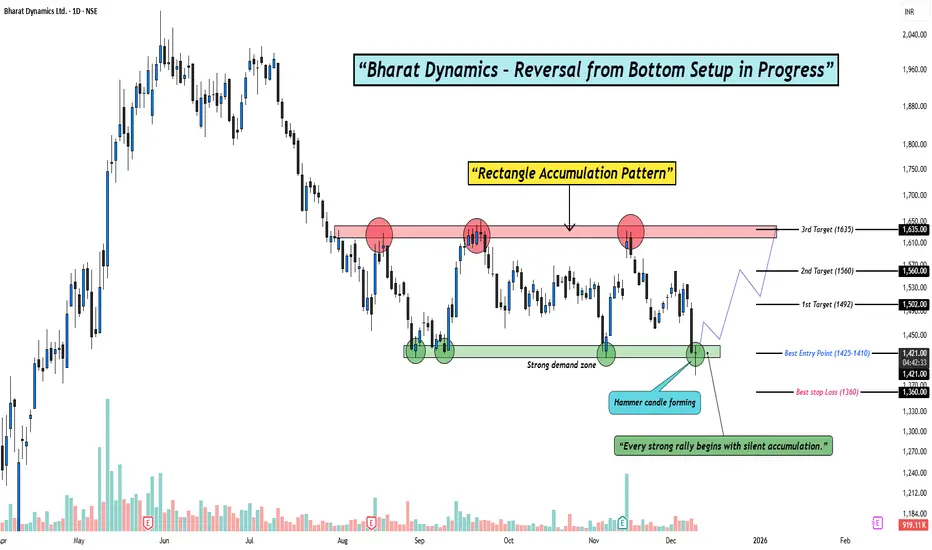
Smart Money Accumulating BDL — Are You Watching This Setup?Hello Traders!
Today’s analysis is on Bharat Dynamics Ltd. (BDL) where a clear Reversal from Bottom Setup is developing. After weeks of sideways consolidation, the stock has formed a clean Rectangle Accumulation Pattern right above a strong demand zone. The latest Hammer candle appearing insid
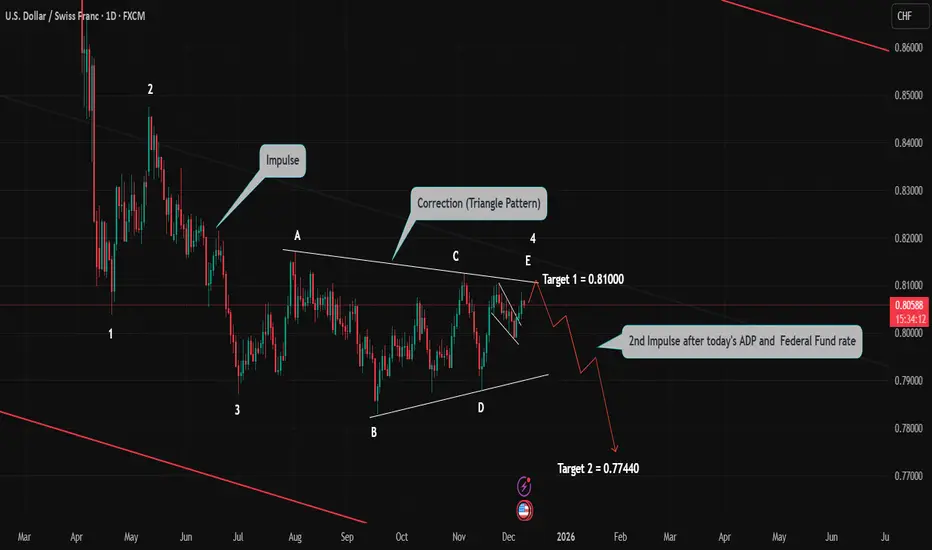
USD/CHF in Daily time frameBy Wave Analysis, Initial move to little upside for the target1 mentioned in the chart. Once the "E" wave of Triangle pattern completed, then strong impulse of downside to Target 2 is expected.
Technically the pattern is ready for big move, but fundamentally ADP and Federal fund's rate will decide
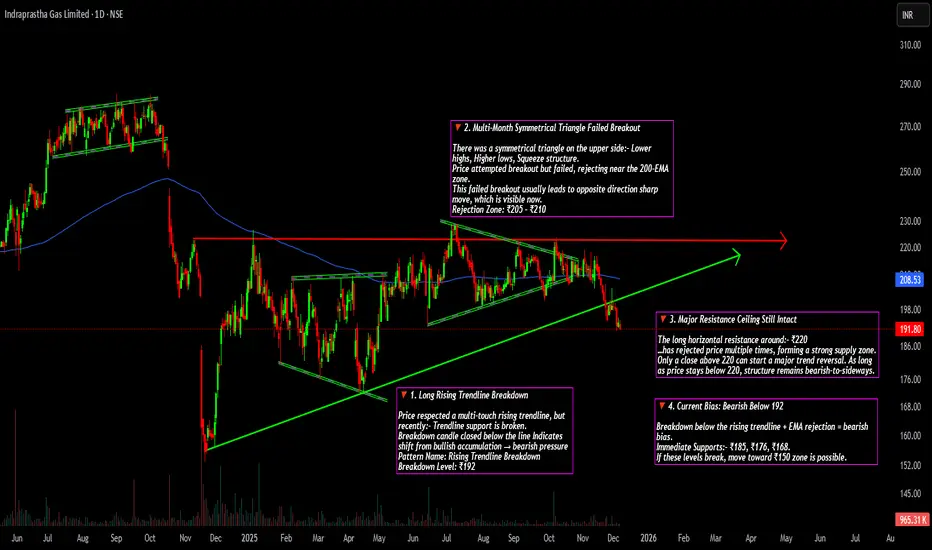
IGL – Structure & Pattern Breakdown🔻 1. Long Rising Trendline Breakdown
Price respected a multi-touch rising trendline, but recently:- Trendline support is broken.
Breakdown candle closed below the line Indicates shift from bullish accumulation → bearish pressure
Pattern Name: Rising Trendline Breakdown
Breakdown Level: ₹192.
🔻 2.
NALCO (W) - Strongly Bullish - Fundamentally-Driven BreakoutTimeframe: Weekly | Scale: Linear
The stock has confirmed a major structural breakout, shattering a 2-year consolidation ceiling. This move is supported by a "trifecta" of bullish factors: a technical breakout to new ATHs, rising volume, and stellar quarterly earnings.
🚀 1. The Fundamental Catal

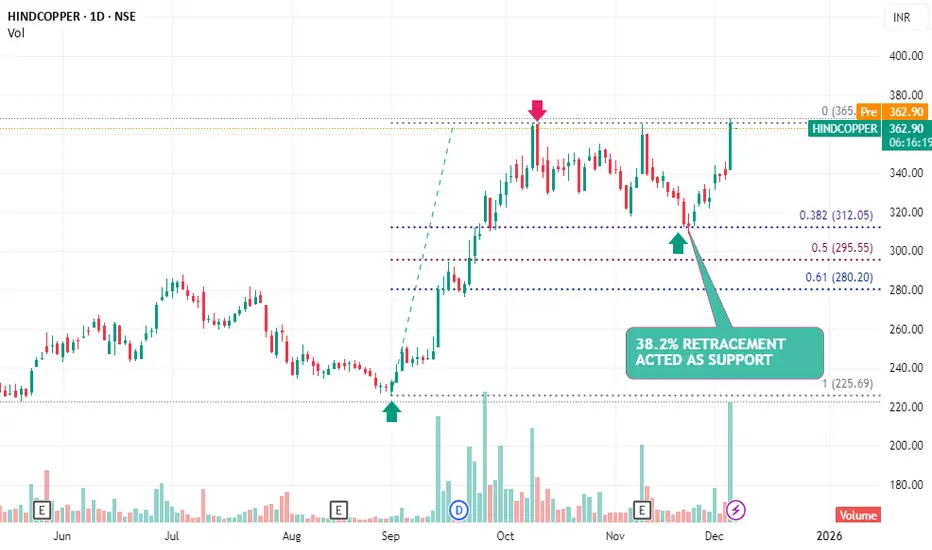
HINDCOPPER – Support at 38.2% Retracement With Reversal SignalHIHINDCOPPER has respected the 38.2% Fibonacci retracement level, indicating that buyers are active at this key support zone. The formation of a reversal candle (DOJI) at this level strengthens the probability of a reversal from the recent corrective decline.
Technical Highlights
Price retraced to th
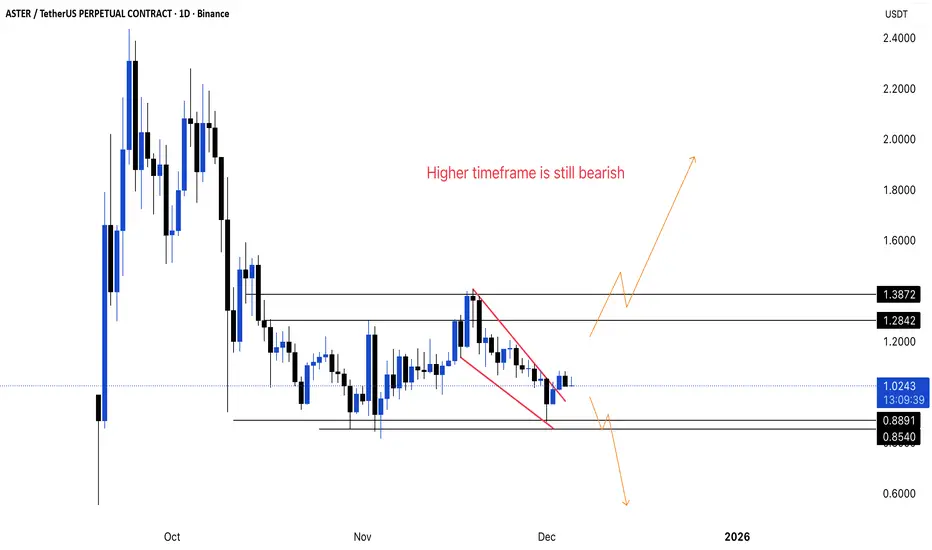
ASTER - what going to happen?📊 ASTER/USDT Update
🔎 Technical Observation:
- The pair is trading within a descending channel/falling wedge pattern, indicating a period of consolidation after a sharp decline.
- Price action shows compression near the apex of this wedge, suggesting imminent volatility.
- The chart explicitly no
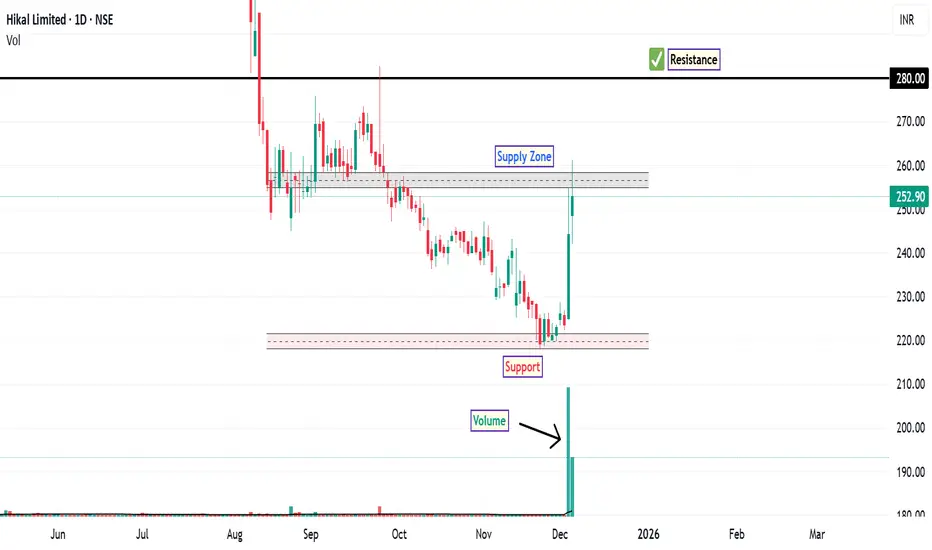
Hikal: Trend Shift and Key LevelsThe stock of Hikal Ltd . experienced a significant breakdown below its major support level of ₹331 in July, marking a continuation of its bearish phase. After testing the discount zone which is now major support zone, the stock rebounded sharply with high trading volume, signaling renewed buying in
Jubilant Foodworks Near Long Term SupportJubilant Foodworks swiftly moving in a Parallel Channel since it got listed in the secondary market. Stock respected the channel's boundaries on several occasions. Now it is very near to its support on both log & linear (caption image) charts. Support zone range from 570 to 525 for double to four ti

See all editors' picks ideas
Volume Gaps & Imbalances (Zeiierman)█ Overview
Volume Gaps & Imbalances (Zeiierman) is an advanced market-structure and order-flow visualizer that maps where the market traded, where it did not, and how buyer-vs-seller pressure accumulated across the entire price range.
The core of the indicator is a price-by-price volume prof

Match Finder [theUltimator5]Match Finder is the dating app of indicators. It takes your current ticker and finds the most compatible match over a recent time period. The match may not be Mr. right, but it is Mr. right now. It doesn't forecast future connection, but it tells you current compatibility for today.
Jokes aside,

Trend Line Methods (TLM)Trend Line Methods (TLM)
Overview
Trend Line Methods (TLM) is a visual study designed to help traders explore trend structure using two complementary, auto-drawn trend channels. The script focuses on how price interacts with rising or falling boundaries over time. It does not generate trade sign

Breakouts & Pullbacks [Trendoscope®]🎲 Breakouts & Pullbacks - All-Time High Breakout Analyzer
Probability-Based Post-Breakout Behavior Statistics | Real-Time Pullback & Runup Tracker
A professional-grade Pine Script v6 indicator designed specifically for analyzing the historical and real-time behavior of price after strong All-Ti

Count█ OVERVIEW
A library of functions for counting the number of times (frequency) that elements occur in an array or matrix.
█ USAGE
Import the Count library.
import joebaus/count/1 as c
Create an array or matrix that is a `float`, `int`, `string`, or `bool` type to count elements from, t

Holographic Market Microstructure | AlphaNattHolographic Market Microstructure | AlphaNatt
A multidimensional, holographically-rendered framework designed to expose the invisible forces shaping every candle — liquidity voids, smart money footprints, order flow imbalances, and structural evolution — in real time.
---
📘 Overview
The Hol

PriceFormatLibrary for automatically converting price values to formatted strings
matching the same format that TradingView uses to display open/high/low/close prices on the chart.
█ OVERVIEW
This library is intended for Pine Coders who are authors of scripts that display numbers onto a user's charts. T

LogNormalLibrary "LogNormal"
A collection of functions used to model skewed distributions as log-normal.
Prices are commonly modeled using log-normal distributions (ie. Black-Scholes) because they exhibit multiplicative changes with long tails; skewed exponential growth and high variance. This approach i

Range Oscillator (Zeiierman)█ Overview
Range Oscillator (Zeiierman) is a dynamic market oscillator designed to visualize how far the price is trading relative to its equilibrium range. Instead of relying on traditional overbought/oversold thresholds, it uses adaptive range detection and heatmap coloring to reveal where pri

Volume Surprise [LuxAlgo]The Volume Surprise tool displays the trading volume alongside the expected volume at that time, allowing users to spot unexpected trading activity on the chart easily.
The tool includes an extrapolation of the estimated volume for future periods, allowing forecasting future trading activity.
🔶 U

See all indicators and strategies
Community trends
VST Tillers"Here’s a quick breakdown of a beautiful daily setup on VST Tillers.
After a strong 75% move earlier, the stock spent months forming a tight re-accumulation base.
Low volatility… higher lows… and price is surfing the 8 and 21 EMAs perfectly.
Last few days?
Super tight candles… almost no volatility
Canara Bank long entryweekly tf is bullish we are planning for taking a bullish entry on the retest area with multiple confirmations like fibonacci and ema

Minda Corp: A Technical Breakout Story with Strong FundamentalsThe chart reveals a compelling multi-year growth trajectory. From 2013 to 2023, Minda traded within a well-defined upward channel, building a strong foundation between ₹100-400 levels. The real excitement began in 2023 when the stock broke out of a decade-long accumulation pattern.
The most signifi
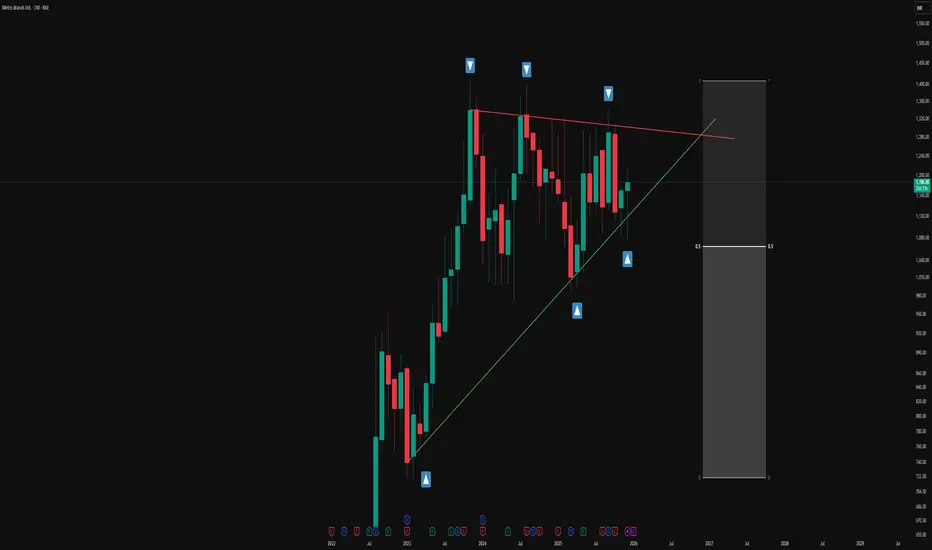
Simple Triangle Pattern on a Monthly Time FrameOverview -
This monthly chart illustrates a symmetrical triangle pattern defined by a series of higher lows and relatively stable swing highs, framed by a green ascending trendline and a red counter-trendline. The structure is presented in an observational manner to highlight how price has evolved
BUY TODAY SELL TOMORROW for 5%DON’T HAVE TIME TO MANAGE YOUR TRADES?
- Take BTST trades at 3:25 pm every day
- Try to exit by taking 4-7% profit of each trade
- SL can also be maintained as closing below the low of the breakout candle
Now, why do I prefer BTST over swing trades? The primary reason is that I have observed that

BRITANNIA — Compression Breakout Loading!Britannia has been squeezing between:
🔹 Downward resistance trendline
🔸 Flat rising demand zone
Every time price tapped the bottom support → buyers stepped in
11+ rejections from support → demand is very strong here ✔️
This creates pressure for a breakout on the upside soon 🚀

#KAYNES Hits Short-Term Support — Bigger Levels Ahead!📉 🚨
KAYNES is trading inside a falling channel and just tested the bottom of the yellow channel , triggering a short-term bounce 🔄
But this isn’t a long-term support zone — no bottom fishing here!
Price can still slide toward 3113–3249 or even 2158–2362 , where true bottoming signals may

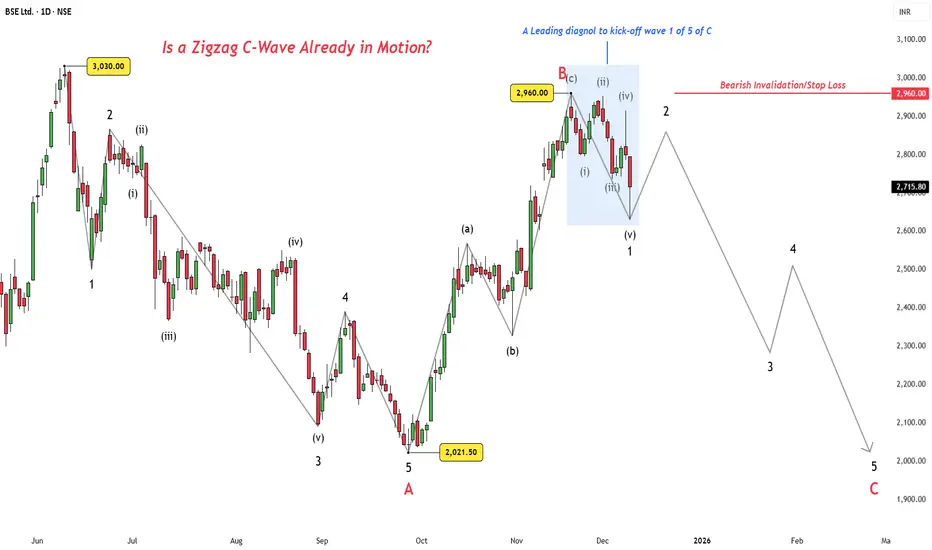
BSE: Wave B Topped, C-Wave Path in FocusContext
BSE looks like it topped out at Wave B, and the price action since then is starting to align with a fresh downside leg.
Wave Count View
Wave A completed in five waves with extended wave 3, Wave B retraced as a controlled three, and the drop from 2960 fits the profile of a leading diagon
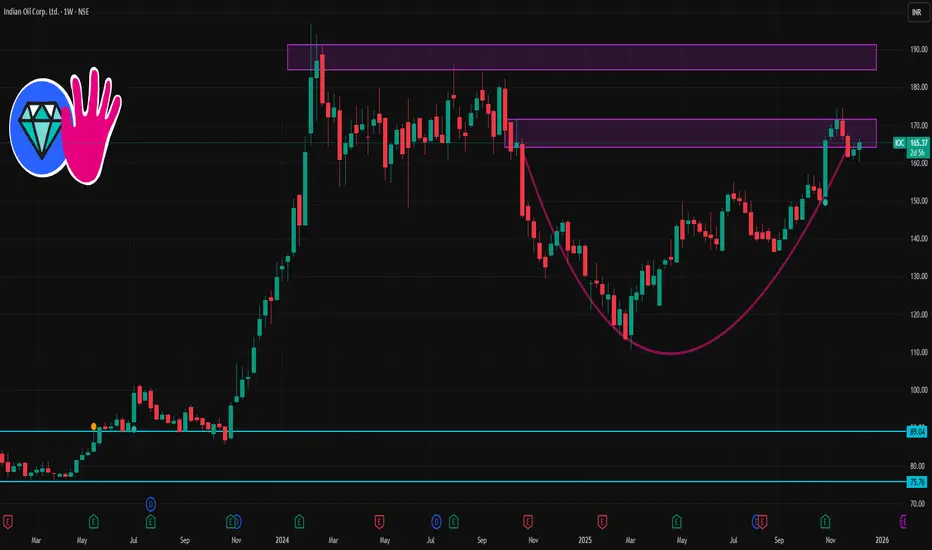
IOC 1 Week Time Frame 🔎 Current Snapshot
Latest price on NSE: ~ ₹163.00–₹163.50.
52‑week trading range: ₹110.72 (low) ⇒ ₹174.50 (high).
On moving averages: price is above 50‑day, 100‑day and 200‑day MA — a bullish structural sign, though short‑term oscillators are mixed/neutral.
Recent 1‑week performance: modest g
Inverse head and shoulder formed in reddington1. Inverse head and shoulder formation on Support levels showing buyers will take control from here
2. With minimum downside one can watch for long upside movement shown as target zone on charts
3. The strong movement has shown after result which tells us if movement continues then target may com

See all stocks ideas
No scheduled reports
Today
W
WOSALWestern Overseas Study Abroad Limited
Exchange
BSE
Offer price
0.628
USD
Today
FGHWestern Overseas Study Abroad Limited
Exchange
BSE
Offer price
0.628
USD
Today
L
LUXURYLuxury Time Limited
Exchange
BSE
Offer price
0.86 - 0.91
USD
Tomorrow
A
AUUDEncompass Design India Limited
Exchange
NSE
Offer price
1.12 - 1.19
USD
Tomorrow
F
FWSTCFlywings Simulator Training Centre Limited
Exchange
NSE
Offer price
2.01 - 2.12
USD
Dec 15
ANIMCorona Remedies Limited
Exchange
BSE
Offer price
11.20 - 11.80
USD
Dec 15
AKNProdocs Solutions Limited
Exchange
BSE
Offer price
1.46 - 1.53
USD
Dec 15
W
WAKEFITWakefit Innovations Limited
Exchange
BSE
Offer price
2.06 - 2.17
USD
Dec 17
5
544555Park Medi World Limited
Exchange
BSE
Offer price
1.71 - 1.80
USD
Dec 17
2
2539Nephrocare Health Services Limited
Exchange
BSE
Offer price
4.93 - 5.18
USD
See more events
Community trends
The Most Important Bitcoin Level of This Cycle — Don’t Miss It.Bitcoin is once again testing its multi-year rising support trendline, the same zone that has triggered every major rally since 2020. Price has repeatedly formed higher lows, showing that long-term buyers are still defending this structure.
What makes this zone special is the confluence:
A macr

$LUNA Finally Catching a breath After Brutal Red Days VIE:LUNA Finally Catching a breath After Brutal Red Days 😮💨
From Bloodbath to Bounce:
🔴 -99.88% massacre (RIP portfolios)
🟢 Now +286% relief at $0.23 From $0.06415 within 21 Days
▶️Major Downtrend line overhead
Major resistance at $0.30-0.38 ahead.
Potential bottom formation or dead cat bounce?

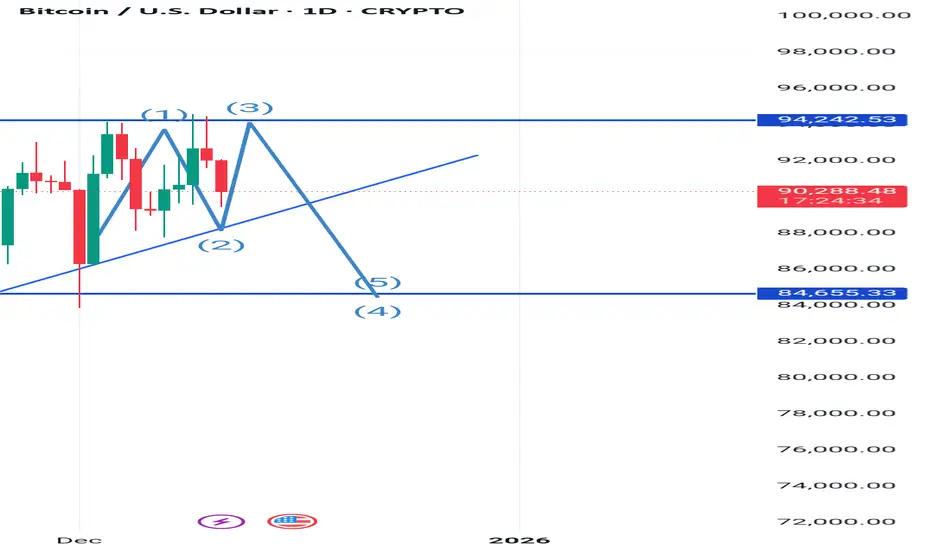
Bitcoin turns soon into BearishAs per wave analysis, Bitcoin going to controlled by bears for an 1st Target of 74500

BTCUSDT Price Action Analysis: Buy/Sell Zones, SL/TP, and Market1. Overall Trend
Your chart shows short-term bullish momentum inside a larger descending structure
(you have drawn a falling wedge / descending channel top).
👉 Short-term: bullish – strong impulsive green candle breaking through multiple intraday levels.
👉 Higher timeframe: bearish resistance over

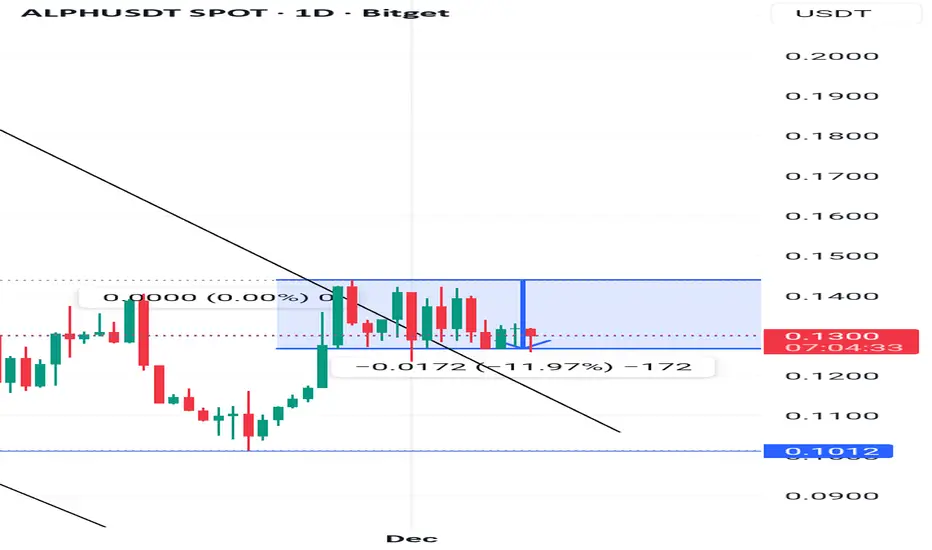
ALPHUSDT – Falling Wedge Breakout (1Day Timeframe)
ALPHUSDT has successfully broken out of the falling wedge and is now trading above the major trendline, showing early signs of strength.
ALPHUSDT is holding strongly above the 0.1250 support, showing active buying interest in this zone.
Below this level, the major trendline support adds additional
BCHUSD - The Squeeze is Tightening. Decision Imminent?BCH is providing a textbook example of Price Compression on the 4H timeframe.
When price gets squeezed between a rising trendline and horizontal levels, volatility usually follows. Currently, BCH is testing the validity of the trendline support.
Key Levels to Watch:
Support Defense: The bulls

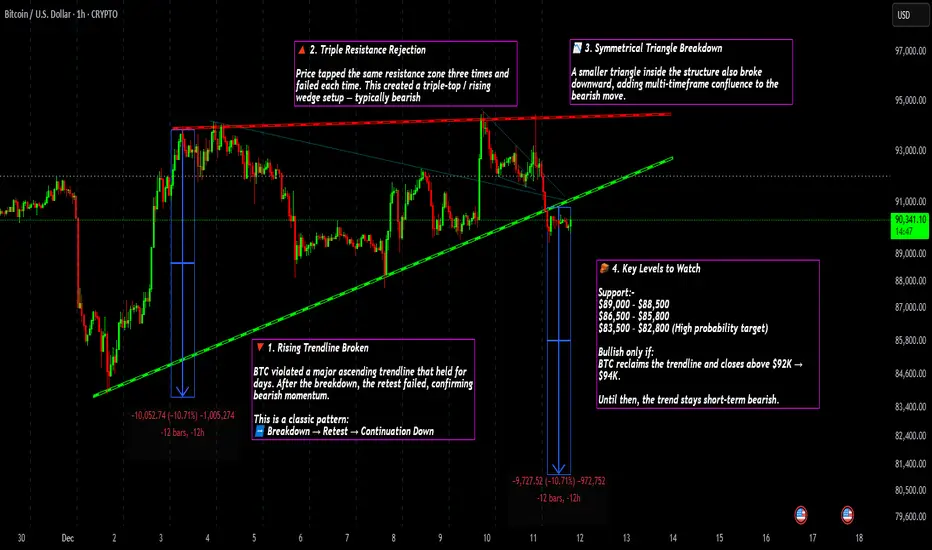
Bitcoin Breakdown Alert!🔻 1. Rising Trendline Broken
BTC violated a major ascending trendline that held for days. After the breakdown, the retest failed, confirming bearish momentum.
This is a classic pattern:
➡️ Breakdown → Retest → Continuation Down
🔺 2. Triple Resistance Rejection
Price tapped the same resistance zo
XAUUSD GOLD Analysis on (11/12/2025)#XAUUSD UPDATEDE
Current price - 4213
If price stay below 4240, then next target 4190,4162 and 4146 above that 4270
Plan;If price break 4214-4218 area, and stay below 4214, we will place sell order in gold with target of 4190,4162 and 4146 & stop loss should be placed at 4270

BTC short Topping Pattern Btc has created another top now compression zone is 75% complete expect a wick and big candle down today or latest starting 13

#BTC Showing a good down tredn move keep eye#BTC ON 1D
KEEP AN EYE BELOW 89350 WE CAN SEE BREAKDOWN AND GOOD SELLING MOVE TILL 87000....86000++
Here the logic
89350 is very big support its already tested many times so now its weak so we can see a good down trend move till 86000
See all crypto ideas
XAUUSD Short | 15m |Gold revisited the upper band of the intraday structure and showed clear signs of weakening momentum. Price failed to sustain above the model’s trailing zone, indicating a shift from short-term accumulation to distribution.
The short entry was executed as price broke back below the cloud, supported

Natural gas start buy ner 405 -395 SL 385 target 445, 470, 510 Parameter Data Data
Asset Name Natural Gas Futures (MCX) (Dec 2025 Contract)
Price Movement 🟥 Sharp Negative Momentum (LTP \sim ₹404.00/MMBTU / -4.20\% change)
Current Trade 🟥 SHARP SELL / CORRECTION (Testing key demand zone)
SMC Structure 🟨 Correction Phase (Higher High structure challenged; pullba

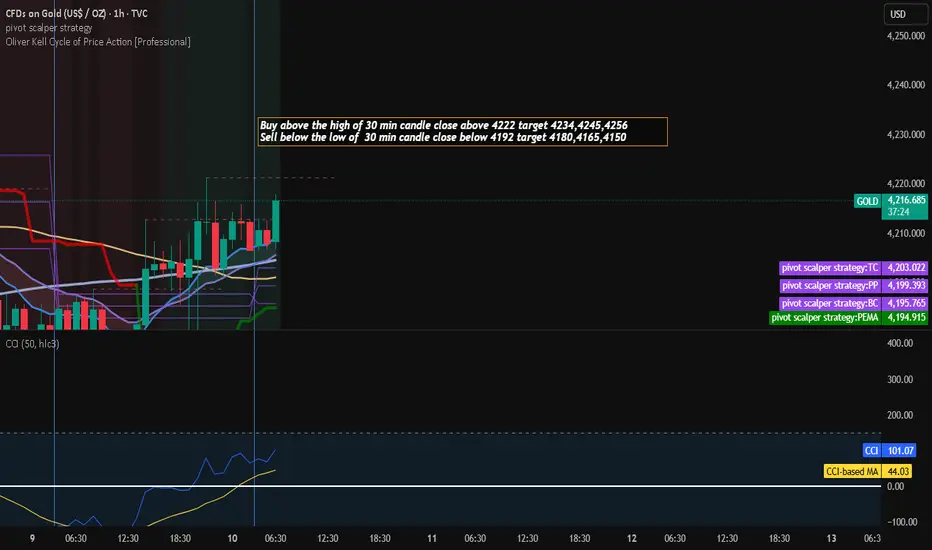
Gold Trading Strategy for 10th December 2025📊 GOLD INTRADAY TRADE SETUP (30-MIN STRATEGY)
🟢 BUY SETUP (Long Trade)
Trigger:
✔️ Enter ONLY if a 30-minute candle closes ABOVE 4222
✔️ Buy above the high of that breakout candle
🎯 Targets:
TP1: 4234
TP2: 4245
TP3: 4256
🛡️ Stop-Loss Suggestion:
Below the breakout candle low
Or place SL ar
Time to play with NattyLook for buying opportunity today. I doubt it will come but if it comes to 407 it's a straight buying opportunity. Even at 408/404. Fib Retracement it will not break. One can trade with big quantities.

XAUGSD VIEW 60.20 Above Sustain Strongly Then Up Move 63.50 65.00
60.20 Below Sustain Strongly Then Down Move 57.60 55.00

XAUUSD/GOLD 1H BUY PROJECTION 10.12.25“Character Invalid Here” (Lower Pink Zone)
This zone represents heavy sell pressure.
Price dropped deeply here → buyers were weak → sellers dominated.
From this area, the market started recovering upward slowly.
2️⃣ Day High as Resistance R1 (Middle Pink Zone)
This is a strong resistance level.

Elliott Wave Analysis XAUUSD – December 10, 2025
1. Momentum
D1:
The D1 momentum has already turned upward. Therefore, we expect an upward move on the daily timeframe lasting through the end of this week to complete the green wave C.
H4:
H4 momentum is currently turning down. If the current H4 candle closes confirming this downward signal, the ma

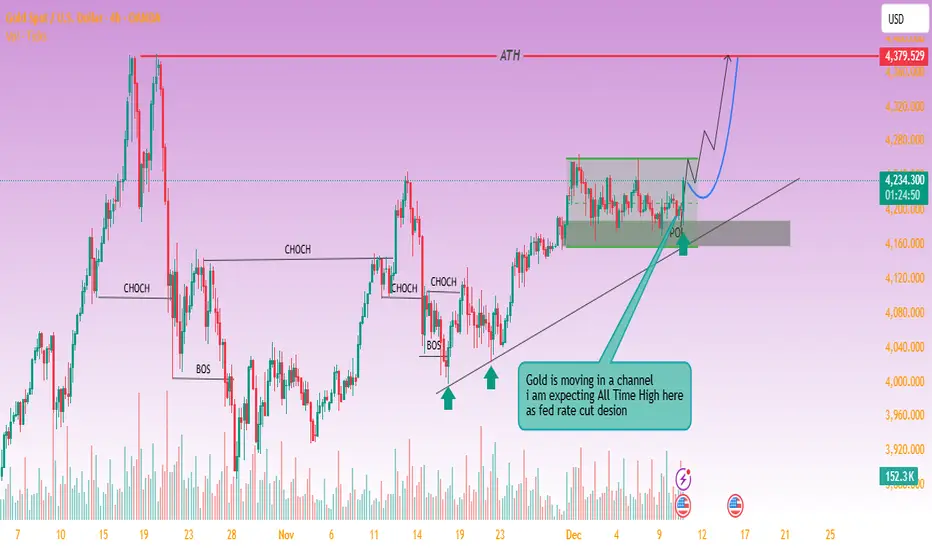
Gold Looks Prime for All-Time High Breakout📈 Technical Analysis of the Chart
The chart shows XAU/USD (Gold vs. USD) moving in what appears to be an upward-sloping channel — higher lows are marked by trend-line support.
Price recently revisited the lower boundary (support zone + trendline) and appears to have held firm — a bullish signal (i
XAUUSD on Sell Mode ! Says Technical Pattern. This trade idea is a classic bearish breakout from a rising/symmetrical triangle, using the triangle’s height to project the short target and take‑profit zone.
What the triangle shows
- Price has been in an uptrend, then starts compressing between a rising support line and a relatively flat/slowl

Gold Hits Buy Zone – Wait! Here's What to Confirm…◆ Market Context
On the M30 chart, the market shows a shift from a downtrend to a short-term recovery phase after forming BOS and CHoCH at the nearest bottoms. However, the upward movement has hit a prolonged downtrend line and reacted sharply downward again. This indicates that the trendline and up

See all futures ideas
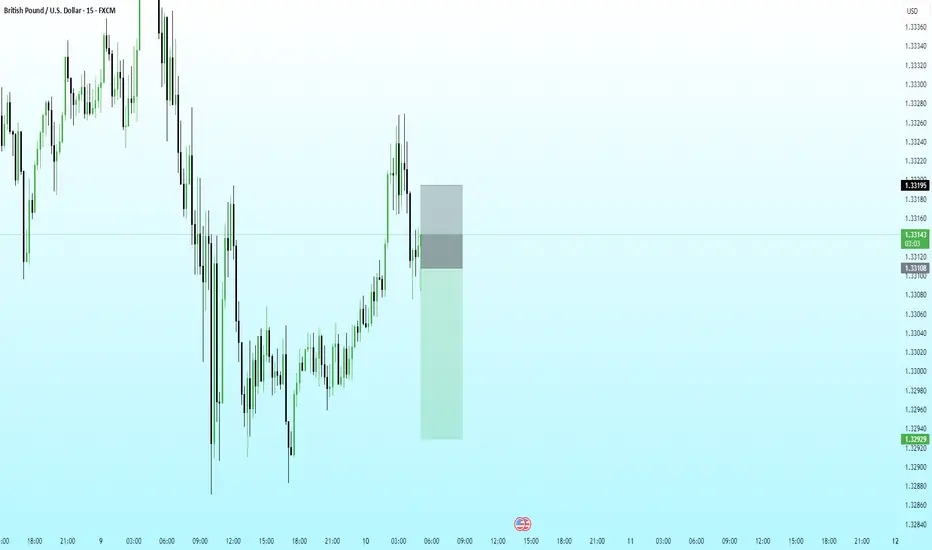
GBPUSD Short | 15m | Structural RejectionPrice tapped into a minor premium zone after an extended corrective leg and immediately showed rejection through a sharp bearish response. The preceding move lacked impulsiveness, suggesting it was corrective rather than a trend continuation.
The short entry is based on:
• Retest of prior micro-st
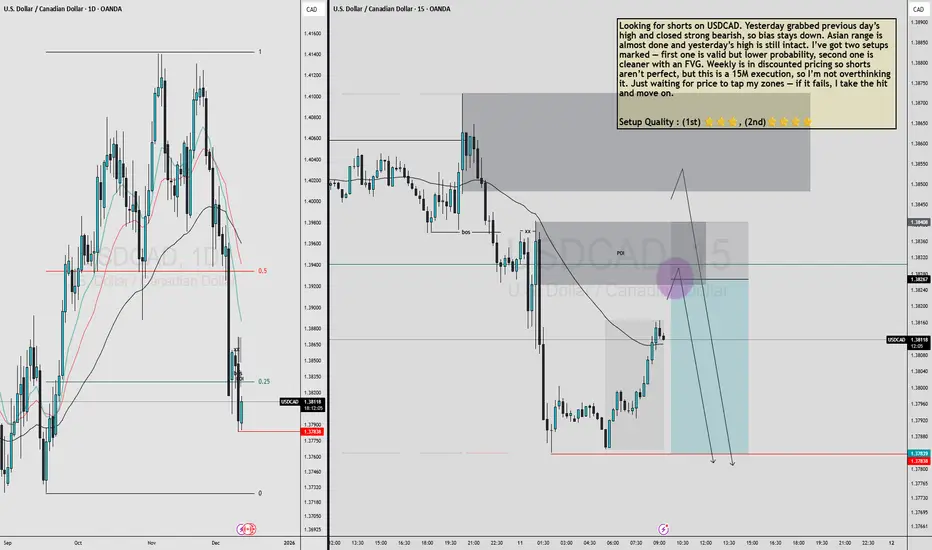
USDCAD MULTI TIMEFRAME ANALYSIS Looking for shorts on USDCAD. Yesterday grabbed previous day’s high and closed strong bearish, so bias stays down. Asian range is almost done and yesterday’s high is still intact. I’ve got two setups marked — first one is valid but lower probability, second one is cleaner with an FVG. Weekly is in d
USDJPY LONGprice came to retest the daily demand area and gave a ltf confirmation on 15.
study the reaction at marked levels

Eur cad trade A good resistance in EurCad if this resistance break and up move continue the good trade we will capture focus on level and patiencly wait for level breakthrough

USD/CHF in Daily time frameBy Wave Analysis, Initial move to little upside for the target1 mentioned in the chart. Once the "E" wave of Triangle pattern completed, then strong impulse of downside to Target 2 is expected.
Technically the pattern is ready for big move, but fundamentally ADP and Federal fund's rate will decide
usdjpy shortA major currency pair in forex that shows how many Japanese yen are needed to buy one US dollar. Traders watch it for interest-rate differences, risk sentiment, and Bank of Japan vs. Federal Reserve policy. It’s known for strong trends and volatility, especially around economic data release

USDINR Wave 5 Update | Elliott Wave Analysis | 8 Dec 2025🧠 Wave Structure
USDINR is currently progressing inside a clean Elliott Wave 5 advance.
Price remains strongly supported inside a rising parallel channel and continues respecting the trend structure.
Wave progression so far:
Wave 1 – Completed near ₹88.80
Wave 2 – Corrective low near ₹87.60
Wave 3

EURUSD_Analysis_15m_8_Dec15m swing is bullish
15m Internal is Bearish (But may be taken its Pullback)
If Internal high is in control -- then we may see sell opportunity
If swing Low is in control -- then we may buy opportunity

NZDUSDAs you can see, price made a strong impulse to the upside, leaving an inefficient leg behind and creating a clean demand zone below, which also includes the 0.56000 candle.
I’m expecting a pullback lower into that area before looking for potential buys.
Let’s see how price develops.

See all forex ideas
| - | - | - | - | - | - | - | - | ||
| - | - | - | - | - | - | - | - | ||
| - | - | - | - | - | - | - | - | ||
| - | - | - | - | - | - | - | - | ||
| - | - | - | - | - | - | - | - | ||
| - | - | - | - | - | - | - | - | ||
| - | - | - | - | - | - | - | - | ||
| - | - | - | - | - | - | - | - | ||
| - | - | - | - | - | - | - | - |
Trade directly on Supercharts through our supported, fully-verified, and user-reviewed brokers.


