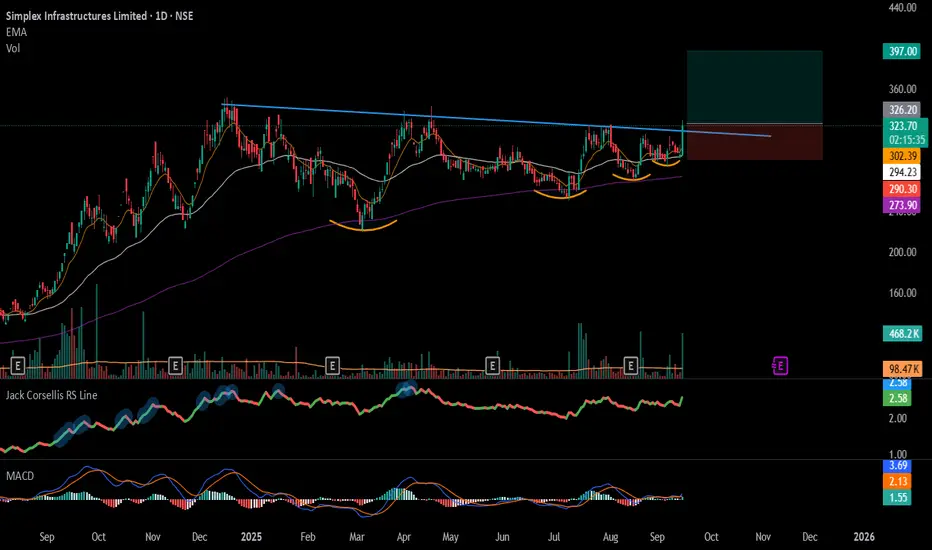
#SIMPLEXINF - TrendLine Breakout in Daily Time FrameScript: SIMPLEXINF
Key highlights: 💡⚡
📈 TrendLine Breakout in Daily Time Frame
📈 Volume spike during Breakout
📈 MACD Bounce
📈 Can go for a swing trade
BUY ONLY ABOVE 325 DCB
⏱️ C.M.P 📑💰- 322.25
🟢 Target 🎯🏆 – 22%
⚠️ Stoploss ☠️🚫 – 11%
⚠️ Important: Market conditions are Okish, Position size 50%

The best trades require research, then commitment.
Get started for free$0 forever, no credit card needed

Scott "Kidd" PoteetThe unlikely astronaut

Where the world does markets
Join 100 million traders and investors taking the future into their own hands.
Major indices
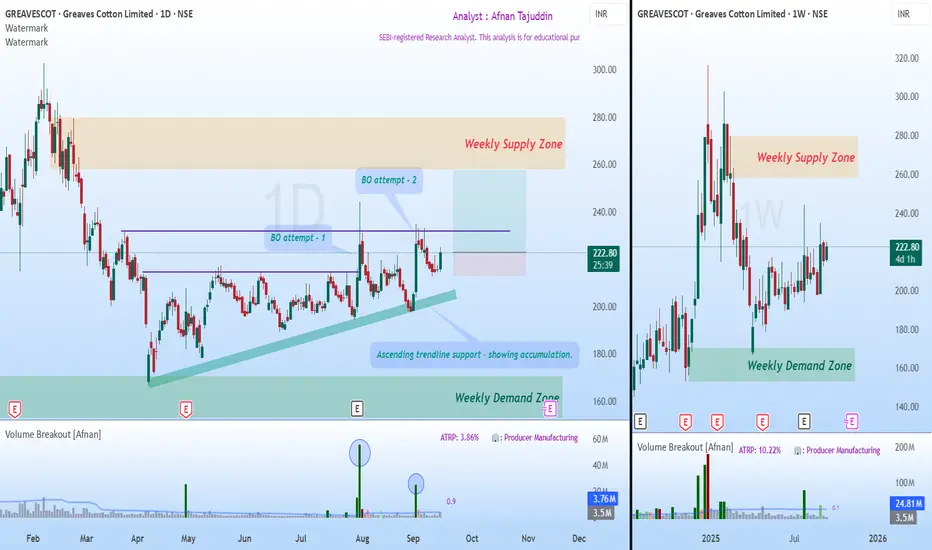
Accumulation and a Possible Breakout Towards Weekly Supply📈 Market Trend and Structure 📈
After forming an all-time high, price began its decline and developed a weekly supply zone . This supply zone now stands as the major target area for buyers.
Following the decline, price touched the weekly demand zone , which acted as a powerful reversal point
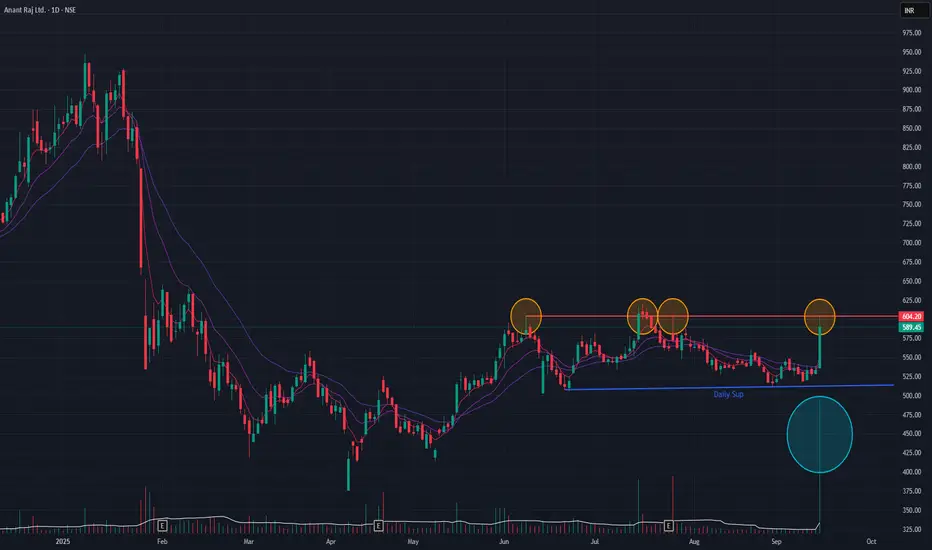
Anant Raj (Daily Timeframe) - Potential BreakOut candidate ??Following a downtrend that began in January 2025, Anant Raj has been in a sideways consolidation phase since May 2025. After several failed breakout attempts from this range, the stock demonstrated significant buying interest today, surging +10.53% on substantial volume.
While this move is positi
bankniftyI feel that bank nifty and axis bank has shown good recovery in the past two weeks. With axis bank closing over 200 dma and with strong gains for last three days, the momemtum should continue. Good time to buy for investors and traders as one can go positionally long here with targets of 1140 and

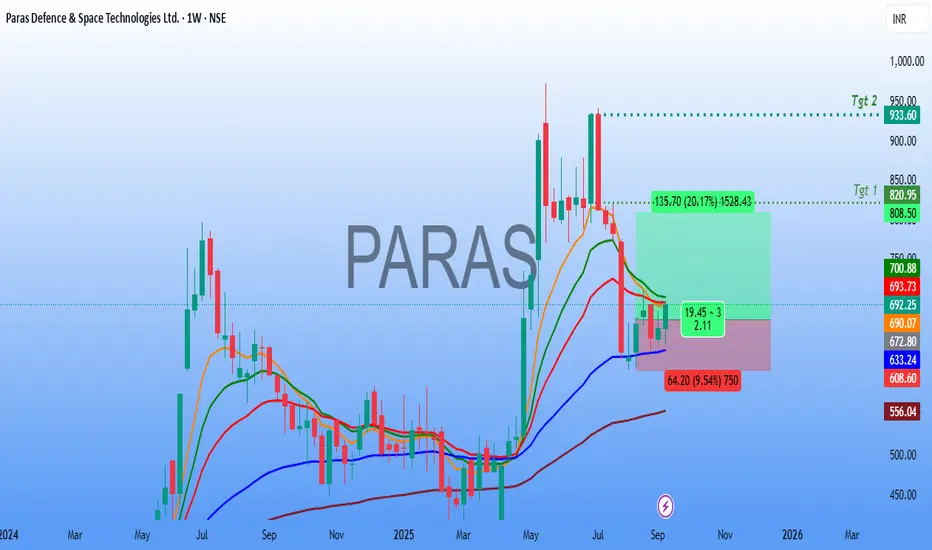
Paras Defence Technical Analysis🚀 Paras Defence & Space Technologies Ltd – Weekly Chart Analysis
The stock is showing signs of a potential reversal after consolidating near key support zones.
🔎 Technical Observations
Price Action:
After a prolonged decline from the highs, the stock has stabilized around the ₹640–660 support regi
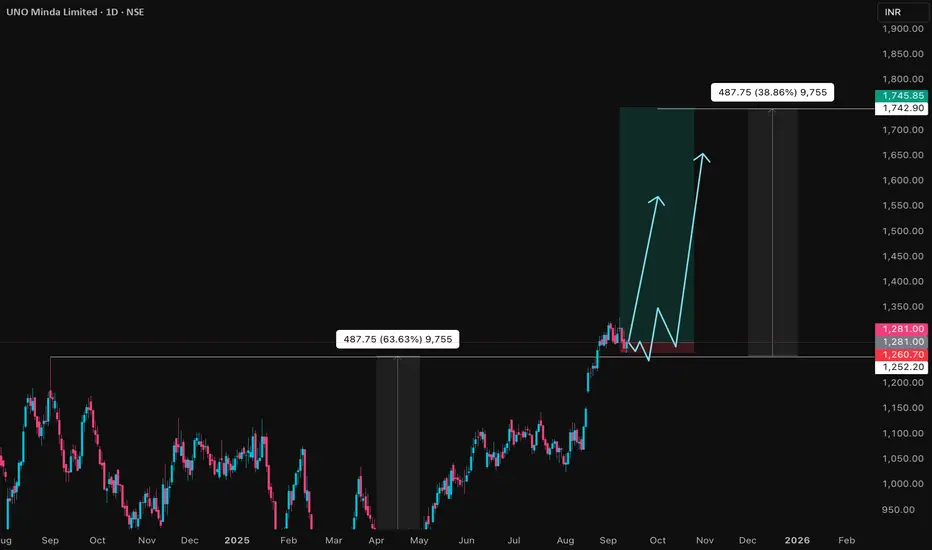
UNOMINDA Price ActionUNO Minda Ltd is trading at ₹1,282 as of September 12, 2025, delivering consistent financial and operational outperformance. For FY25, the company posted consolidated revenue of ₹16,775 crore, up 20% year-on-year, with net profit rising 9% to ₹936 crore. EBITDA grew 18% to ₹1,800 crore, and operatin
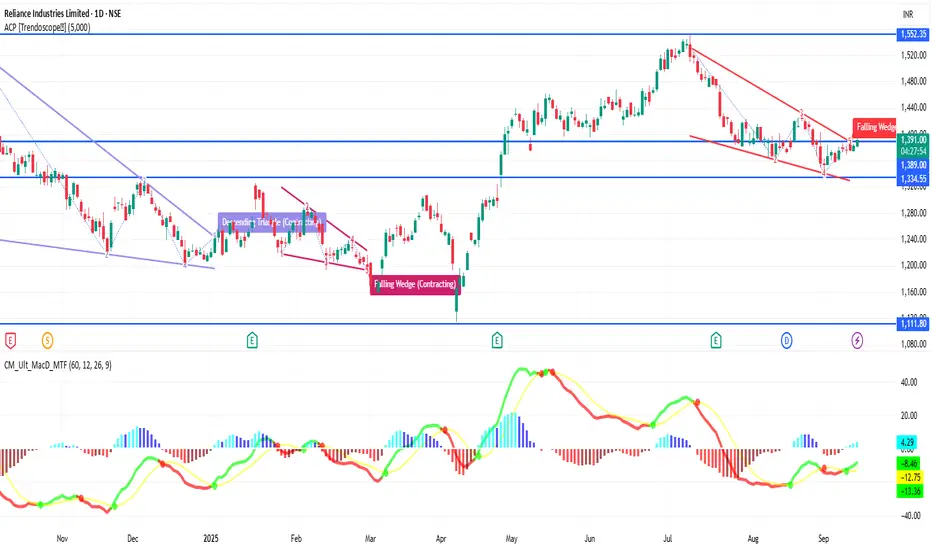
RELIANCE 1D Time frame🔢 Current Level
RELIANCE is trading around ₹1,391 – ₹1,392
🔑 Key Resistance & Support Levels
Resistance Zones:
₹1,392 – ₹1,396 (near-term resistance; breakout above this may lead to further upside)
₹1,400 (psychological resistance)
₹1,427 (stronger resistance above)
Support Zones:
₹1,380 – ₹
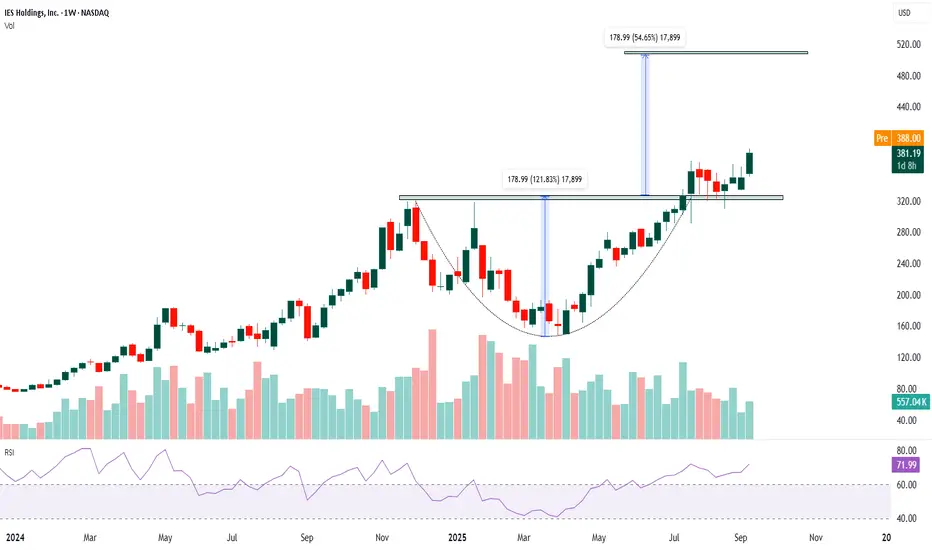
IESC- Long The chart shows a clear uptrend over the past year.
Price formed a rounded bottom (cup-shaped base) and has broken above the neckline near $320–$330, confirming a bullish continuation pattern. Current price around $381 indicates sustained bullish strength.
Volume rose meaningfully during the breakou
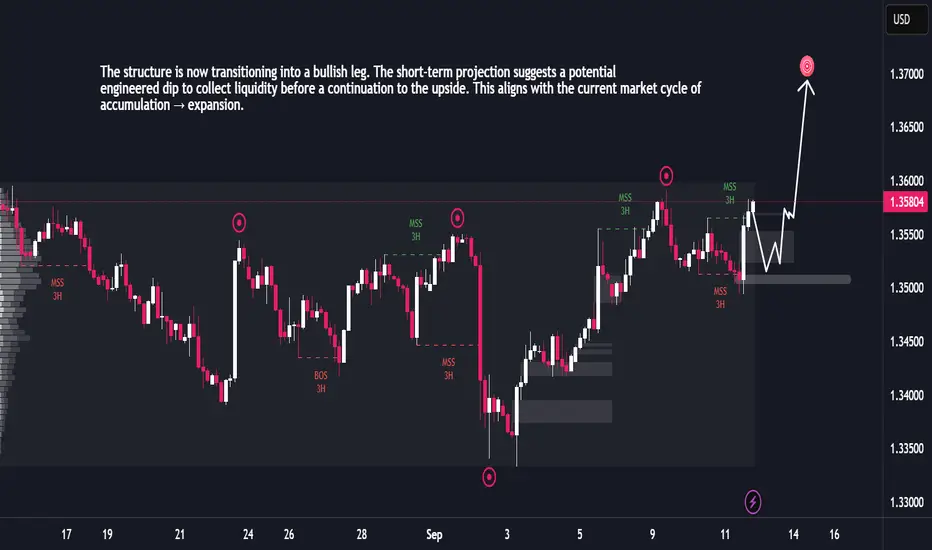
GBPUSD Ready for Expansion After Liquidity GrabThe market has been trading within a broad range, characterized by multiple liquidity grabs on both highs and lows. Each sweep has been followed by sharp reactions, confirming active smart money positioning. Recent price action shows a strong recovery after a downside liquidity sweep, indicating acc
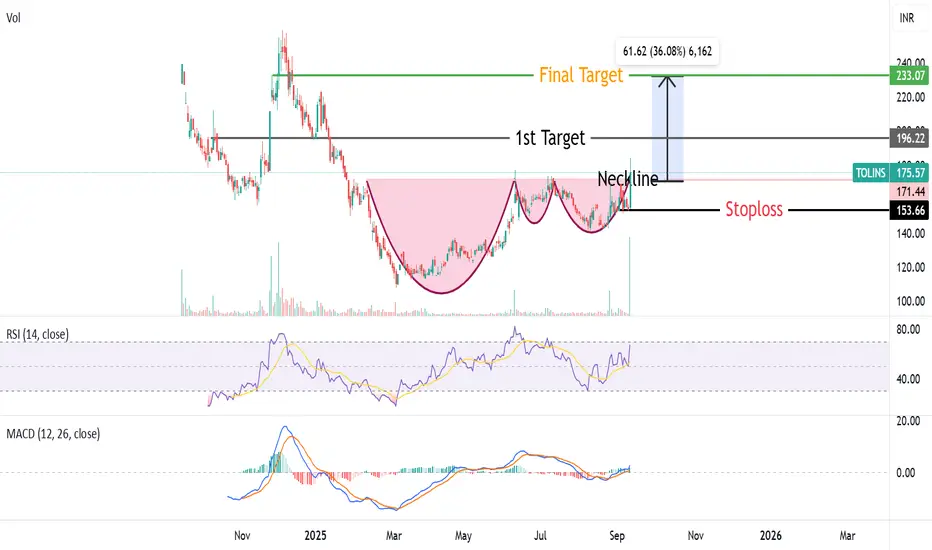
Complex Cup & Handle Pattern Breakout in TOLINS TyresTolins Tyres given Complex Cup & Handle Pattern Breakout from neckline arround 170 level. RSI & MACD also showing positive momentum ,Stock also trading above all important moving averages(50,10,200).Target of this breakout will be 230 Rs ,With a stoploss of 150Rs.
See all editors' picks ideas
Volume by Time [LuxAlgo]The Volume by Time indicator collects volume data for every point in time over the day and displays the average volume of the specific dataset collected at each respective bar.
The indicator overlays the current volume and the historical average to allow for better comparisons.
🔶 USAGE
Thr

FlowScope [Hapharmonic]FlowScope: Uncover the Market's True Intent 🔬
Ever wished you could look inside the candles and see where the real action is happening? FlowScope is your microscope for the market's flow, designed to give you a powerful edge by revealing the volume distribution that price action alone can't sh

VWAP Price ChannelVWAP Price Channel cuts the crust off of a traditional price channel (Donchian Channel) by anchoring VWAPs at the highs and lows. By doing this, the flat levels, characteristic of traditional Donchian Channels, are no more!
Author's Note: This indicator is formed with no inherent use, and serves

Fibonacci Sequence Circles [BigBeluga]🔵 Overview
The Fibonacci Sequence Circles is a unique and visually intuitive indicator designed for the TradingView platform. It combines the principles of the Fibonacci sequence with geometric circles to help traders identify potential support and resistance levels, as well as price expansio

ATAI Volume Pressure Analyzer V 1.0 — Pure Up/DownATAI Volume Pressure Analyzer V 1.0 — Pure Up/Down
Overview
Volume is a foundational tool for understanding the supply–demand balance. Classic charts show only total volume and don’t tell us what portion came from buying (Up) versus selling (Down). The ATAI Volume Pressure Analyzer fills that g

Market Cap Landscape 3DHello, traders and creators! 👋
Market Cap Landscape 3D. This project is more than just a typical technical analysis tool; it's an exploration into what's possible when code meets artistry on the financial charts. It's a demonstration of how we can transcend flat, two-dimensional lines and step into

ZigzagLiteLibrary "ZigzagLite"
Lighter version of the Zigzag Library. Without indicators and sub-component divisions
method getPrices(pivots)
Gets the array of prices from array of Pivots
Namespace types: Pivot
Parameters:
pivots (Pivot ) : array array of Pivot objects
Returns: array array

ZigzagLibrary "Zigzag"
Zigzag related user defined types. Depends on DrawingTypes library for basic types
method tostring(this, sortKeys, sortOrder, includeKeys)
Converts ZigzagTypes/Pivot object to string representation
Namespace types: Pivot
Parameters:
this (Pivot) : ZigzagTypes/Pivot

Angled Volume Profile [Trendoscope]Volume profile is useful tool to understand the demand and supply zones on horizontal level. But, what if you want to measure the volume levels over trend line? In trending markets, the feature to measure volume over angled levels can be very useful for traders who use these measures. Here is an att

MathEasingFunctionsLibrary "MathEasingFunctions"
A collection of Easing functions.
Easing functions are commonly used for smoothing actions over time, They are used to smooth out the sharp edges
of a function and make it more pleasing to the eye, like for example the motion of a object through time.
Easing function

See all indicators and strategies
Community trends
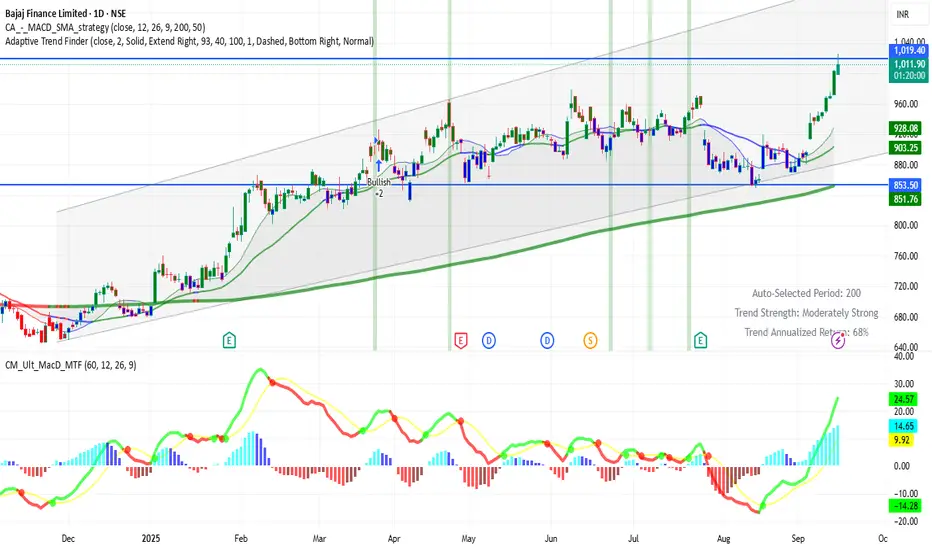
BAJFINANCE 1D Time frame
Current Price: ₹1018 (approx)
Day’s Range: ₹998 – ₹1,025.70
Previous Close: ₹970.25
🔹 Support & Resistance
Support 1: ₹981 – ₹960
Support 2: ₹947 – ₹934
Resistance 1: ₹1,030
Resistance 2: ₹1,049
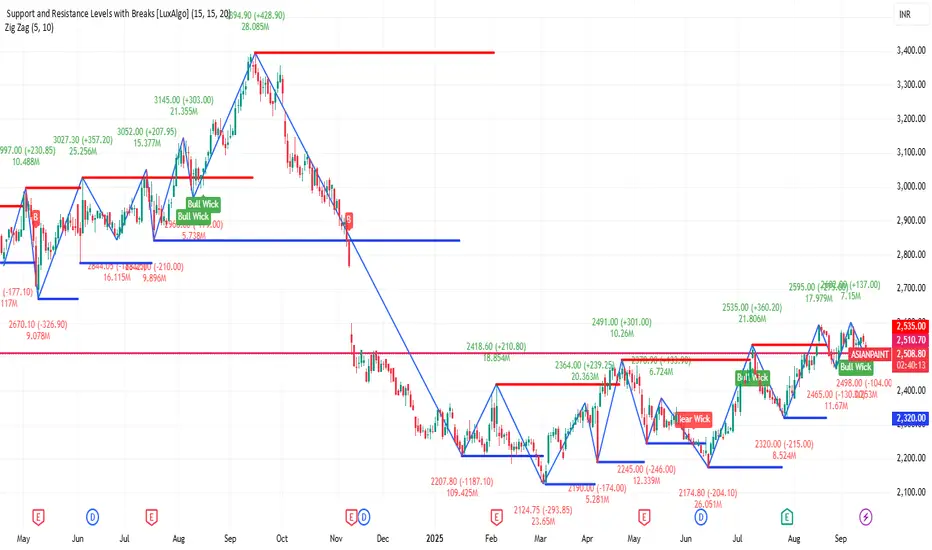
ASIANPAINT 1D Time frameToday's Trading Range:
Day's Range: ₹2,498.00 – ₹2,543.50
Opening Price: ₹2,535.10
Previous Close: ₹2,540.50
52-Week Range: ₹2,124.75 – ₹3,394.90
📈 Circuit Limits:
Upper Circuit Limit: ₹2,800.90
Lower Circuit Limit: ₹2,291.70
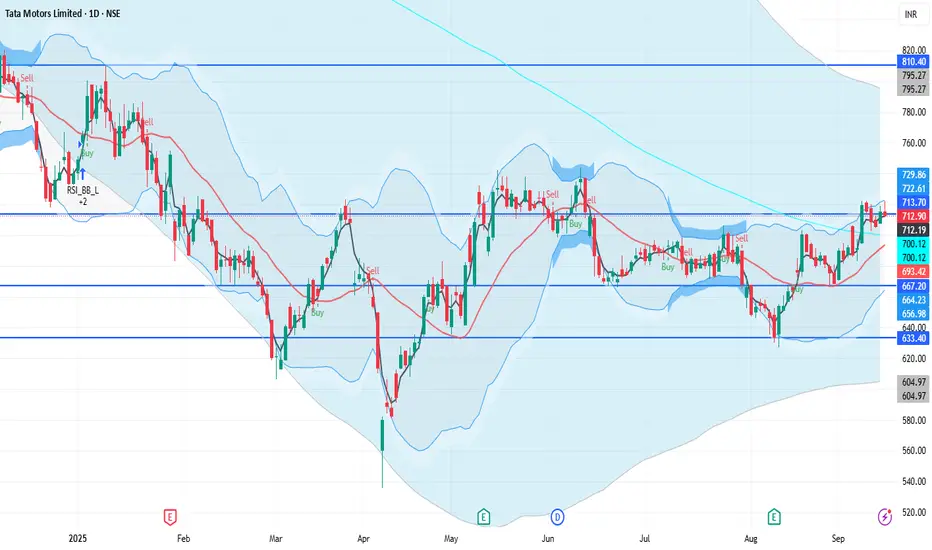
TATAMOTORS 1D Time frameUpdated Snapshot
Current Price: ₹712 – ₹715
Day’s Range: ₹712 – ₹721.95
Previous Close: ₹705.85
🔹 Support & Resistance
Support 1: ₹710 – ₹708
Support 2: ₹700 – ₹705
Resistance 1: ₹721 – ₹725
Resistance 2: ₹735 – ₹740
Accumulation and a Possible Breakout Towards Weekly Supply📈 Market Trend and Structure 📈
After forming an all-time high, price began its decline and developed a weekly supply zone . This supply zone now stands as the major target area for buyers.
Following the decline, price touched the weekly demand zone , which acted as a powerful reversal point
bankniftyI feel that bank nifty and axis bank has shown good recovery in the past two weeks. With axis bank closing over 200 dma and with strong gains for last three days, the momemtum should continue. Good time to buy for investors and traders as one can go positionally long here with targets of 1140 and
BRITANNIA INDUSTRIES LTD ( 1D ) 🔑 KEY LEVELS 🔑
✔ 6240 - 6300 Selling Zone.
✔ Trend Line Act As Resistance.
✔ RSI Also Overbought Zone.
🎯 TRADING PLAN 🎯
✔ Near the key levels , Bearish Harami
Candlestick Pattern has formed.
✔ The Entry Point is @ Below 6207.00
✔ The Stoploss Poin

#SIMPLEXINF - TrendLine Breakout in Daily Time FrameScript: SIMPLEXINF
Key highlights: 💡⚡
📈 TrendLine Breakout in Daily Time Frame
📈 Volume spike during Breakout
📈 MACD Bounce
📈 Can go for a swing trade
BUY ONLY ABOVE 325 DCB
⏱️ C.M.P 📑💰- 322.25
🟢 Target 🎯🏆 – 22%
⚠️ Stoploss ☠️🚫 – 11%
⚠️ Important: Market conditions are Okish, Position size 50%
Anant Raj (Daily Timeframe) - Potential BreakOut candidate ??Following a downtrend that began in January 2025, Anant Raj has been in a sideways consolidation phase since May 2025. After several failed breakout attempts from this range, the stock demonstrated significant buying interest today, surging +10.53% on substantial volume.
While this move is positi
See all stocks ideas
No scheduled reports
Community trends
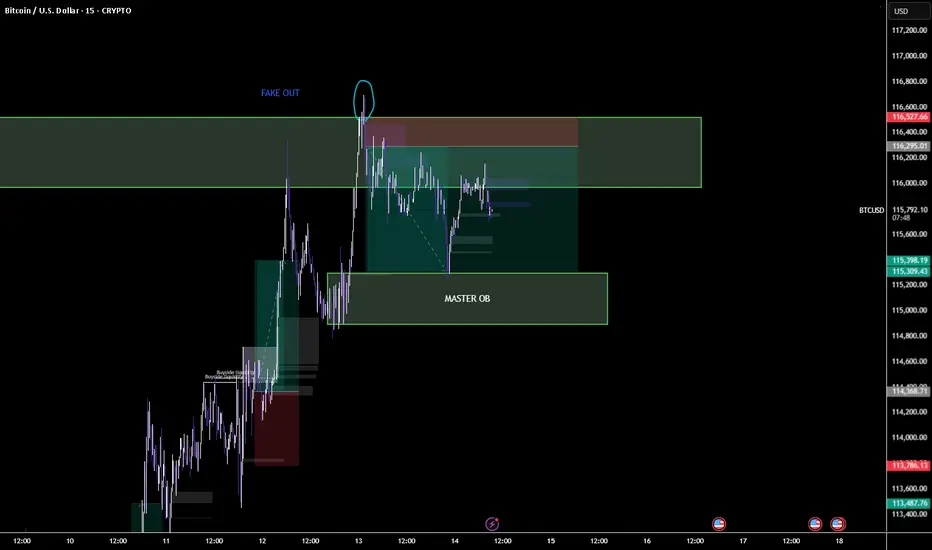
BTCUSD - Fakeout Trap & Master Order Block Setup
BTCUSD – Fakeout Trap & Master Order Block Setup
Price executed a clean **fakeout above liquidity** before dropping back into the **master order block zone**. This setup shows how liquidity hunts trap late buyers before respecting key OB demand. Watching for reaction from the **115.3k zone** to
BTCUSD | Buy & Sell Setup | 14 Sep 2025 – 10:58 ISTBTCUSD | Buy & Sell Setup | 14 Sep 2025 – 10:58 IST
Buy Zone: 116094.90 – 115961.20
Sell Zone: 115694.50 – 115411.20
Scenario : Buy
Entry: 115975.00
Stop Loss: 115690.00
Targets:
TP1 → 116257.50
TP2 → 117000.00
Analysis:
From Buy Zone (116094.90 – 115961.20) creates possibilities for a buy move

Ethereum sell sign in 15 min as per indicator To identify potential short-selling opportunities in the stock market, technical indicators can signal a stock is overbought, losing momentum, or entering a downtrend. Short-selling is a high-risk strategy, and these indicators are most effective when used togeth

DOGEUSD SHOWING A GOOD DOWN MOVE WITH 1:6 RISK REWARDDOGEUSD SHOWING A GOOD DOWN MOVE WITH 1:6 RISK REWARD DUE TO THESE REASON
A. its following a rectangle pattern that stocked the marketwhich preventing the market to move any one direction now it trying to break the strong resistant lable
B. after the break of this rectangle it will boost the marke

Btc long setupEntry Zone
🔵 $114,800 – $115,500
Stop-Loss
🔴 $113,800
Targets
🎯 TP1: $117,700
🎯 TP2: $118,700 – $119,000
Confluence:
Liquidity sweep ✅
Demand OB ✅
Discount entry
Imbalance fill ✅
Setup is asymmetric: Risk ~1% for potential 3–4% reward in 3–7 days.

BTC Price Action: Bulls vs BearsBTC Price Action: Bulls vs Bears
Bitcoin has shown a gradual recovery after a prolonged corrective phase, with market structure leaning toward a constructive buildup. Fundamentally, sentiment is influenced by global macro conditions—investors are watching U.S. monetary policy signals, while stable d

BTCUSDT Elliott Wave Analysis (2H Chart)Currently tracking a 5-wave Elliott structure:
Wave (1) initiated the bullish impulse.
Wave (2) retraced back with healthy correction.
Wave (3) extended strongly, showing momentum.
Wave (4) completed with a corrective pullback.
Wave (5) is in progress, approaching the liquidity zone between 117

MANTLEUSD - Breakout Setup, Move is ON..COINBASE:MANTLEUSD
✅ #MANTLEUSD trading above Resistance of 1.5340
✅ Next Resistance is at 2.6
Related charts:
Charts are self-explanatory. Levels of breakout, possible up-moves (where scrip may find resistances) and support (close below which, setup will be invalidated) are clearly defined

BITCUSDALWAYS TAKE TRADE WITH CONFIRMATION
Note : Trading in any financial market is very risky. I post ideas for educational purpose only. It is not financial advice. Do not hold us responsible for any potential loss you may incur. Please consult your financial adviser before trading.

a high freqeuency setup for ethusd best one fot septemebera high freqeuency setup for ethusd best one fot septemeber
possible buy for goodd money

See all crypto ideas
GOLD DAILY PLAN 15/09: SMC & Wyckoff Logic🔎 Market Overview
Market Structure (SMC): Price is currently moving inside a short-term descending channel but is showing signs of Wyckoff accumulation around the 3620–3635 zone (Liquidity BUY). This is a key support area.
Wyckoff: After a supply test, price is likely to consolidate and then push

XAUUSD SHOWING A GOOD DOWN MOVE WITH 1:10 RISK REWARD CPI UPDATEXAUUSD SHOWING A GOOD DOWN MOVE WITH 1:10 RISK REWARD DUE TO THESE REASON
A. its following a rectangle pattern that stocked the marketwhich preventing the market to move any one direction now it trying to break the strong resistant lable
B. after the break of this rectangle it will boost the marke

XAUUSD – Week 3: Will Fibo 2.618 Hold Strong?XAUUSD – Week 3: Will Fibo 2.618 Hold Strong?
Good day, fellow traders,
Gold has been on a continuous rise for the past three weeks, even making fresh all-time highs (ATH). This has made trading conditions quite challenging, especially for short-term traders. The reason is simple:
Buying: Not eas

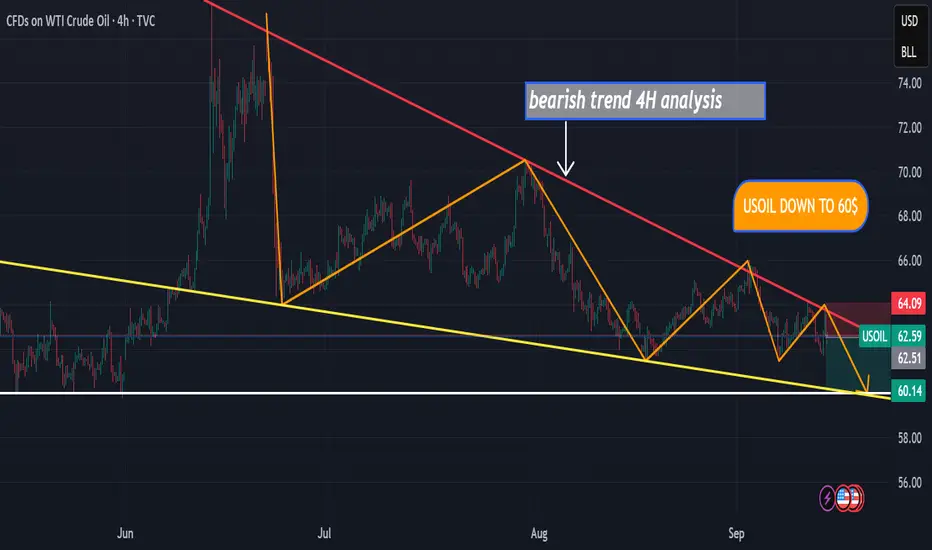
USOIL DOWN TO 60$hello,
I hope you’re doing well. I’ve identified a high-probability short setup on USOIL in the 4H timeframe. The chart is showing a clear downtrend, and based on the current momentum, I expect USOIL to reach the $60 level in the coming days
IBROURI Abdessamad
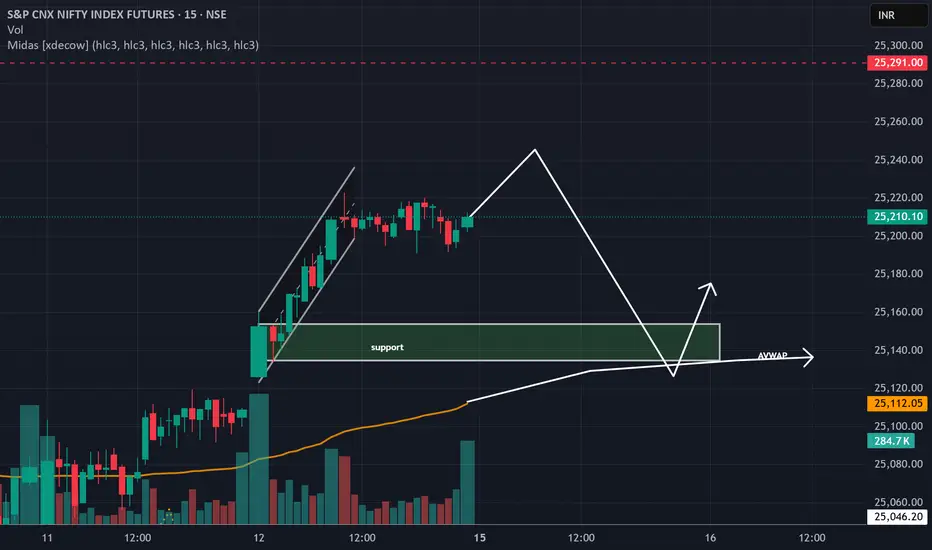
"Monday setup; Why Nifty may revisit 25120 zone"## 🎯 **Trading Scenario**
**IF** Nifty opens green on Monday and stays green until 10:40 AM:
### 📋 **Key Conditions to Watch:**
- ✅ Green opening sustained till 10:40 AM
- ❌ 25200 CE high of ₹60 should NOT be breached
- 📉 25200 CE price falls below ₹35 zone
### 🎯 **Expected Target:**
**Channel Lo
XAUUSD/GOLD 1H SELL PROJECTION 15.09.25XAUUSD/Gold 1H Sell Projection (15.09.25). Here’s a structured breakdown of what the chart indicates:
🔎 Chart Analysis
Entry Zone: Around 3646 – 3647 (confluence of trendline + 0.618 Fibonacci retracement = "Golden Ratio").
Stop Loss: Around 3653.16 (above trendline & key resistance).
Take Profi

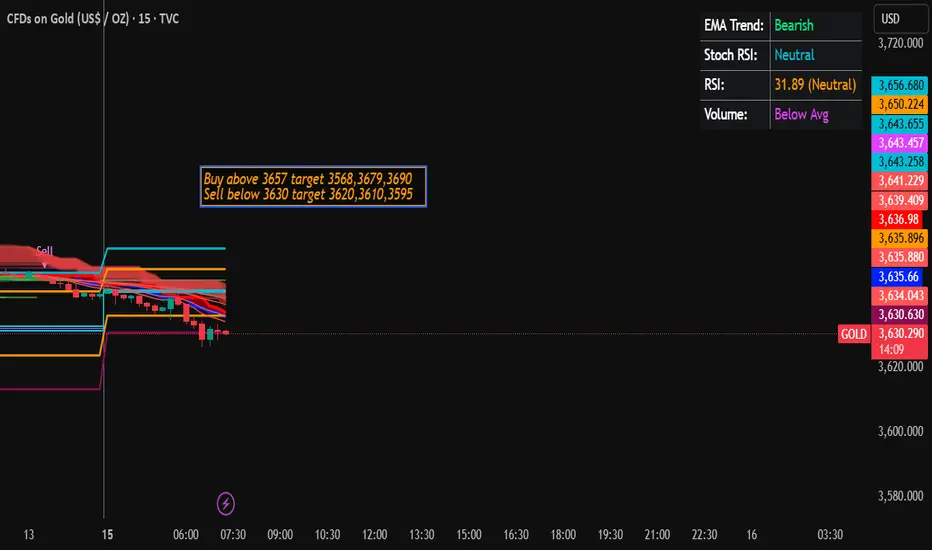
Gold Trading Strategy for 15th September 2025📊 Gold Trading Plan
🟢 Buy Setup (Long Trade)
✅ Condition: Enter a Buy trade if the 1-hour candle closes above 3657.
🎯 Targets:
First Target → 3668
Second Target → 3679
Third Target → 3690
🔒 Stop Loss: Always place a stop loss below the breakout candle’s low to manage risk.
🔴 Sell Setup (Short Trad
Gold oscillation adjustment pattern: 3320-3360Gold oscillation adjustment pattern: 3320-3360
Next, the focus of the gold market will mainly focus on the Fed's upcoming interest rate resolution, and its interest rate cut and guidance on future policies will become key catalysts for the gold price trend in the short term.
Fundamental analysis:

Gold Nears Peak: Fed Cuts & Tensions Fuel Indian Trades!Namaste, traders! Gold (XAU/USD) bounced from an early Asian dip at $3,626-$3,627 on Monday (15/09/2025), staying strong near record highs as weak US labor data locks in a 100% chance of a 0.25% Fed rate cut on 17/09, with two more expected in October and December (CME FedWatch). Geopolitical sparks

Gold Trading Strategy for Monday✅ Fundamental Analysis
🔹 Fed Rate Cut Expectations
The Federal Reserve is almost certain to cut rates by 25 basis points in September, which is the market consensus. The recent rally in gold has been primarily driven by “rate cut expectations” rather than purely safe-haven demand. As the rate decisi

See all futures ideas
Is EUR/USD Setting Up for a Massive Bullish Move?My EUR/USD analysis is a multi-timeframe forecast focusing on key institutional levels. The daily chart provides a long-term perspective, showing the pair in a consolidation phase after a significant downtrend. I've identified a very powerful sell zone from 2020 that represents a major historical re

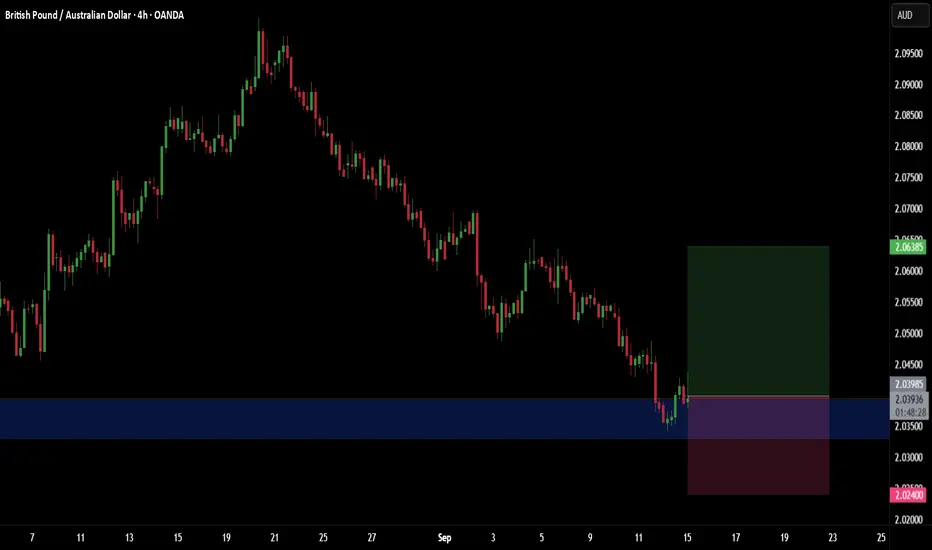
Buy Trade - GBP/AUDGreetings to everyone!
You can place a buy trade on GBP/AUD and check out my chart for the ideal entry, stop-loss & target placement.
Remember :-
* Move your SL to breakeven once the trade reaches 1:1 R.
* Aim for a minimum reward of 1:1.5 R.
* Don't risk more than 3% of your total margin.
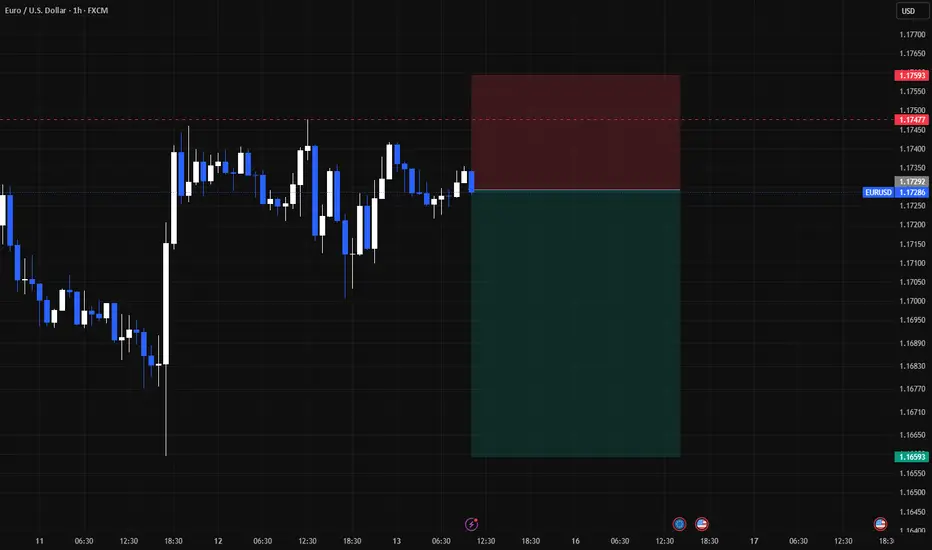
EURUSD - MONDAY RANGE Good morning, traders. It's Monday, and I'm looking for a buy on the EURO after it takes out the Asia low. I'm expecting a bounce up from that 15-minute FVG (Fair Value Gap).

GBPCHFPrice is in a downtrend. It came into 4H supply. Made 15min flip and now waiting for limit to get triggered.

GBPJPY sell positionprice seems to fail pushing higher and now facing resistance at this level. perhaps we shall see a down move from here

Inverse Cup and Handle for Bearish indicationAfter strong Bullish Engulfing formation on 5th September 2025, the OANDA:NZDCAD price is rocketing towards higher highs, aiming for 0.8624 resistance.
Now it needs some breath after forming a bearish Harami on 12th September 2025.
Looking at the Hourly timeframe, it made an inversed Cup and Hand

GBPUSD Ready for Expansion After Liquidity GrabThe market has been trading within a broad range, characterized by multiple liquidity grabs on both highs and lows. Each sweep has been followed by sharp reactions, confirming active smart money positioning. Recent price action shows a strong recovery after a downside liquidity sweep, indicating acc
AUDUSD(20250912)Today's AnalysisMarket News:
U.S. initial jobless claims surged to 263,000 in the week ending September 6, reaching a near four-year high. Traders are fully pricing in three Federal Reserve interest rate cuts by the end of 2025.
Technical Analysis:
Today's Buy/Sell Levels:
0.6636
Support and Resistance Levels:

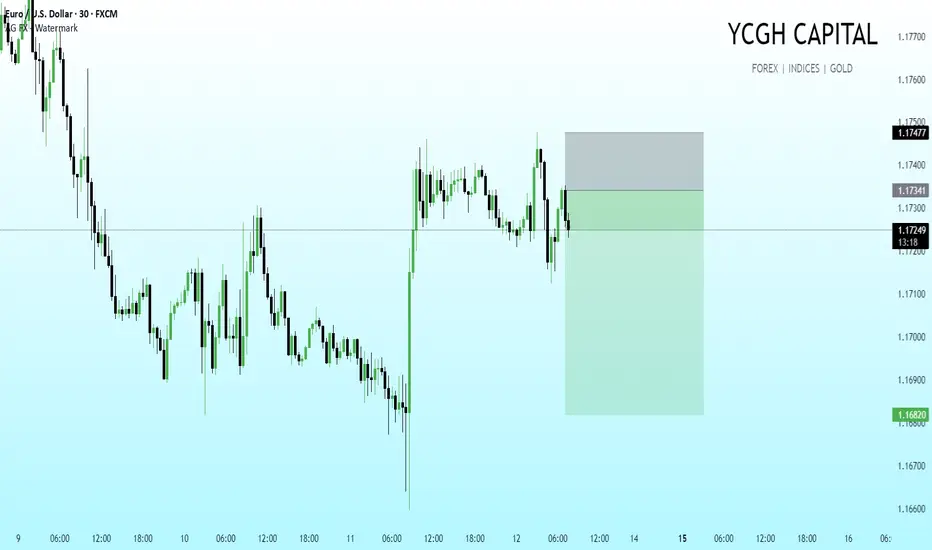
EUR/USD | 30M | Live Execution Zone
We’ve marked out our trade zone post-CPI. Price tapped into our supply pocket at 1.1747 and is now reacting as anticipated. Position structured with:
Entry at the rejection from supply
Stop above the sweep zone
Target the lower liquidity pool near 1.1680
Key narrative: Market took out liquidit
See all forex ideas
| - | - | - | - | - | - | - | - | ||
| - | - | - | - | - | - | - | - | ||
| - | - | - | - | - | - | - | - | ||
| - | - | - | - | - | - | - | - | ||
| - | - | - | - | - | - | - | - | ||
| - | - | - | - | - | - | - | - | ||
| - | - | - | - | - | - | - | - | ||
| - | - | - | - | - | - | - | - | ||
| - | - | - | - | - | - | - | - |
Trade directly on the supercharts through our supported, fully-verified and user-reviewed brokers.


