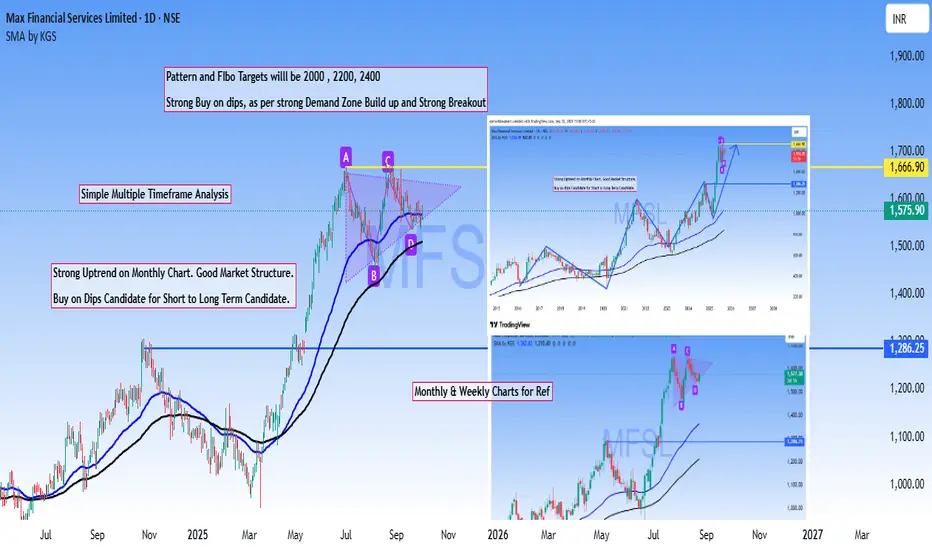
MFSL Multi time frame AnalysisMulti-timeframe confluence analysis offers traders a robust edge through straightforward yet highly effective methodology.
Based on that MFSL is a strong Buy on dips stock based on powerful breakout of previous ATH and the current market structure.
Targets are derived from #Pattern #breakout and #

The best trades require research, then commitment.
Get started for free$0 forever, no credit card needed

Scott "Kidd" PoteetThe unlikely astronaut

Where the world does markets
Join 100 million traders and investors taking the future into their own hands.
Major indices
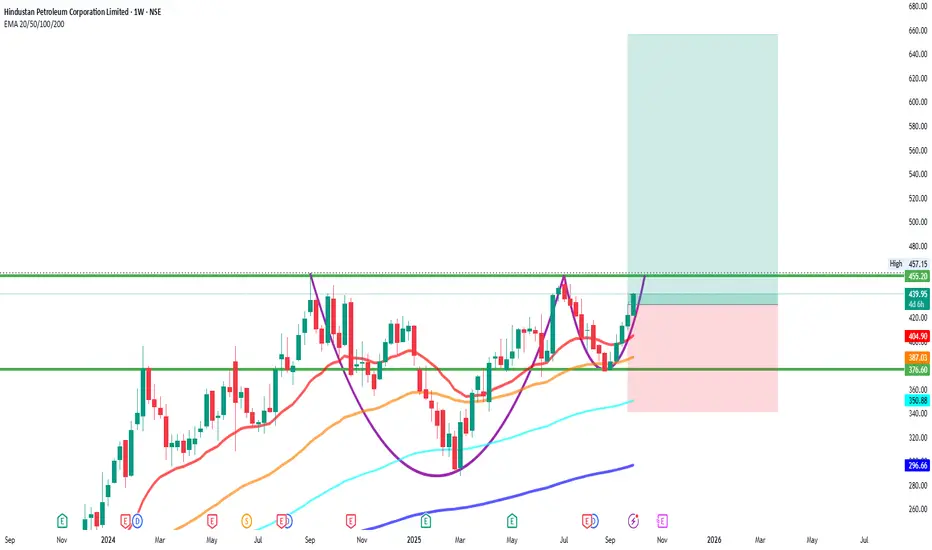
HINDPETROHINDPETRO
bullish trend is Showing on the chart.
buy signals in
technical indicators and
cup with handle chart pattern.
Watch for a breakout above 450/460 to sustain the bullish trend. If the resistance holds, there could be a retest towards 360/370 and an uptrend from here.
ICICI Bank: Resistance Turned Support Powers Next Rally🔍 Technical Analysis
ICICI Bank showcases another remarkable wealth creation story spanning over two decades. The stock has delivered an extraordinary super bullish rally, transforming from ₹40 to the current trading level of ₹1,351 - representing an impressive 33.8x growth over 20+ years.
The ₹1

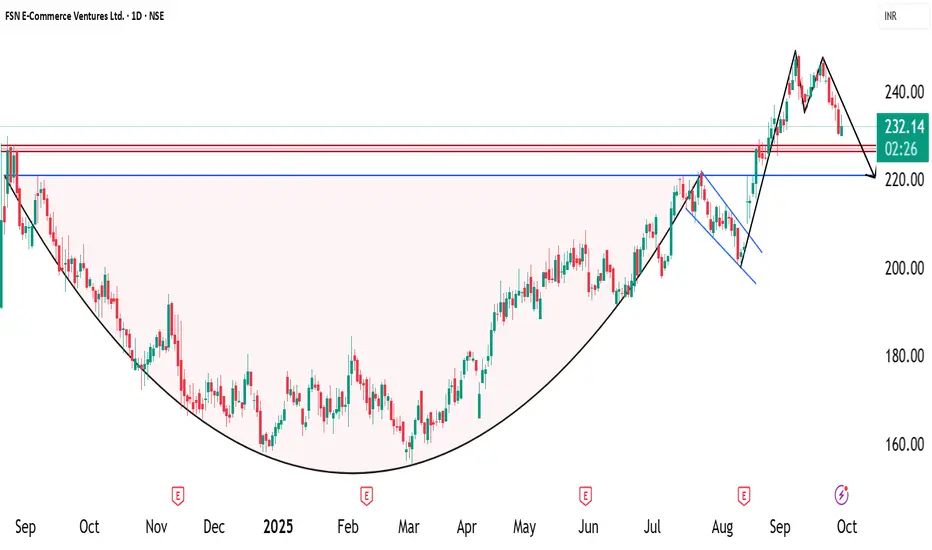
NYKAA - Cup with handle pattern📈 Pattern Analysis: Nykaa recently completed a "Cup-with-Handle Breakout" , which is a strong bullish continuation pattern. However, the breakout targets have not yet been achieved. In the past few sessions, the stock has witnessed selling pressure, forming a double-top bearish pattern on the cha
Daily analysis for Nifty50: 29/09/25Nifty is still not bullish. A trendline support test is quite possible. That comes at around 24535-24520 range of price. If that is breaching it will test lower levels of 24560, 24405 and 24360 as downside fall.
On bounce it will rise till 24630 to 24740 as resistance.

Lumax industries Look like after strong volume absorption done
Also auto part sector in trending.
Also sector given break out
Little bit late post , allready created entry just post for my trading history chart remember in future look what i have done mistake or Good point
Take 10%risk withtrade

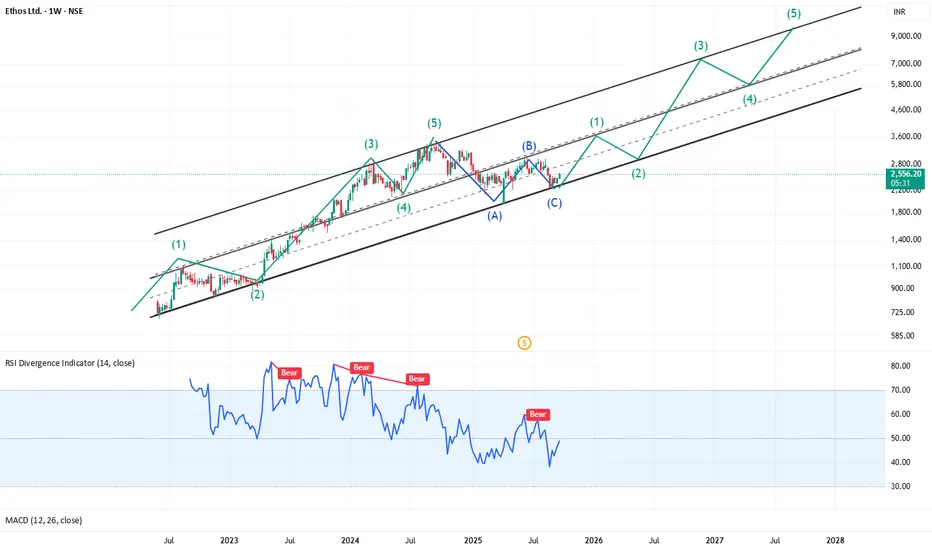
Fasten your wrist watches : CMP 2560Impulse and Corrective Structure
On the ETHOS weekly chart, the price action aligns closely with classic Elliott Wave theory. A complete 5-wave impulse pattern (labelled 1-2-3-4-5 in green) can be observed progressing within a rising parallel channel. Each impulse sequence is followed by a 3-wave c
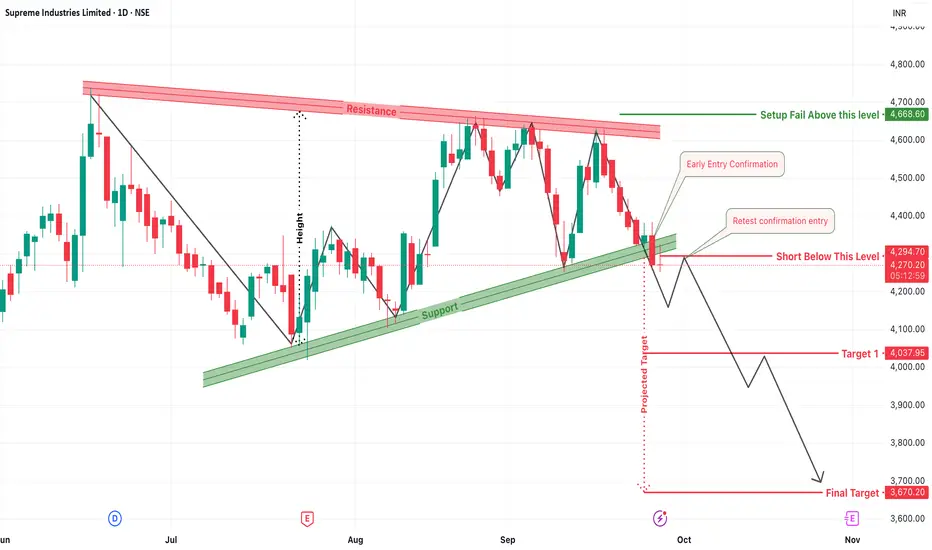
Supreme Industries: Breakdown Below Ascending SupportThe daily chart of Supreme Industries is showcasing a strong bearish signal with a breakdown below a long-held ascending trendline. The structure clearly resembles a descending triangle pattern, and the breakdown confirms growing weakness in price action, favoring sellers in the near term.
1. Bear
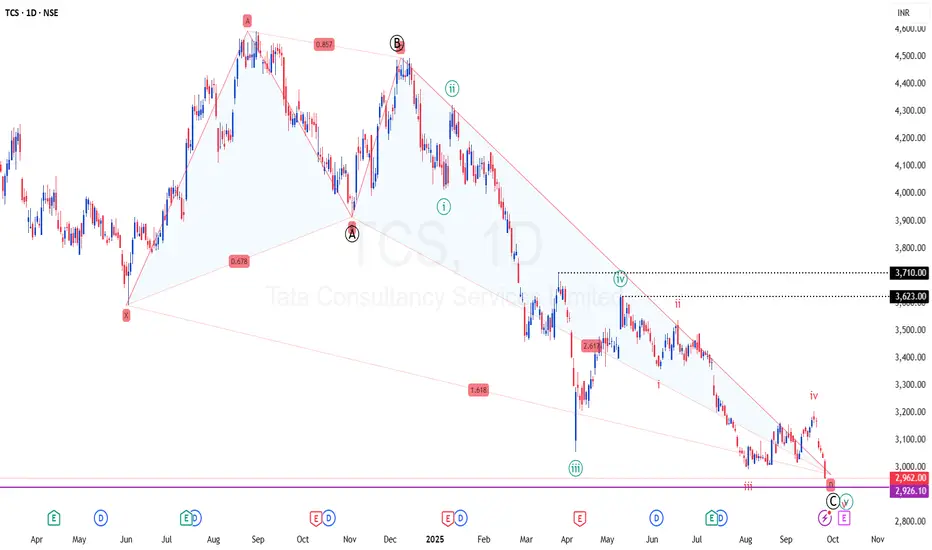
TCS - Time to go up towards 3500+ Bullish CRAB PRZ at play
TF: Daily
CMP: 2965
Here is my previous post on this script for a detailed review.
Price has completed the potential target as per the Bullish Crab pattern.
Results are due in the next couple of weeks.
I expect the stock to bounce from this zone 2900-2950 and potentially march towards 3500+ i
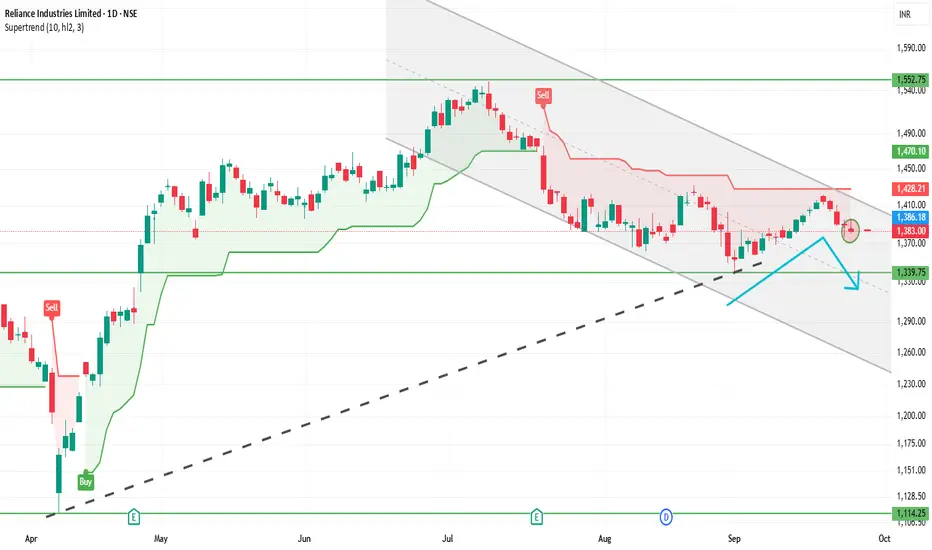
RELIANCE 1D Time frame📊 Reliance Daily (1D) Snapshot
Close: Around ₹1,382
Range of the Day: High near ₹1,396, Low near ₹1,380
Trend: Slight weakness on daily chart (mild red candle)
Stock is consolidating between support and resistance zones.
🎯 Key Daily Levels
Support Zone: ₹1,350 – ₹1,365
Strong Support: ₹1,330
See all editors' picks ideas
RiskMetrics█ OVERVIEW
This library is a tool for Pine programmers that provides functions for calculating risk-adjusted performance metrics on periodic price returns. The calculations used by this library's functions closely mirror those the Broker Emulator uses to calculate strategy performance metrics (

Simple Decesion Matrix Classification Algorithm [SS]Hello everyone,
It has been a while since I posted an indicator, so thought I would share this project I did for fun.
This indicator is an attempt to develop a pseudo Random Forest classification decision matrix model for Pinescript.
This is not a full, robust Random Forest model by any stretch o

Tick CVD [Kioseff Trading]Hello!
This script "Tick CVD" employs live tick data to calculate CVD and volume delta! No tick chart required.
Features
Live price ticks are recorded
CVD calculated using live ticks
Delta calculated using live ticks
Tick-based HMA, WMA, EMA, or SMA for CVD and price
Key tick levels (S

analytics_tablesLibrary "analytics_tables"
📝 Description
This library provides the implementation of several performance-related statistics and metrics, presented in the form of tables.
The metrics shown in the afforementioned tables where developed during the past years of my in-depth analalysis of various str

Adaptive Trend Classification: Moving Averages [InvestorUnknown]Adaptive Trend Classification: Moving Averages
Overview
The Adaptive Trend Classification (ATC) Moving Averages indicator is a robust and adaptable investing tool designed to provide dynamic signals based on various types of moving averages and their lengths. This indicator incorporates multipl

Statistics • Chi Square • P-value • SignificanceThe Statistics • Chi Square • P-value • Significance publication aims to provide a tool for combining different conditions and checking whether the outcome is significant using the Chi-Square Test and P-value.
🔶 USAGE
The basic principle is to compare two or more groups and check the results

FiniteStateMachine🟩 OVERVIEW
A flexible framework for creating, testing and implementing a Finite State Machine (FSM) in your script. FSMs use rules to control how states change in response to events.
This is the first Finite State Machine library on TradingView and it's quite a different way to think about your

Trading Activity Index (Zeiierman)█ Overview
Trading Activity Index (Zeiierman) is a volume-based market activity meter that transforms dollar-volume into a smooth, normalized “activity index.”
It highlights when market participation is unusually low or high with a dynamic color gradient:
Light Blue → Low Activity (thin p

Expected Value Monte CarloI created this indicator after noticing that there was no Expected Value indicator here on TradingView.
The EVMC provides statistical Expected Value to what might happen in the future regarding the asset you are analyzing.
It uses 2 quantitative methods:
Historical Backtest to ground your anal

Bar Index & TimeLibrary to convert a bar index to a timestamp and vice versa.
Utilizes runtime memory to store the 𝚝𝚒𝚖𝚎 and 𝚝𝚒𝚖𝚎_𝚌𝚕𝚘𝚜𝚎 values of every bar on the chart (and optional future bars), with the ability of storing additional custom values for every chart bar.
█ PREFACE
This library aims to tackle s

See all indicators and strategies
Community trends
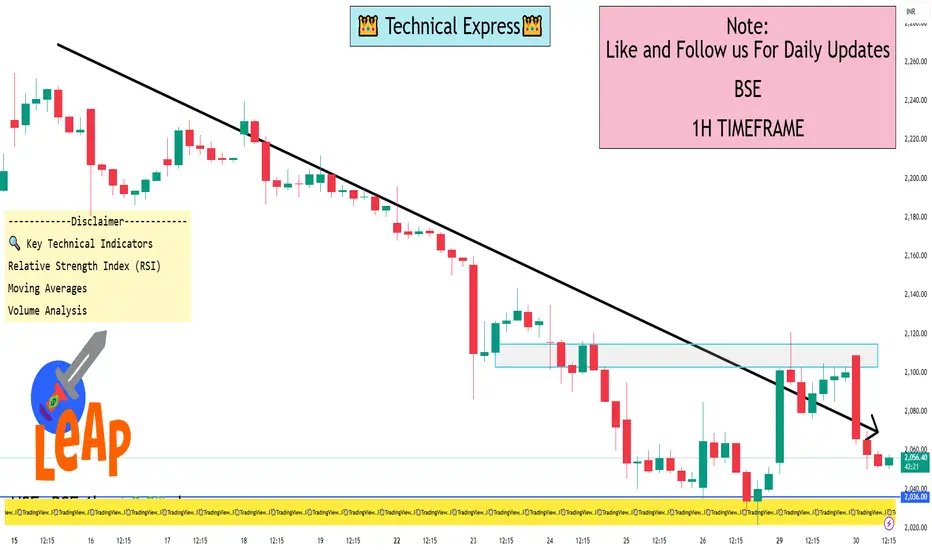
BSE 1 Hour ViewBSE is trading at ₹2,054.60, reflecting a 2.04% decline for the day.
📊 1-Hour Time Frame Technical Analysis
On the 1-hour chart, BSE Ltd. is exhibiting a "Strong Sell" signal across both technical indicators and moving averages. This suggests a prevailing short-term downtrend, with the stock trad
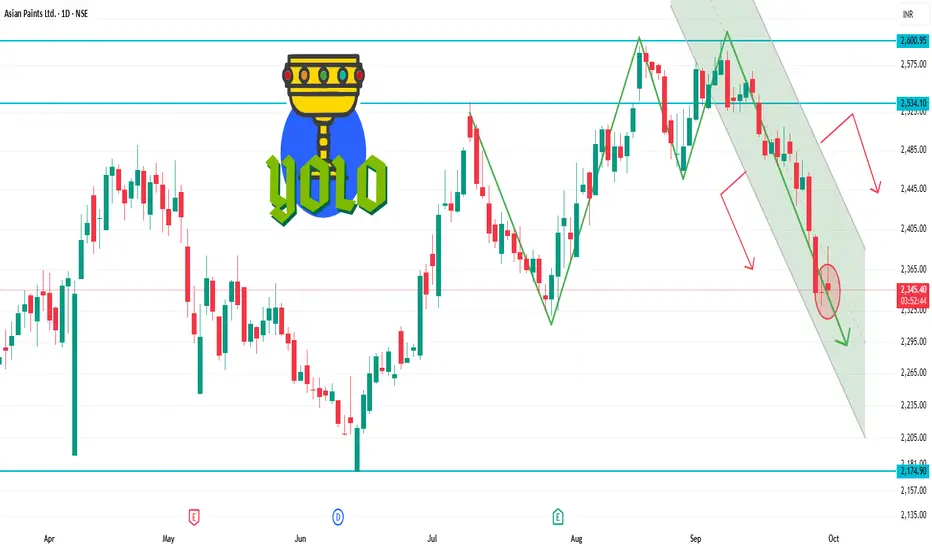
ASIANPAINT 1D Time frameCurrent Price Snapshot
Current Price: ₹2,345.50
Day’s Range: ₹2,342.00 – ₹2,388.80
52-Week Range: ₹2,124.75 – ₹3,358.00
Technical Indicators
RSI (14-day): 44.19 — indicates a neutral to slightly bearish momentum.
MACD: -4.010 — suggests bearish momentum.
Moving Averages:
5-day: ₹2,396.00 — i
MFSL Multi time frame AnalysisMulti-timeframe confluence analysis offers traders a robust edge through straightforward yet highly effective methodology.
Based on that MFSL is a strong Buy on dips stock based on powerful breakout of previous ATH and the current market structure.
Targets are derived from #Pattern #breakout and #
ICICI Bank: Resistance Turned Support Powers Next Rally🔍 Technical Analysis
ICICI Bank showcases another remarkable wealth creation story spanning over two decades. The stock has delivered an extraordinary super bullish rally, transforming from ₹40 to the current trading level of ₹1,351 - representing an impressive 33.8x growth over 20+ years.
The ₹1
HINDPETROHINDPETRO
bullish trend is Showing on the chart.
buy signals in
technical indicators and
cup with handle chart pattern.
Watch for a breakout above 450/460 to sustain the bullish trend. If the resistance holds, there could be a retest towards 360/370 and an uptrend from here.
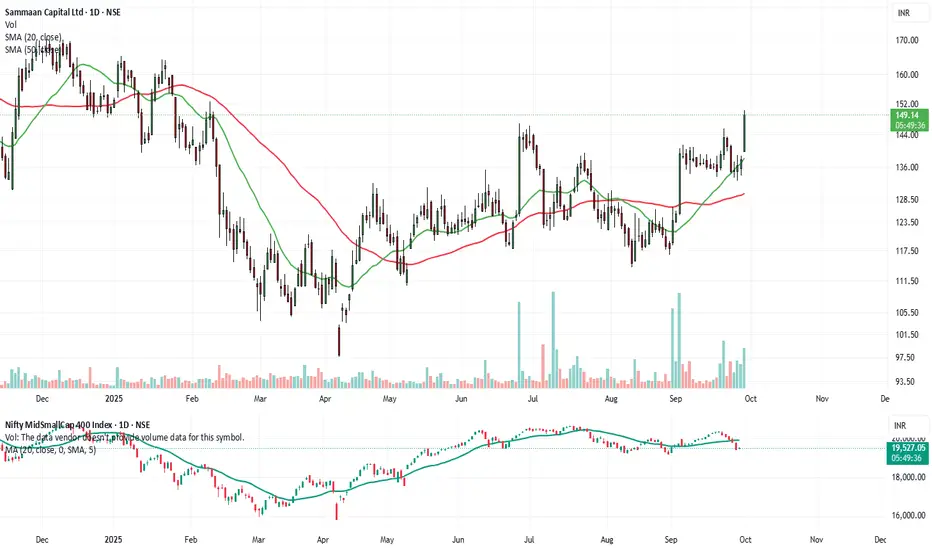
Swing Trade Journey- Trade 1: SamaancapEntered #Samaancap at ₹145
Stop Loss: ₹137–138
Position sizing as per plan. Now letting the setup play out.
Documenting every trade — wins, losses & lessons.
#TradingJourney #StockMarketIndia #SwingTrading
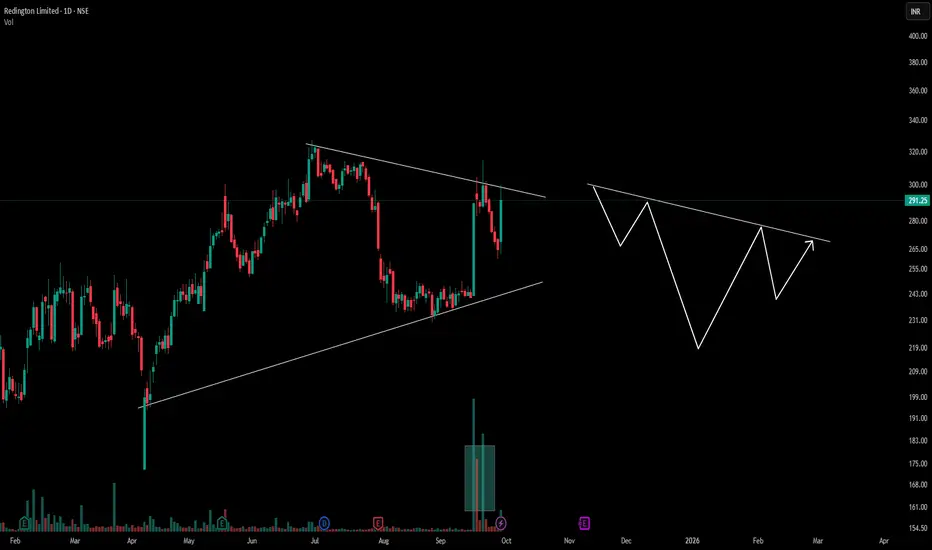
Extended Inverted Head & Shoulders Structure in Price ActionThis chart features an extended inverted head and shoulders pattern, illustrating how these classic formations can significantly vary in length and shape across timeframes. The left and right shoulders frame a deeper head, while the neckline is not strictly horizontal but angled, reflecting real mar
NYKAA - Cup with handle pattern📈 Pattern Analysis: Nykaa recently completed a "Cup-with-Handle Breakout" , which is a strong bullish continuation pattern. However, the breakout targets have not yet been achieved. In the past few sessions, the stock has witnessed selling pressure, forming a double-top bearish pattern on the cha
Volatility Compression Zone - NATIONALUM- 💹 Entry PriceC₹206 on Sep 25, 2025
- 📆 Planned Exit: Before October 9, 2025
- 🧠 Exit Logic: Time-based lifecycle, not price-based
- 📊 Scoring System: Trade met internal threshold across filters
- Volatility compression zone
- Multi-timeframe support alignment
- 📘 Journaling Note: Trade logged with

INDIAN HOTELS🎯 TRADING PLAN 🎯
✔ Price Action shows strong support
At the trend line with a Bullish Harami
Candlestick Pattern.
✔ RSI being Oversold adds weight to the
Setup.

See all stocks ideas
Oct 8
PLASTIBLENPlastiblends India Limited
Actual
—
Estimate
—
Oct 8
JTLINDJTL Industries Limited
Actual
—
Estimate
—
Oct 8
AVANTELAvantel Limited
Actual
—
Estimate
—
Oct 9
HCLTECHHCL Technologies Limited
Actual
—
Estimate
15.46
INR
Oct 9
IREDAIndian Renewable Energy Development Agency Ltd.
Actual
—
Estimate
—
Oct 9
TCSTata Consultancy Services Limited
Actual
—
Estimate
34.56
INR
Oct 9
GMBREWG.M. Breweries Ltd.
Actual
—
Estimate
—
Oct 13
GTPLGTPL Hathway Ltd
Actual
—
Estimate
—
See more events
Community trends
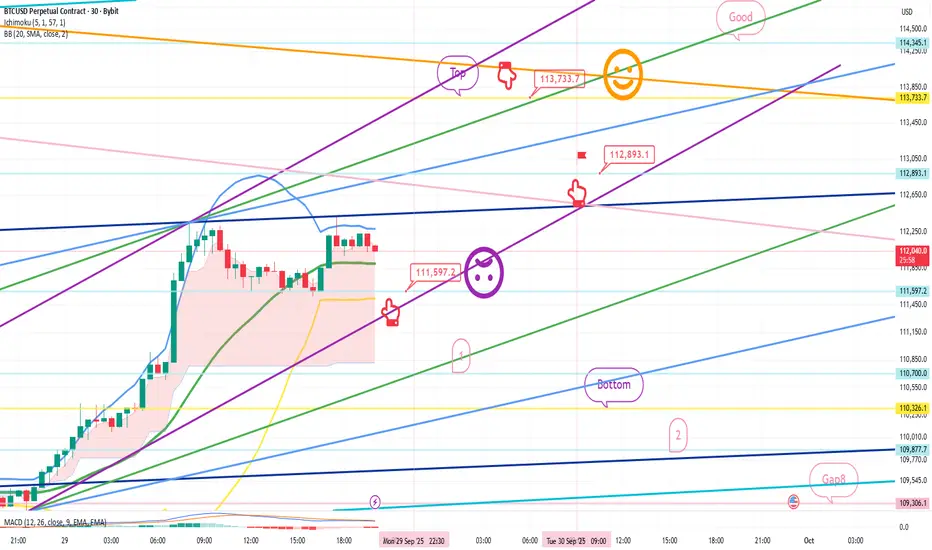
Bitcoin – Let’s Play the Resistance Game at 114,500Bitcoin on the 1-hour chart has entered a critical resistance zone around 114,200–114,500. Price has rallied strongly from the recent lows near 113,000, but now faces a major supply area. The structure suggests that BTC could face rejection here and move back toward the support zone near 112,600 if

Bitcoin (BTCUSDT) – Bearish Setup Under ResistanceAfter the recent breakdown from 116,700 levels, BTC has been forming lower highs and consolidating in a range. The recovery towards 113,900 – 114,300 acted as a supply zone, leading to fresh selling pressure.
Currently, BTC is facing resistance near 111,100–112,000, marked in red on the chart. Pric

Bitcoin Under Pressure: Bearish Momentum BuildsBitcoin recently transitioned from a corrective decline into a consolidation phase, where price activity showed reduced volatility and market indecision. The breakout from this range has introduced renewed momentum, highlighted by strong bullish candles and a clear shift in trend dynamics. This move

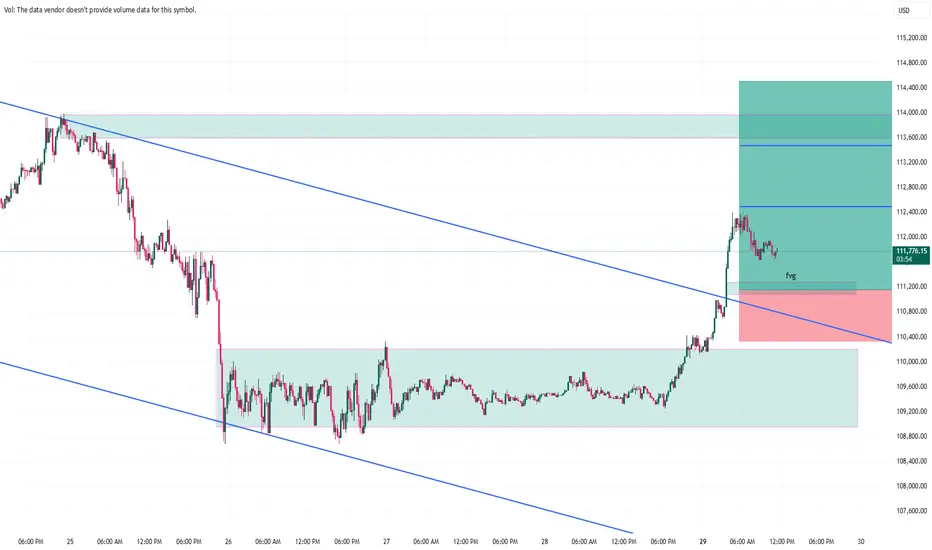
BTC/USD: Uptrend StrengthenedBitcoin is showing strong signs of recovery after bouncing from the support zone around 111,700 USD. Intense buying pressure has pushed the price above key EMA levels, opening the door for a move toward the next major resistance at 115,000 USD.
On the news side, on 27/09/2025, the market recorded a

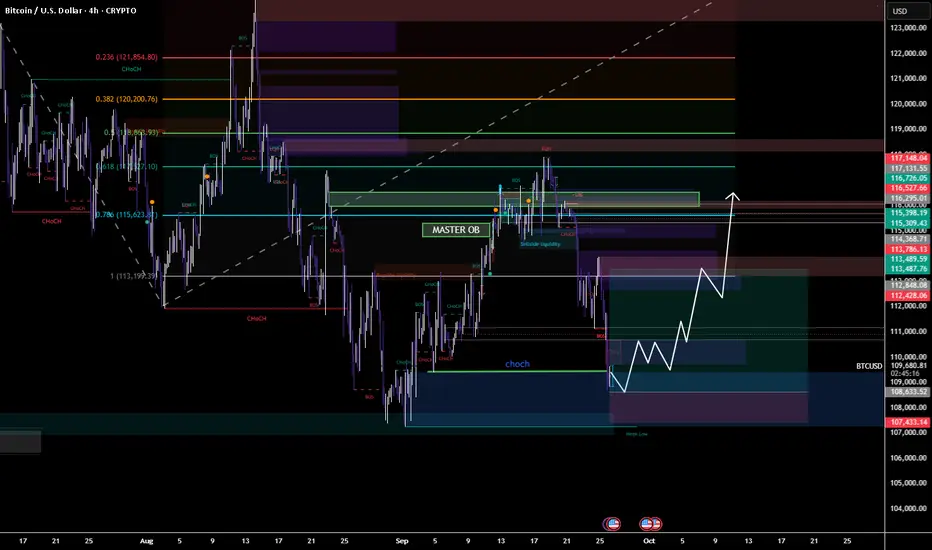
BTC Bulls Eyeing a Reversal From Liquidity SweepBTC Bulls Eyeing a Reversal from Liquidity Sweep”
📌 Description:
Bitcoin swept downside liquidity near 108k, tapping into a demand zone. If this level holds, expect a strong recovery toward the 113.5k–116.5k supply zones, with the Master OB acting as a key magnet for price.
📈 Trade Plan (4H BTCUS
Ethereum: Bullish or Bearish? The Path AheadEthereum is at a critical juncture on its 4-hour chart. The price recently touched $4,180 and has started pulling back. The Fair Value Gaps (FVGs) in the $4,000–$4,100 zone suggest the market might revisit this area for a quick rebalancing before confirming the next move. In the short term, this is

September 29 Bitcoin Bybit chart analysisHello
It's a Bitcoin Guide.
If you "follow"
You can receive real-time movement paths and comment notifications on major sections.
If my analysis was helpful,
Please click the booster button at the bottom.
This is a Bitcoin 30-minute chart.
There are no Nasdaq indicators released today.
I deve
[SeoVereign] BITCOIN BEARISH Outlook – September 30, 2025Today, as of September 30, I am writing to share my bearish perspective on Bitcoin with a short position.
In this idea as well, I am leaning toward a decline. There are two main reasons for this.
First, the 1.13 ALT BAT pattern. This harmonic pattern has already been confirmed, but since the det

Title: BTCUSD – Breakout from Falling Channel | Long SetupDescription:
Bitcoin has broken out of the falling channel with strong bullish momentum.
✅ Clean breakout from the downtrend structure
✅ Retest of the breakout level showing support
✅ Long position aligned with bullish continuation
Bias: Bullish as long as price holds above the channel breakou

See all crypto ideas
silver soon topssilver could top soon , it had made the top and fallen , so could the history repeat ? we could see gold and silver prices falling soon because nothing could go so up forever

Market just swept stoploss – time for the next 1000 pips BUY📊 Trading Plan for Today
Main Trend: Gold has broken structure (BOS) and built strong bullish momentum. The recent sharp drop was a stoploss sweep – a liquidity grab before the next leg up.
Buy Zone:
CP Order Buy Zone: 3786 – 3784
Stop Loss: 3779
Targets (TP):
Short-term: 3820 – 3840 (Fib 1.0

H1 bullish momentum intact | Buy 3,792–3,765, target 3,821🟡 XAU/USD – 29/09/2025 | Captain Vincent ⚓
🔎 Captain’s Log – Structure & Trend
H1 continues to print consecutive BoS → bullish trend sustained.
Price broke the long-term downtrend line and surged to new highs.
EMA 34 & EMA 89 both pointing up and below price → confirming short-to-mid-term bu

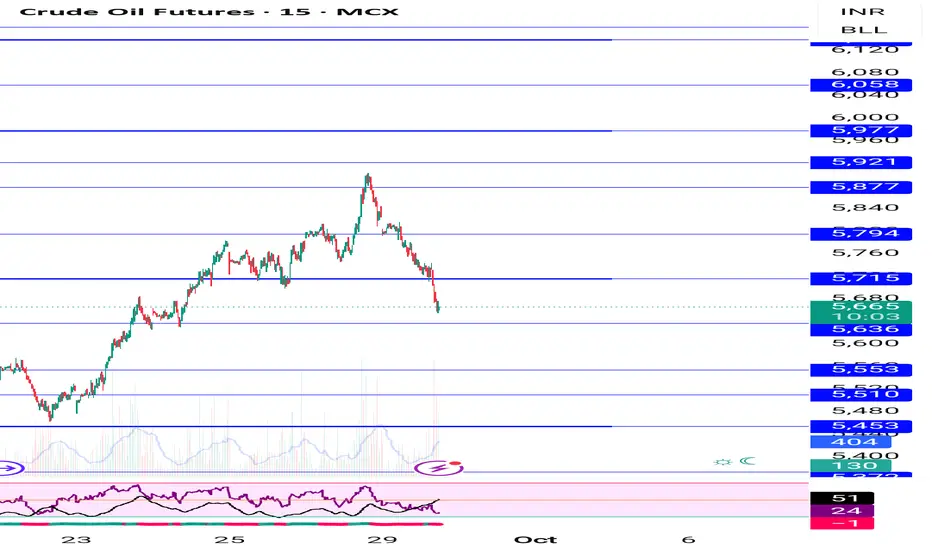
Crude sell Trade given at 5780 5630-5560 next target Crude sell given at 5780 holding sell trade, downside target 5630,5560
How My Harmonic pattern projection Indicator work is explained below :
Recent High or Low :
D-0% is our recent low or high
Profit booking zone ( Early / Risky entry) : D 12.3% -D 16.1 % is
range if break them profit bo
Double Top in SilverEntry- 143000-143200
Target- 142000, 141500, 141200
SL- Day high
Pattern - Double Top has been made in MCX silver and Comex silver in 1 hr and 15 min time frame.
Disclaimer- This is just for educational purpose.
Jai Shree Ram.

Gold Trading Strategy for 29th September 2025📊 Gold Trading Plan
✨ Buy Setup
🔹 Entry: Buy above the high of the 15-min candle (close above $3773)
🎯 Targets:
1st Target → $3783
2nd Target → $3793
3rd Target → $3805
✨ Sell Setup
🔹 Entry: Sell below the low of the 1-hour candle (close below $3758)
🎯 Targets:
1st Target → $3747
2nd Target → $
Gold Strength Persists: Trendline Support Key Into EOQ ClosingGold continues to show impressive strength, holding its bullish momentum without any major signs of rejection from higher levels. Price action is moving with a steady pace, consistently finding support on the rising trendline, which remains a key technical guide for intraday moves. The immediate hor
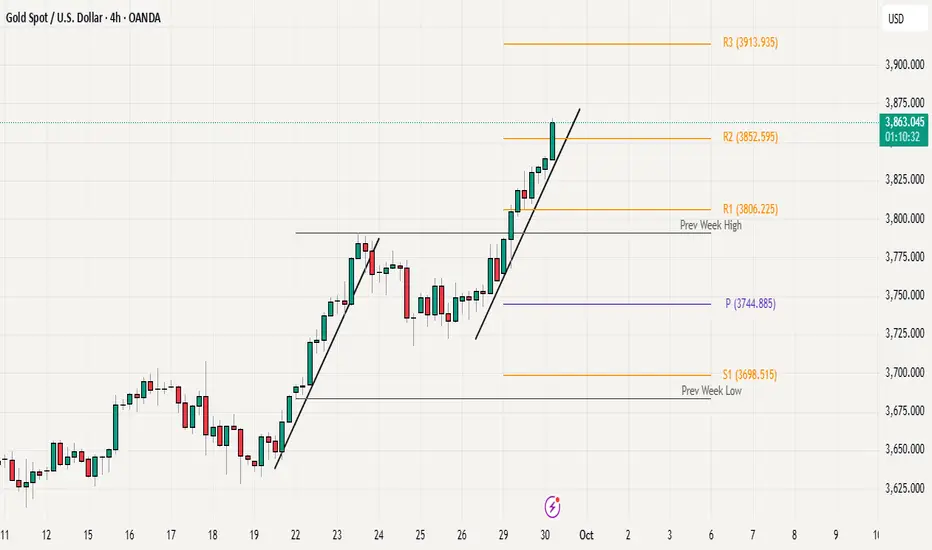
XAUUSD: Gold Range – Trade Opportunities at Support & ResistanceCurrently, gold is moving within a rising channel but shows a sideways trend with no clear momentum to push higher. The chart indicates important support levels at 3,796 and resistance at 3,876.
The EMA indicators remain below the price, providing solid support for gold. However, the lack of decisi

Gold Market Analysis & Trading Plan
📌 Macro Background
Gold prices continue to receive support from the decline in US interest rates and the weakening of the USD.
The DXY index decreased by 0.27% to 97.91, reducing the strength of the greenback.
The 10-year US Treasury yield fell by 3 basis points to 4.141%.
Real yield decreased

Gold Price Analysis: Liquidity Redistribution in PlayThe current correction phase is unfolding as part of the broader cycle, where price is retracing into areas of liquidity to rebalance market flow. This is not necessarily weakness, but a redistribution process that allows the market to set up for its next decisive move.
Following the recent rally,

See all futures ideas
Buy Trade - USD/JPYGreetings to everyone!
You can place a buy trade on USD/JPY and check out my chart for the ideal entry, stop-loss & target placement.
Remember :-
* Move your SL to breakeven once the trade reaches 1:1 R.
* Aim for a minimum reward of 1:1.5 R.
* Don't risk more than 3% of your total margin.

EUR/USD is entering a decisive SMC zone – Big move loading...📊 EUR/USD H4 – SMC Mapping & Trading Plan
1. Market Structure
Main trend: bearish (after clear CHoCH and BOS).
Price has formed Equal Highs (EQH) → strong liquidity above.
Untested liquidity zone below (OBB) → expectation for price to sweep down.
2. Key Zones
Supply Zone (OBS + FVG):
1.18100 –

EURUSD, NFP WEEKEU in a weekly looks good for sells
in Dialy tf we have a clean sell FVG at the place we have one 4H candle indicating that it need to go down in until the one 4H candle close in downwards direction
In entry time frame which is 15M have a clean engulfing candle at the sell FVG of 15M

GBPJPY: Risk of Trend Break, Sharp Drop Ahead!GBPJPY is showing signs of weakening after repeatedly moving around the 200.00 level. Fundamentally, the British Pound remains under pressure from weak economic data and expectations that the BoE may soon cut interest rates . Meanwhile, the Japanese Yen is benefiting from safe-haven demand

EURUSD SELL VIEW 4h BREAK and RETEST also with two trendline combining all of them and SELL side view for even more clarification

#EURUSD - PLANLooking for a short on EURO after sweeping the Daily TF FVG possible reversal during NY Open

AUDCAD besrish ( Sell )📌 Trade Plan (AUDCAD)
Sell Limit (Entry Zone):
0.91514
0.91493
Stop Loss (SL): Just above the marked “Caution” zone (around 0.91680–0.91700 area).
Take Profit (TP):
TP Liquidity: 0.90767
---
📌 Why Sell?
Price retesting supply zone (Caution area).
Wyckoff distribution + UTAD test conflu

AUDJPY MULTI TIME FRAME ANALYSISHello traders , here is the full multi time frame analysis for this pair, let me know in the comment section below if you have any questions , the entry will be taken only if all rules of the strategies will be satisfied. wait for more price action to develop before taking any position. I suggest yo

AUDUSD Buy Setup - Breakout & RetestAUDUSD is showing strength after bouncing from a daily order block and aligning perfectly with the 0.79 Fibonacci discount zone. The higher timeframe context is setting the stage for a clean upside move, but we need confirmations before execution.
🔑 Key Levels to Watch
Entry Trigger: A 4H candle clo

Don't sell right nowWait for prize to come bellow that Black box then close there on daily candle stick then sell

See all forex ideas
| - | - | - | - | - | - | - | - | ||
| - | - | - | - | - | - | - | - | ||
| - | - | - | - | - | - | - | - | ||
| - | - | - | - | - | - | - | - | ||
| - | - | - | - | - | - | - | - | ||
| - | - | - | - | - | - | - | - | ||
| - | - | - | - | - | - | - | - | ||
| - | - | - | - | - | - | - | - | ||
| - | - | - | - | - | - | - | - |
Trade directly on the supercharts through our supported, fully-verified and user-reviewed brokers.


