spot gold or mcx gold update as per chartgold spot looks stair pattern or now news in focus usa shut down--
technical lvl- spot gold abv 3883 looks again up side 3900-3920--3945$ where support 3860$ which break blow with volume than more down fall 33852--42--34$ expect.
mcx gold sustain abv 118300 looks 119k near where support 117700 whi

The best trades require research, then commitment.
Get started for free$0 forever, no credit card needed

Scott "Kidd" PoteetThe unlikely astronaut

Where the world does markets
Join 100 million traders and investors taking the future into their own hands.
Major indices

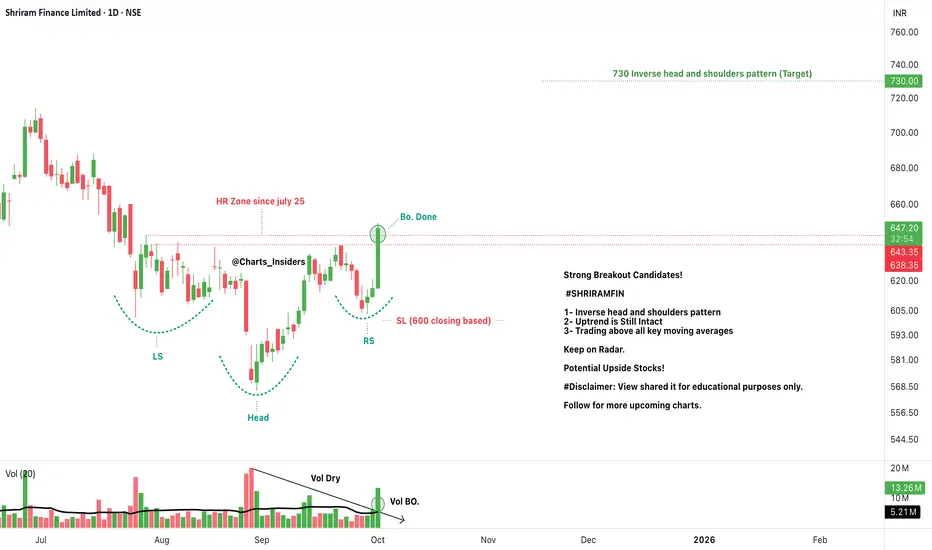
SHRIRAMFINStrong Breakout Candidates!
#SHRIRAMFIN
1- Inverse head and shoulders pattern
2- Uptrend is Still Intact
3- Trading above all key moving averages
Keep on Radar.
Potential Upside Stocks!
#Disclaimer: View shared it for educational purposes only.
Follow for more upcoming charts.
LIC – High Probability Breakout Setup!After a long consolidation, LIC is now approaching a falling trendline breakout with strong bullish momentum.
This is a high probability breakout setup supported by price action and structure.
📌 Plan:
✅ Entry: 900–910
❌ Stoploss: 844
🎯 Targets: 970–985 / 1068 / 1172
Highlights:
Multiple rejections

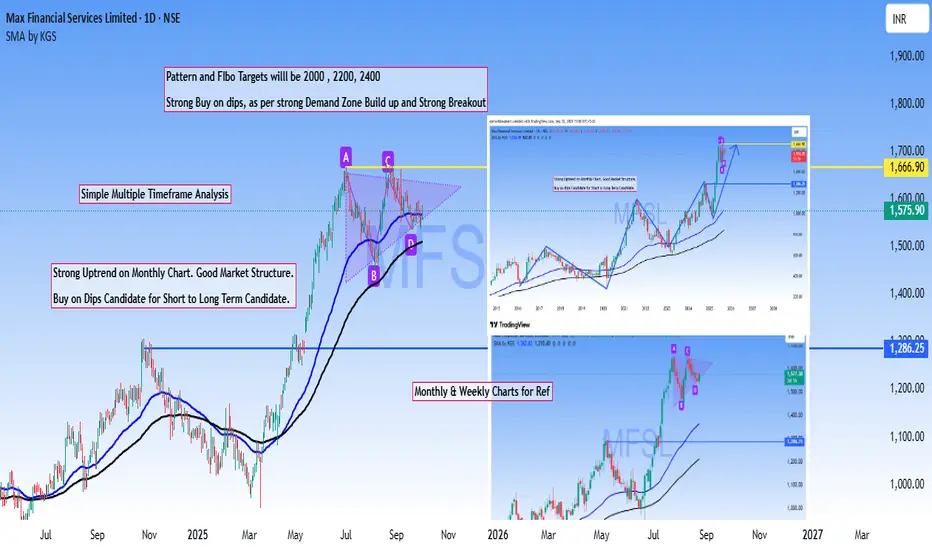
MFSL Multi time frame AnalysisMulti-timeframe confluence analysis offers traders a robust edge through straightforward yet highly effective methodology.
Based on that MFSL is a strong Buy on dips stock based on powerful breakout of previous ATH and the current market structure.
Targets are derived from #Pattern #breakout and #
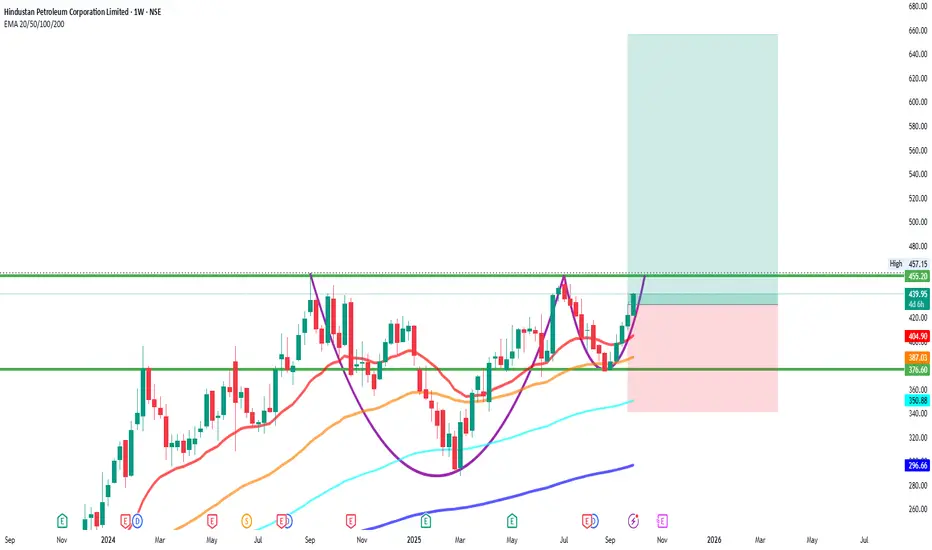
HINDPETROHINDPETRO
bullish trend is Showing on the chart.
buy signals in
technical indicators and
cup with handle chart pattern.
Watch for a breakout above 450/460 to sustain the bullish trend. If the resistance holds, there could be a retest towards 360/370 and an uptrend from here.
ICICI Bank: Resistance Turned Support Powers Next Rally🔍 Technical Analysis
ICICI Bank showcases another remarkable wealth creation story spanning over two decades. The stock has delivered an extraordinary super bullish rally, transforming from ₹40 to the current trading level of ₹1,351 - representing an impressive 33.8x growth over 20+ years.
The ₹1

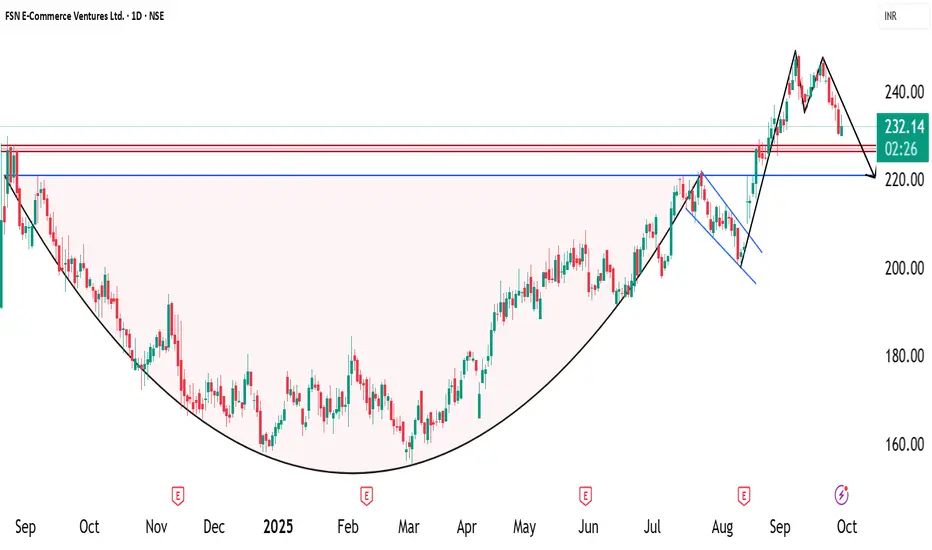
NYKAA - Cup with handle pattern📈 Pattern Analysis: Nykaa recently completed a "Cup-with-Handle Breakout" , which is a strong bullish continuation pattern. However, the breakout targets have not yet been achieved. In the past few sessions, the stock has witnessed selling pressure, forming a double-top bearish pattern on the cha
Daily analysis for Nifty50: 29/09/25Nifty is still not bullish. A trendline support test is quite possible. That comes at around 24535-24520 range of price. If that is breaching it will test lower levels of 24560, 24405 and 24360 as downside fall.
On bounce it will rise till 24630 to 24740 as resistance.

Lumax industries Look like after strong volume absorption done
Also auto part sector in trending.
Also sector given break out
Little bit late post , allready created entry just post for my trading history chart remember in future look what i have done mistake or Good point
Take 10%risk withtrade

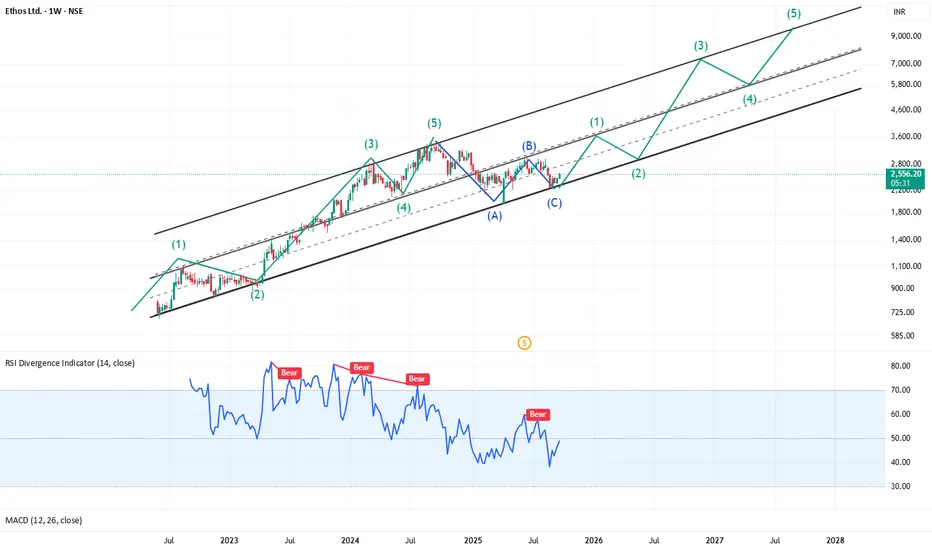
Fasten your wrist watches : CMP 2560Impulse and Corrective Structure
On the ETHOS weekly chart, the price action aligns closely with classic Elliott Wave theory. A complete 5-wave impulse pattern (labelled 1-2-3-4-5 in green) can be observed progressing within a rising parallel channel. Each impulse sequence is followed by a 3-wave c
See all editors' picks ideas
PongExperience PONG! The classic arcade game, now on your charts!
With this indicator, you can finally achieve your lifelong dream of beating the Markets. . . at PONG!
Pong is jam-packed with features! Such as:
2 Paddles
A moving dot
Floating numbers
The idea of a net
This indicator is solel

Options Max Pain Calculator [BackQuant]Options Max Pain Calculator
A visualization tool that models option expiry dynamics by calculating "max pain" levels, displaying synthetic open interest curves, gamma exposure profiles, and pin-risk zones to help identify where market makers have the least payout exposure.
What is Max Pain?
Max

Volume Profile 3D (Zeiierman)█ Overview
Volume Profile 3D (Zeiierman) is a next-generation volume profile that renders market participation as a 3D-style profile directly on your chart. Instead of flat histograms, you get a depth-aware profile with parallax, gradient transparency, and bull/bear separation, so you can see w

RiskMetrics█ OVERVIEW
This library is a tool for Pine programmers that provides functions for calculating risk-adjusted performance metrics on periodic price returns. The calculations used by this library's functions closely mirror those the Broker Emulator uses to calculate strategy performance metrics (

Simple Decesion Matrix Classification Algorithm [SS]Hello everyone,
It has been a while since I posted an indicator, so thought I would share this project I did for fun.
This indicator is an attempt to develop a pseudo Random Forest classification decision matrix model for Pinescript.
This is not a full, robust Random Forest model by any stretch o

Tick CVD [Kioseff Trading]Hello!
This script "Tick CVD" employs live tick data to calculate CVD and volume delta! No tick chart required.
Features
Live price ticks are recorded
CVD calculated using live ticks
Delta calculated using live ticks
Tick-based HMA, WMA, EMA, or SMA for CVD and price
Key tick levels (S

analytics_tablesLibrary "analytics_tables"
📝 Description
This library provides the implementation of several performance-related statistics and metrics, presented in the form of tables.
The metrics shown in the afforementioned tables where developed during the past years of my in-depth analalysis of various str

Adaptive Trend Classification: Moving Averages [InvestorUnknown]Adaptive Trend Classification: Moving Averages
Overview
The Adaptive Trend Classification (ATC) Moving Averages indicator is a robust and adaptable investing tool designed to provide dynamic signals based on various types of moving averages and their lengths. This indicator incorporates multipl

Statistics • Chi Square • P-value • SignificanceThe Statistics • Chi Square • P-value • Significance publication aims to provide a tool for combining different conditions and checking whether the outcome is significant using the Chi-Square Test and P-value.
🔶 USAGE
The basic principle is to compare two or more groups and check the results

FiniteStateMachine🟩 OVERVIEW
A flexible framework for creating, testing and implementing a Finite State Machine (FSM) in your script. FSMs use rules to control how states change in response to events.
This is the first Finite State Machine library on TradingView and it's quite a different way to think about your

See all indicators and strategies
Community trends
Flag & Pole pattern at torrent pharmaFlag & pole pattern in torrent pharma stock in daily & weekly timeline.

SHRIRAMFINStrong Breakout Candidates!
#SHRIRAMFIN
1- Inverse head and shoulders pattern
2- Uptrend is Still Intact
3- Trading above all key moving averages
Keep on Radar.
Potential Upside Stocks!
#Disclaimer: View shared it for educational purposes only.
Follow for more upcoming charts.
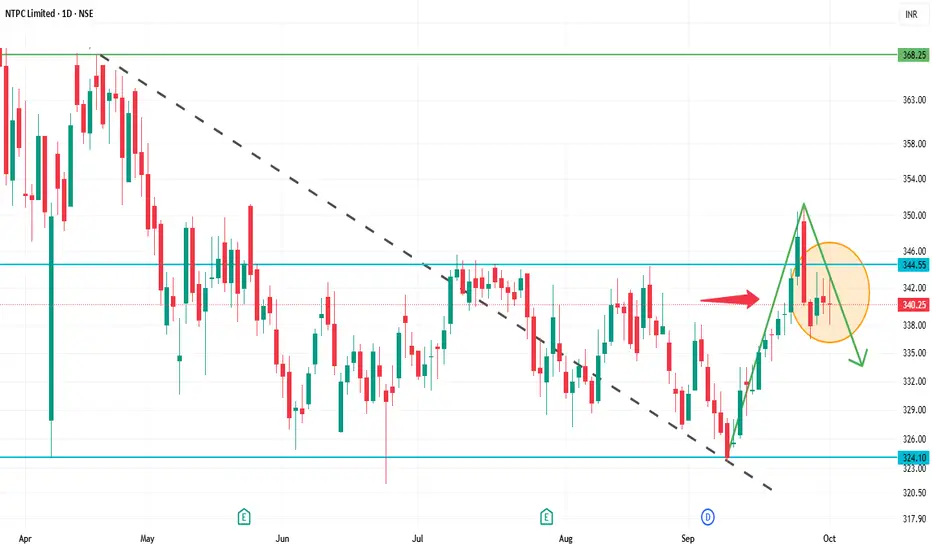
NTPC 1D Time frameCurrent Snapshot
Current Price: ₹340.25
52-Week High: ₹447.75
52-Week Low: ₹292.80
Strategy & Outlook
Bearish Bias: The stock is in a short-term downtrend with negative momentum indicators.
Selling Opportunity: Consider selling near resistance zones (₹343–₹345) with a target towards ₹335–₹340.
Tata Power - AI themeWith more and more AI coming up and data centers as a theme picking up..one of the most under thought of parts of that theme is the power these GPU's will be consuming..
The demand for power esp in the US has shot up after being stagnant for ages..
The same will happen here and Tata Power is one o

Crompton Greaves Consumer ElectricalsDate 02.10.2025
Crompton Greaves
Timeframe : Weekly Chart
About
(1) One of the leading consumer companies in India with 75+ years old brand legacy
(2) It is an independent company under professional management
(3) And have 2 business segments – Lighting and Electrical Consumer Durables
Reven

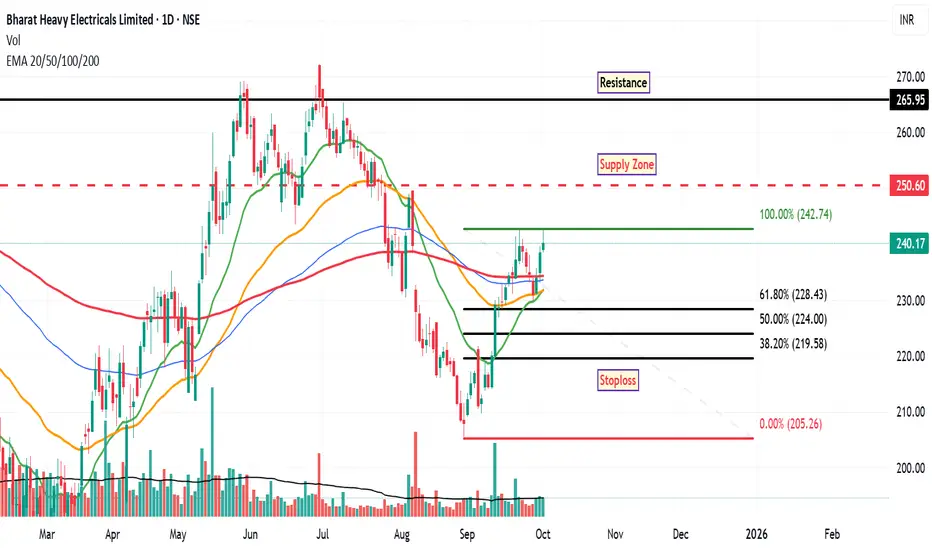
BHEL: Prospective InsightFollowing a recent retracement from a previously identified discount zone, the stock of Bharat Heavy Electricals Limited (BHEL) is exhibiting signs of potential bullish momentum. This outlook is supported by several technical indicators observed on the daily chart:
Fibonacci Retracement:
The st
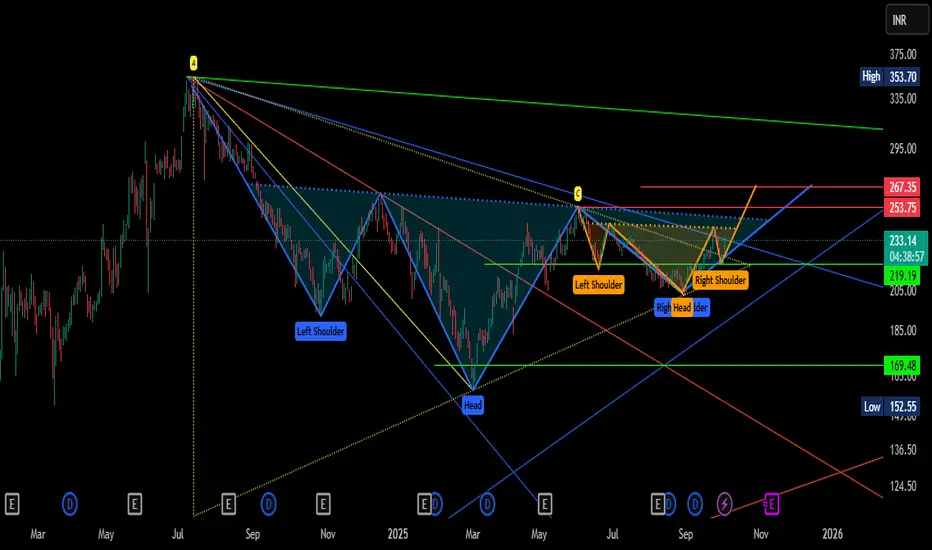
HUDCO FORMING COMBINATION OF PATTERNSThis stock forming 3 patterns 2 is INVERSE HEAD & SHOULDER bigger one is in blue color and other is in orrange color onr more pattern having breakout and having tasted reversed is triangle shown here in yellow color as ABCD .
Here i marked as support and resistances based on gann fan line crossi
BUY TODAY SELL TOMORROW for 5%DON’T HAVE TIME TO MANAGE YOUR TRADES?
- Take BTST trades at 3:25 pm every day
- Try to exit by taking 4-7% profit of each trade
- SL can also be maintained as closing below the low of the breakout candle
Now, why do I prefer BTST over swing trades? The primary reason is that I have observed that

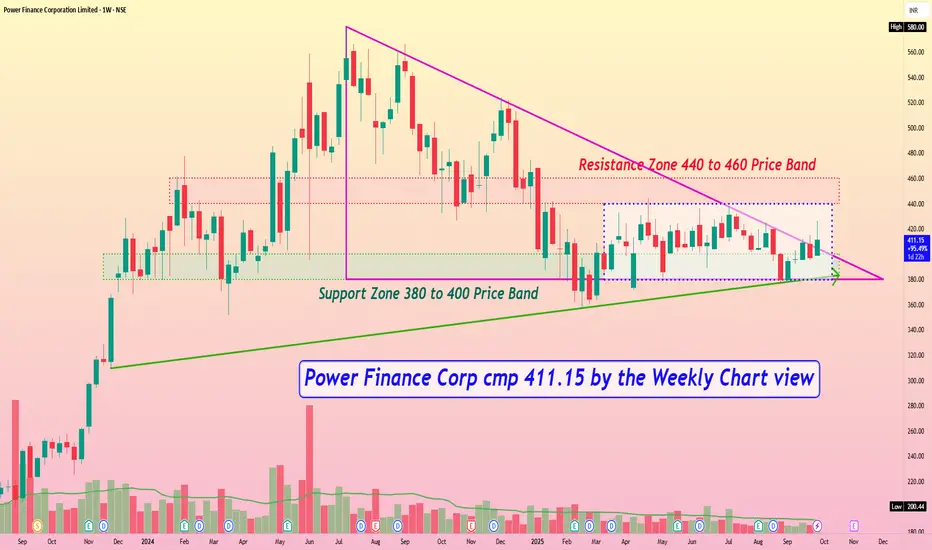
Power Finance Corp cmp 411.15 by the Weekly Chart viewPower Finance Corp cmp 411.15 by the Weekly Chart view
- Support Zone 380 to 400 Price Band
- Resistance Zone 440 to 460 Price Band
- Price traversing within Descending Triangle pattern after ATH
- Rising Support Trendline well respected by touch points since close to 2 years
- Price seen majorly t
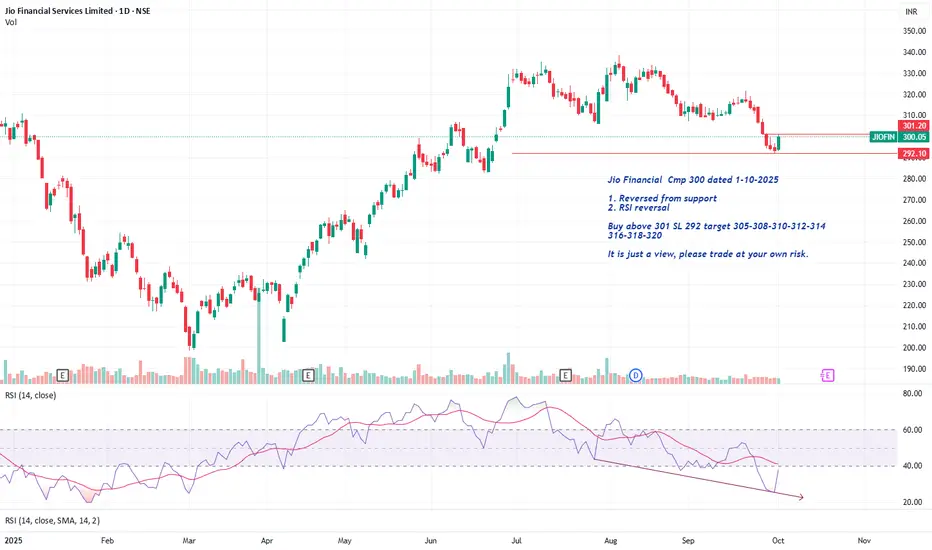
Jio Financial Cmp 300 Reversed from supportJio Financial Cmp 300 dated 1-10-2025
1. Reversed from support
2. RSI reversal
Buy above 301 SL 292 target 305-308-310-312-314
316-318-320
It is just a view, please trade at your own risk.
See all stocks ideas
Oct 8
PLASTIBLENPlastiblends India Limited
Actual
—
Estimate
—
Oct 8
AVANTELAvantel Limited
Actual
—
Estimate
—
Oct 8
JTLINDJTL Industries Limited
Actual
—
Estimate
—
Oct 9
TCSTata Consultancy Services Limited
Actual
—
Estimate
34.58
INR
Oct 9
IREDAIndian Renewable Energy Development Agency Ltd.
Actual
—
Estimate
—
Oct 9
GMBREWG.M. Breweries Ltd.
Actual
—
Estimate
—
Oct 9
HCLTECHHCL Technologies Limited
Actual
—
Estimate
15.55
INR
Oct 10
ELECONElecon Engineering Co. Ltd.
Actual
—
Estimate
—
See more events
Community trends
[SeoVereign] BITCOIN BEARISH Outlook – October, 03 2025The core basis for presenting a bearish perspective in this idea consists of two main points.
First, within the Double Zigzag pattern, each zigzag forms a 1:1 length ratio.
WAVE.Y1=WAVE.Z1
For easier identification, I have illustrated this section in the chart below.
The second is ZIF.
ZIF (Zone

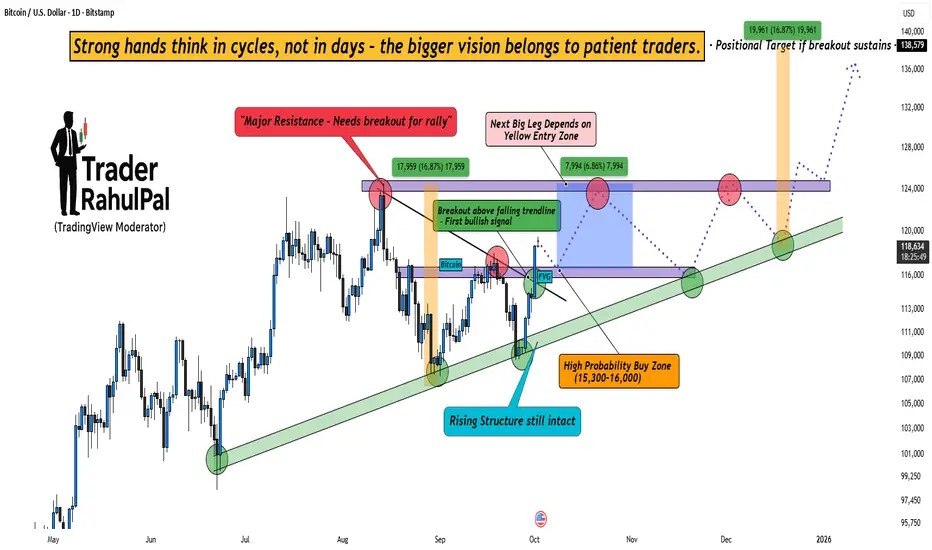
Bitcoin Cycle Play – The Setup That Could Change the Game!Bitcoin is currently showing clear bullish intent , but the real game lies in patience. The chart highlights a decisive breakout above the falling trendline , which is the first bullish signal after weeks of uncertainty.
At the same time, the rising structure is still intact , reminding us tha
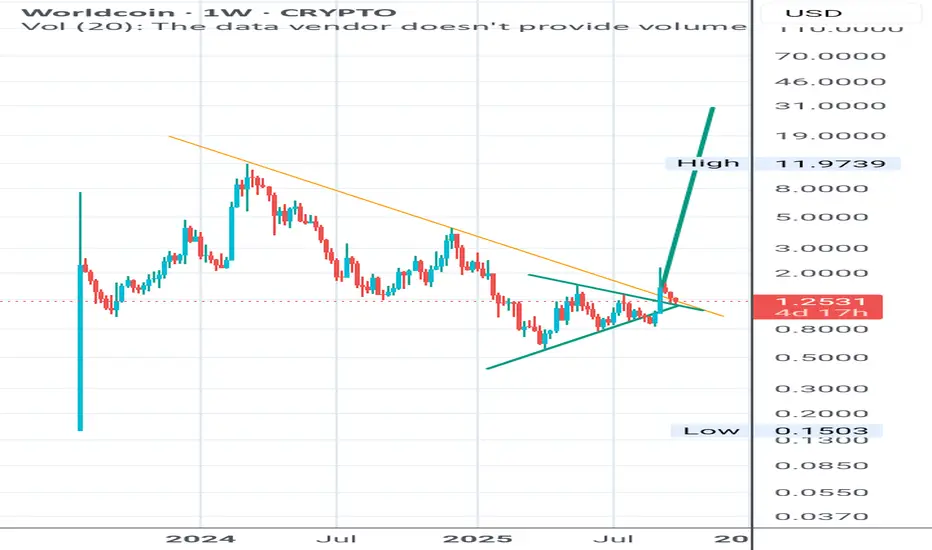
World Coin :: breakout from triangle. Hello Everyone,
I would like to present an Idea of exponential gains. Worldcoin recently broke out of two triangles; a small trinagle the price target of which has already been hit and a breakout of a very big triangle. The price is currently retesting the breakout line of the triangle. Please hav
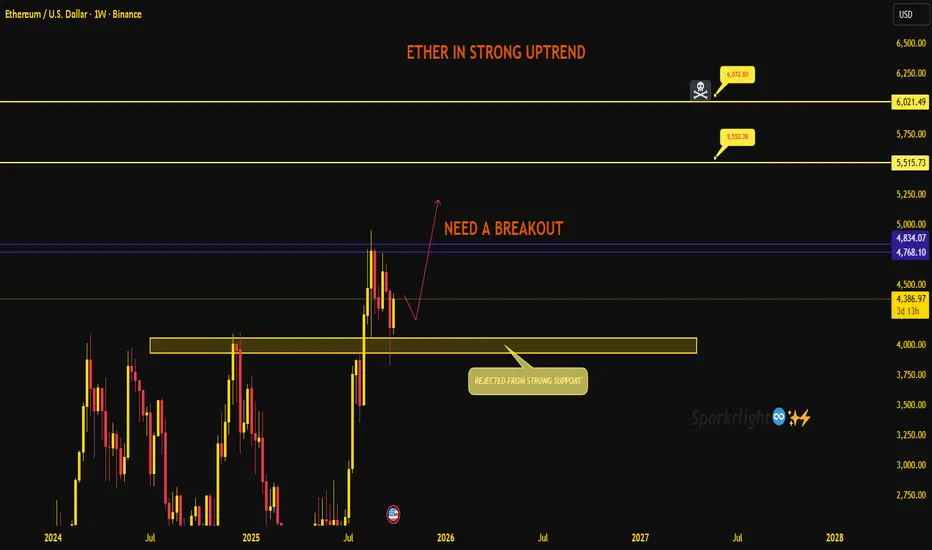
Ethereum – Strong Uptrend but Needs a Breakout!!Ether is still holding its strong uptrend, and the recent rejection from support has kept the bullish structure intact. The bigger picture remains positive, but short-term price action now demands a clear breakout to confirm continuation.
Current structure:
Price bounced cleanly from the 4000 zone
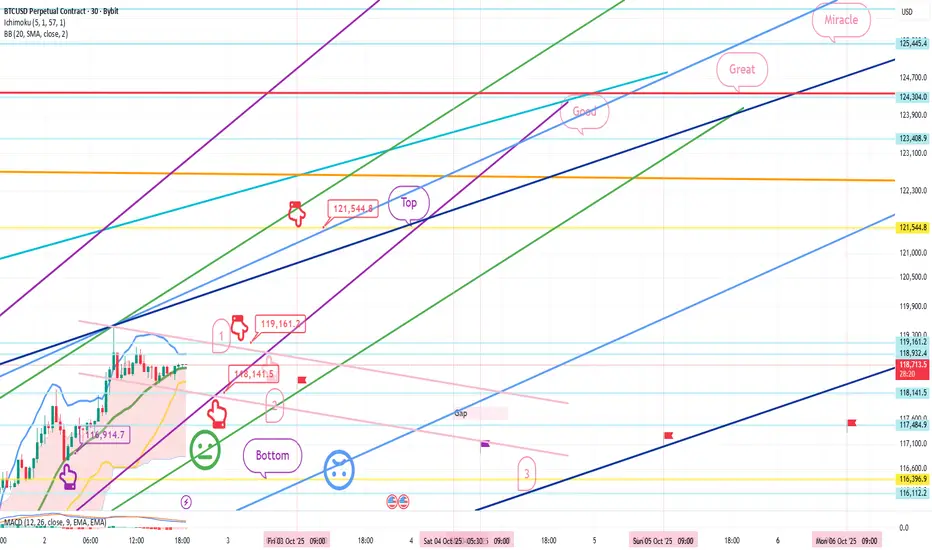
Bitcoin Bybit chart analysis October 2Hello
It's a Bitcoin Guide.
If you "follow"
You can receive real-time movement paths and comment notifications on major sections.
If my analysis was helpful,
Please click the booster button at the bottom.
This is a 30-minute Bitcoin chart.
The bottom left shows yesterday's long position re-en
Using a very easy method to TP for daytradingUsing a very easy method to TP for daytrading looking at the shorts I took today ZEC - ZEN & DASH....Candle by candle method

XRP Price Action – Accumulation Before GrowthXRP is currently navigating a phase defined by liquidity-driven swings and rapid sentiment shifts. After the market endured a heavy decline, buyers have re-emerged, showing resilience through aggressive rebounds. This behavior reflects a deeper pattern: sellers are losing efficiency in driving the m

Bitcoin on a good buying zoneBtc is extremely bullish and may cross the key resistance level.
Buy only after when you see a good consolidation and strong green candle.

btc bullish Zone in 4hrthis zone is crucial and if it hold above this zone then new higher high is about to made


See all crypto ideas
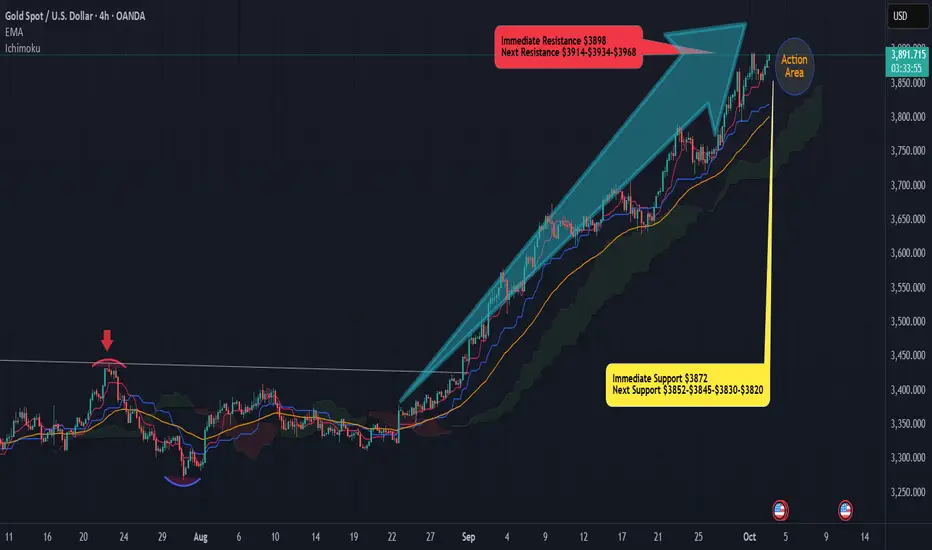
US Government Shutdown Sends Gold Flying HigherWhat's Happening With Gold?
Gold continues recording new high despite monthly RSI reading of 89-90 signalling extremely overbought conditions and casual pullbacks are attracting buyers on any dip towards value areas resuming higher high and higher low structure which is precisely bullish.
Disappoint

XAUUSD – WOLFE WAVE CONTINUES, PRIORITISE BUYING
Hello trader 👋
On 02/10, we begin with the continuation scenario of the Wolfe Wave pattern. In yesterday's session, gold prices followed the upward rhythm of the pattern, but the decline at the upper line was not truly effective. Today, the market is forming a new price channel with a wider range

BUY GOLD UNTIL WAVE 5 END - BIG SHORT IN NEXT 2 DAYS 📊 Trading Plan based on SMC + Elliott Wave
1. Market Context
SMC (Smart Money Concept):
Price is consolidating around a strong liquidity zone.
Evidence of a stop hunt / long squeeze before a potential reversal.
The 3820 – 3822 area acts as a Demand Zone, where Smart Money is likely accumulating

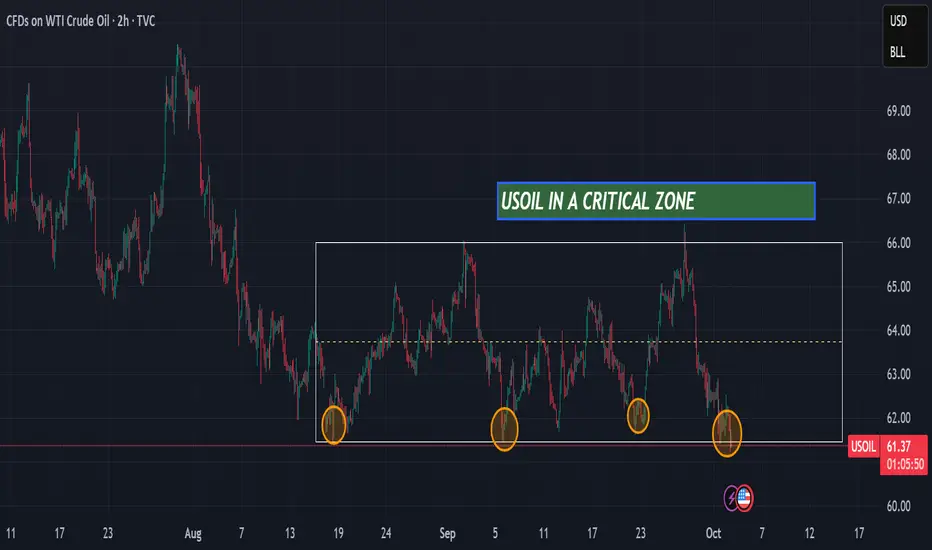
USOIL is in a critical zoneHello,
USOIL is currently at a major support level that has held for the past 2 months. There are two possible scenarios: either the support holds and USOIL bounces back toward the resistance at $66, or the support breaks and the price moves down to the next level at $60,
Ibrouri Abdessamad
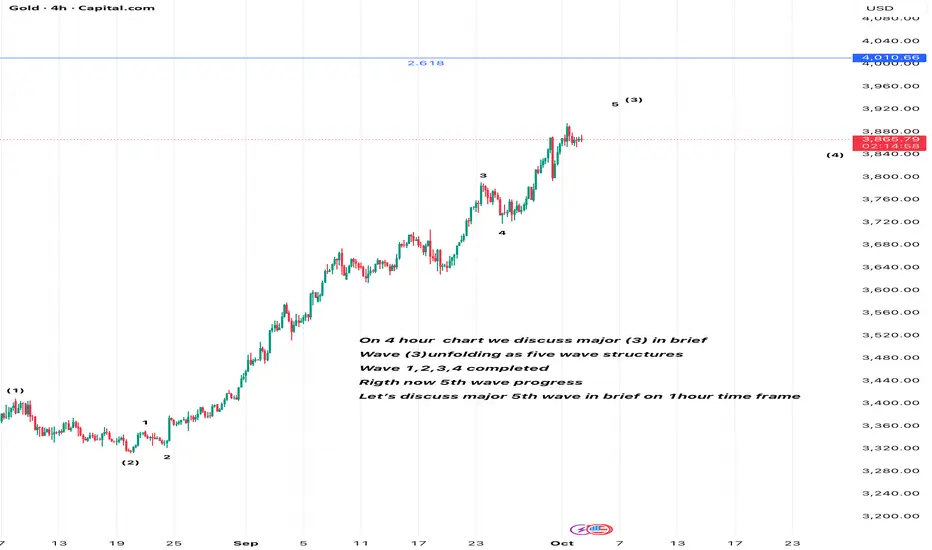
GoldOn 4 hour chart we discuss major (3) in brief
Wave (3)unfolding as five wave structures
Wave 1,2,3,4 completed
Rigth now 5th wave progress
Let’s discuss major 5th wave in brief on 1hour time frame
Disclaimer : do research before investing/ do trade at your own risk
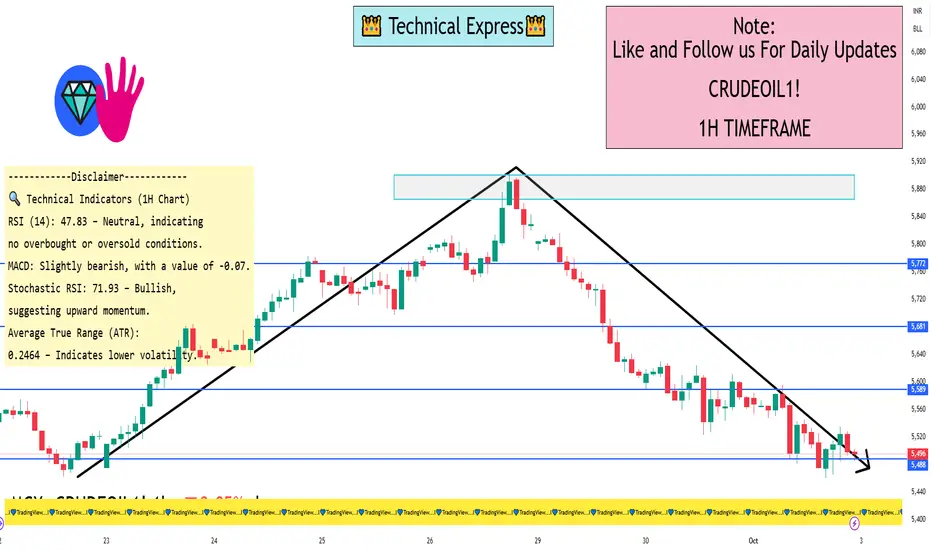
ITC 1 Day View📉 Key Support Levels (1H Timeframe)
₹5,436.67 – Immediate support level.
₹5,357.00 – Next support zone.
📈 Key Resistance Levels (1H Timeframe)
₹5,629.00 – Immediate resistance level.
₹5,708.67 – Next resistance zone.
🔍 Technical Indicators (1H Chart)
RSI (14): 47.83 – Neutral, indicating no o
spot gold or mcx gold update as per chartgold spot looks stair pattern or now news in focus usa shut down--
technical lvl- spot gold abv 3883 looks again up side 3900-3920--3945$ where support 3860$ which break blow with volume than more down fall 33852--42--34$ expect.
mcx gold sustain abv 118300 looks 119k near where support 117700 whi
Gold Trading Strategy for 02nd October 2025📊 Gold Intraday Trading Plan
👉 Timeframe: 15-Minute Candle Strategy
🟢 Buy Setup (Long Trade)
✅ Condition: Enter only if a 15-min candle closes above ₹3878
🎯 Targets:
₹3889
₹3899
₹3905
🛑 Stop Loss: Place below the candle low that gave the breakout
💡 Explanation
Wait for a 15-minute candle to fully

Silver holding buynfrom 144000 , target 145600Silver holding buy from 144000, target 145600 , upside target big but mcx closed tomorrow so will book profit.
Yesterday also bought at 141500 and booked today at 144100
How My Harmonic pattern projection Indicator work is explained below :
Recent High or Low :
D-0% is our recent low or high

See all futures ideas
EURUSD Sell Setup – Multi-Timeframe ConfluenceEURUSD Sell Setup
📍 Bias: Short-Term Bearish (4H)
📍 Pair: EUR/USD
🔑 Market Context
On the Daily timeframe, EURUSD still holds a bullish structure.
But on the 4H timeframe, the market is showing clear bearish momentum.
The US Dollar Index (DXY) continues to strengthen, adding weight to a potential d

Euro Dollar Analysis – Corrective Rebound or Bearish Setup?EUR/USD continues to operate within a controlled market cycle. The sharp decline earlier this week highlighted strong bearish momentum, followed by a corrective rebound that served as a liquidity reset. This rebound is less about trend reversal and more about rebalancing order flow after an aggressi

EURUSD – Head and Shoulders Breakdown in Play!!The chart is showing a clear Head and Shoulders formation, a bearish reversal structure that signals the market may be preparing for a deeper drop if neckline support gives way.
Chart validation:
Left Shoulder, Head, and Right Shoulder are well-defined.
The neckline sits around 1.1646 – this is t

FXHUNTER / GBPUSDGBPUSD symbol analysis: The trend of this symbol is currently bearish and in this situation we have a supply area with a liquidity area formed near it and most likely a Hunter Stop is forming.

EURUSD MULTI TIME FRAME ANALYSISHello traders , here is the full multi time frame analysis for this pair, let me know in the comment section below if you have any questions , the entry will be taken only if all rules of the strategies will be satisfied. wait for more price action to develop before taking any position. I suggest yo


USD/JPY H4 – SMC Mapping & Trading Plan1. Market Structure
Overall trend: bullish, with multiple Break of Structure (BOS) to the upside.
Currently in a corrective pullback, retesting demand zones.
Strong liquidity resting below around 146.000 (Buy Zone Liquidity).
2. Key Zones
Sell Zone (Supply/CP):
148.500 – 148.800
Supply zone a

Sell Trade - EUR/USDGreetings to everyone!
You can place a sell trade on EUR/USD and check out my chart for the ideal entry, stop-loss & target placement.
Remember :-
* Move your SL to breakeven once the trade reaches 1:1 R.
* Aim for a minimum reward of 1:1.5 R.
* Don't risk more than 3% of your total margin.

AUDCAD besrish ( Sell )📌 Trade Plan (AUDCAD)
Sell Limit (Entry Zone):
0.91514
0.91493
Stop Loss (SL): Just above the marked “Caution” zone (around 0.91680–0.91700 area).
Take Profit (TP):
TP Liquidity: 0.90767
---
📌 Why Sell?
Price retesting supply zone (Caution area).
Wyckoff distribution + UTAD test conflu

EURUSD, NFP WEEKEU in a weekly looks good for sells
in Dialy tf we have a clean sell FVG at the place we have one 4H candle indicating that it need to go down in until the one 4H candle close in downwards direction
In entry time frame which is 15M have a clean engulfing candle at the sell FVG of 15M

See all forex ideas
| - | - | - | - | - | - | - | - | ||
| - | - | - | - | - | - | - | - | ||
| - | - | - | - | - | - | - | - | ||
| - | - | - | - | - | - | - | - | ||
| - | - | - | - | - | - | - | - | ||
| - | - | - | - | - | - | - | - | ||
| - | - | - | - | - | - | - | - | ||
| - | - | - | - | - | - | - | - | ||
| - | - | - | - | - | - | - | - |
Trade directly on the supercharts through our supported, fully-verified and user-reviewed brokers.


