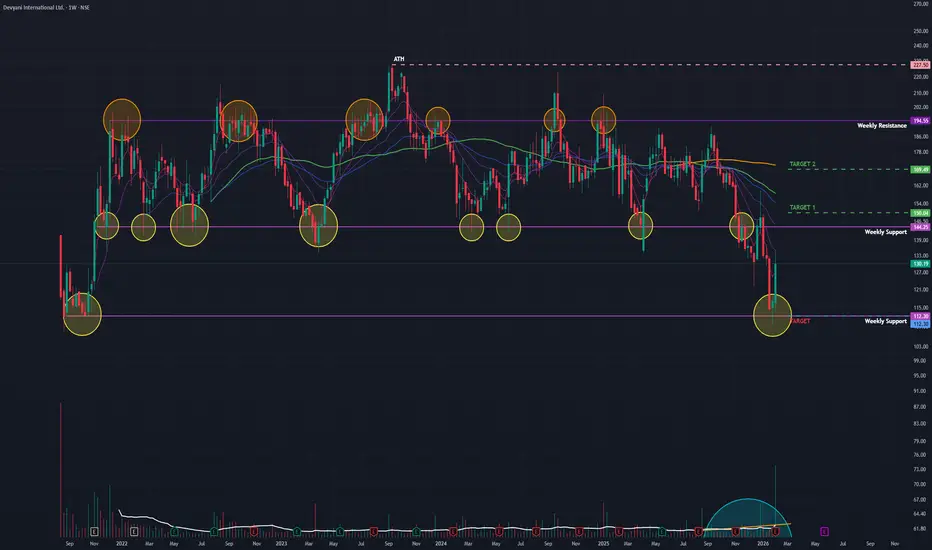
Devyani Int (W): Aggressive Bullish, Turnaround at Major Support(Timeframe: Weekly | Scale: Logarithmic)
The stock has confirmed a major "V-Shape Reversal" from its long-term support zone of ₹110. The surge is backed by "Climax Volume" and a positive reception to its Q3 operational updates, signaling that the 2-year correction might be over.
🚀 1. The Fund

The best trades require research, then commitment.
Get started for free$0 forever, no credit card needed

Scott "Kidd" PoteetPolaris Dawn astronaut

Where the world does markets
Join 100 million traders and investors taking the future into their own hands.
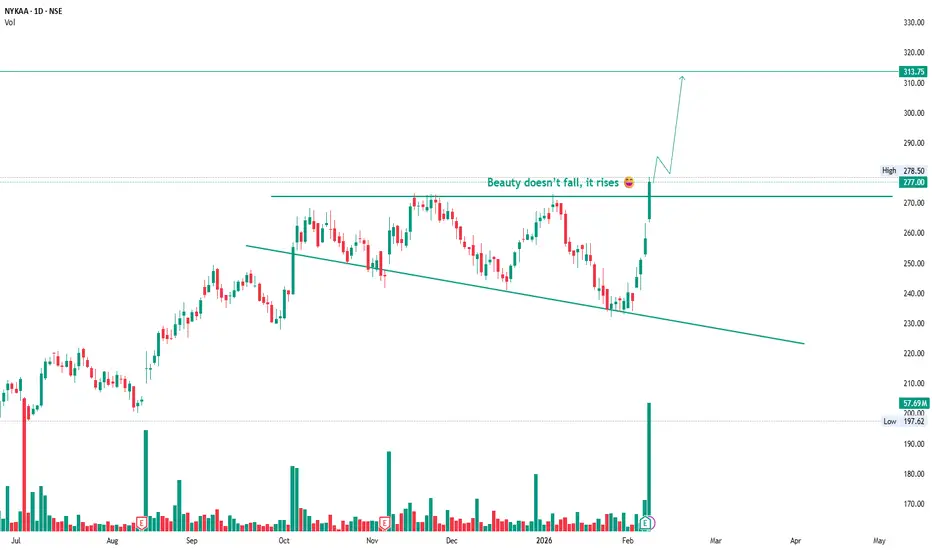
Nykaa: Descending Trendline BreakoutNykaa respected the rising structure even during the correction and never lost its trend strength.
Price held the sloping support, absorbed selling pressure, and then gave a clean breakout above the key horizontal resistance around 277 with strong volume.
This move shows acceptance above resistanc
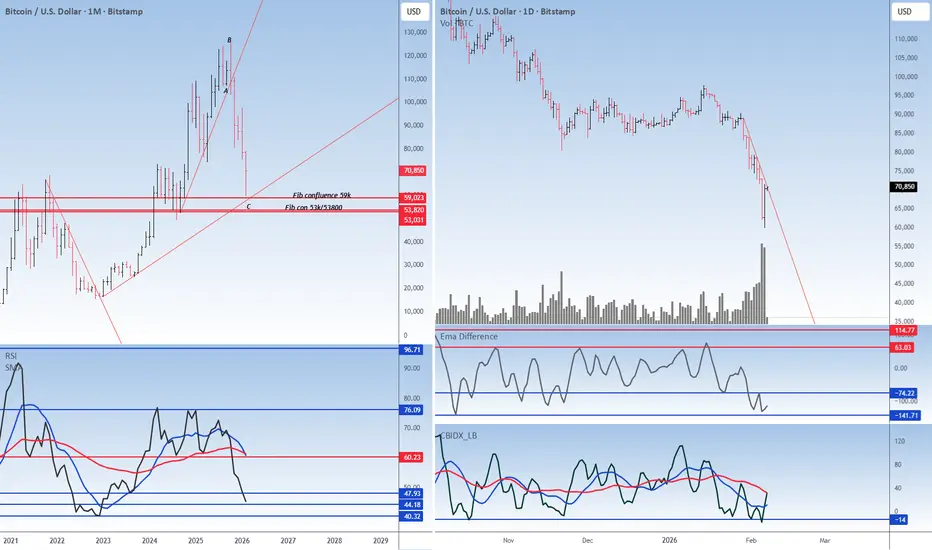
The crypto has found its supportBitcoin CMP $70690
The beauty of looking at various asset classes is that they rise and fall together. In my view the correction in the crypto is over.
Elliott- The v waves within the C wave is done. Hence to me this correction is over.
Fib- The crypto reversed just shy away from the 59K whic
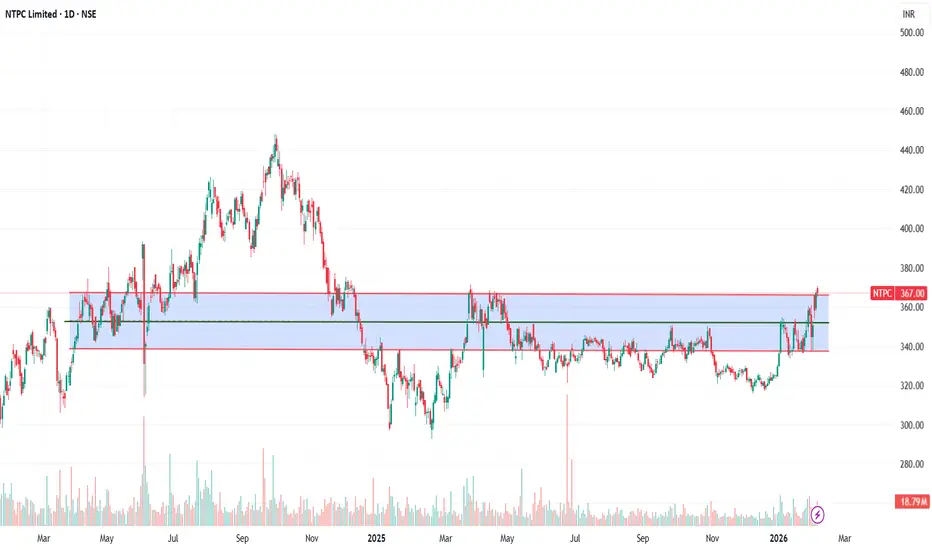
NTPC.. Moved outside the channel..NTPC.. Trying its level best to move.
Selling pressure in market pulled it back and retested the support.
Now things can be interesting..
Moved above this channel then first target can be somewhere around 370, the exact level from where it faced resistance today..
Second can be somewhere around
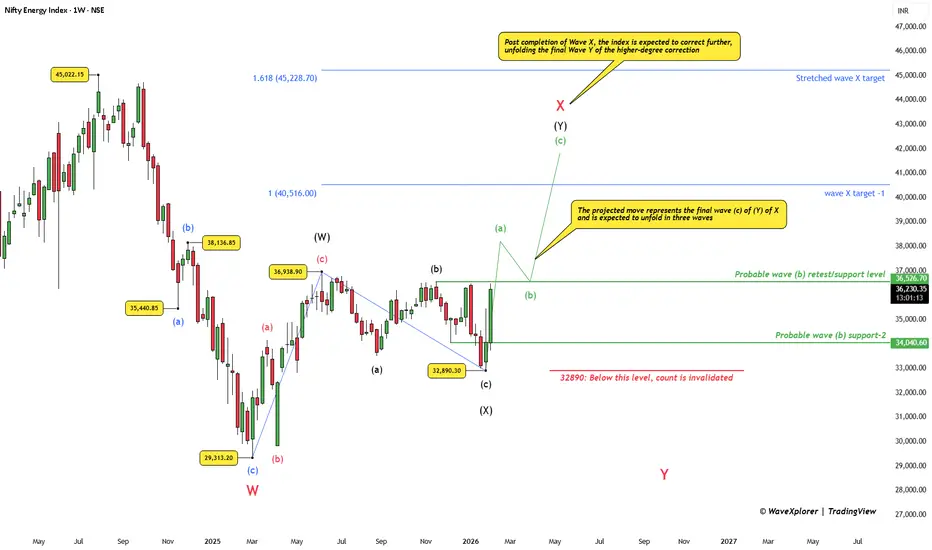
Nifty Energy: Final Bounce Before the Deeper CorrectionThe Nifty Energy Index continues to trade within a higher-degree corrective structure rather than a fresh impulsive uptrend.
The decline from the highs appears to have completed Wave W, followed by an ongoing recovery in Wave X.
In the near term, the structure allows for one more upside phase . A
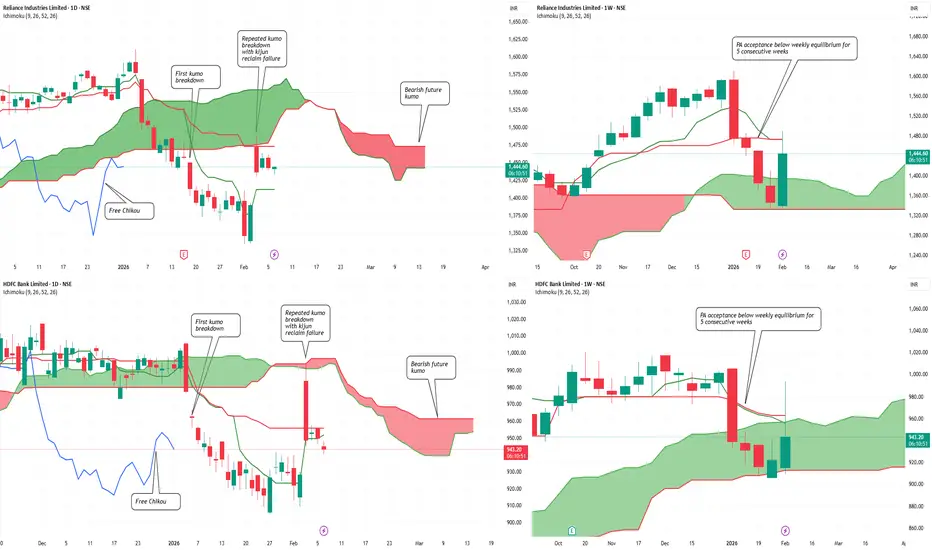
Dead Cat Bounce in Nifty? Heavyweights to Deliver The VerdictDead Cat Bounce in Nifty? Index Heavyweights to Deliver the Verdict Soon…
Both index heavyweights remain structurally weak despite the recent bounce.
On the daily timeframe, Reliance Industries and HDFC Bank have transitioned out of bullish Ichimoku regimes. Crucially, the second daily Kumo
Long term analysis of Tanla Platforms Ltd.Wrap up:-
As per chart of Tanla Platforms Ltd., it seems that correction in Tanla is over with a wxy pattern in major wave 2 and also, after breakout it has retested the support. Now, major wave 3 is about to start/started.
What I’m Watching for 🔍
As initial breakout is confirmed for a probabl

Understanding the Down Trend Line Breakout : Base chart GALLANTTUnderstanding the Down Trend Line Breakout : Base chart GALLANTT ISPAT Ltd
Introduction
Gallantt Ispat Limited, currently trading around 580.00 on its daily chart, has been moving below a persistent down trend line since August 2025. Recently, the stock has shown signs of strength by forming a doubl

JK Tyre & Industries Ltd – Weekly Chart Breakout WatchJK Tyre & Industries Limited is currently showing strong momentum, and the price action suggests that the stock may be approaching a fresh breakout above the ₹554 level.
Since this analysis is based on the weekly timeframe, the primary focus will be on a weekly breakout and weekly closing above

On the 1H chart, $BNB is forming a Head & ShouldersOn the 1H chart, CRYPTOCAP:BNB is forming a Head & Shoulders after a strong sell-off from the 900+ region.
Left Shoulder: ~785–790
Head: ~728 (marked low on chart)
Right Shoulder: ~770–775
Neckline / Supply Zone: 780–785
Current price is trading below the neckline, which keeps the structure

See all editors' picks ideas
Smart Trader, Episode 03, by Ata Sabanci, Candles and TradelinesA volume-based multi-block analysis system designed for educational purposes. This indicator helps traders understand their current market situation through aggregated block analysis, volumetric calculations, trend detection, and an AI-style narrative engine.
━━━━━━━━━━━━━━━━━━━━━━━━━━━━━━━━━━━━━━━

Asset Drift ModelThis Asset Drift Model is a statistical tool designed to detect whether an asset exhibits a systematic directional tendency in its historical returns. Unlike traditional momentum indicators that react to price movements, this indicator performs a formal hypothesis test to determine if the observed d

Hyperfork Matrix🔱 Hyperfork Matrix 🔱 A manual Andrews Pitchfork tool with action/reaction propagation lines and lattice matrix functionality. This indicator extends Dr. Alan Andrews' and Patrick Mikula's median line methodology by automating the projection of reaction and action lines at equidistant intervals, cr

Arbitrage Matrix [LuxAlgo]The Arbitrage Matrix is a follow-up to our Arbitrage Detector that compares the spreads in price and volume between all the major crypto exchanges and forex brokers for any given asset.
It provides traders with a comprehensive view of the entire marketplace, revealing hidden relationships among d

Wyckoff Schematic by Kingshuk GhoshThe "Wyckoff Schematic" is a Pine Script indicator that automatically detects and visualizes Wyckoff Method accumulation and distribution patterns in real-time. This professional tool helps traders identify smart money movements, phase transitions, and critical market structure points.
Key Features

Volume Cluster Profile [VCP] (Zeiierman)█ Overview
Volume Cluster Profile (Zeiierman) is a volume profile tool that builds cluster-enhanced volume-by-price maps for both the current market window and prior swing segments.
Instead of treating the profile as a raw histogram only, VCP detects the dominant volume peaks (clusters) insid

DeeptestDeeptest: Quantitative Backtesting Library for Pine Script
━━━━━━━━━━━━━━━━━━━━━━━━━━━━━━━━━━
█ OVERVIEW
Deeptest is a Pine Script library that provides quantitative analysis tools for strategy backtesting. It calculates over 100 statistical metrics including risk-adjusted return ratios (Sharpe

Arbitrage Detector [LuxAlgo]The Arbitrage Detector unveils hidden spreads in the crypto and forex markets. It compares the same asset on the main crypto exchanges and forex brokers and displays both prices and volumes on a dashboard, as well as the maximum spread detected on a histogram divided by four user-selected percenti

Multi-Distribution Volume Profile (Zeiierman)█ Overview
Multi-Distribution Volume Profile (Zeiierman) is a flexible, structure-first volume profile tool that lets you reshape how volume is distributed across price, from classic uniform profiles to advanced statistical curves like Gaussian, Lognormal, Student-t, and more.
Instead of forcin

Multi-Ticker Anchored CandlesMulti-Ticker Anchored Candles (MTAC) is a simple tool for overlaying up to 3 tickers onto the same chart. This is achieved by interpreting each symbol's OHLC data as percentages, then plotting their candle points relative to the main chart's open. This allows for a simple comparison of tickers to tr

See all indicators and strategies
Community trends
Devyani Int (W): Aggressive Bullish, Turnaround at Major Support(Timeframe: Weekly | Scale: Logarithmic)
The stock has confirmed a major "V-Shape Reversal" from its long-term support zone of ₹110. The surge is backed by "Climax Volume" and a positive reception to its Q3 operational updates, signaling that the 2-year correction might be over.
🚀 1. The Fund
BSE Ltd | Bullish Consolidation Near ₹3,000 | Liquidity & Trend
NSE:BSE Ltd (Daiy)
Bullish Continuation | Liquidity-Supported Breakout Setup
BSE Ltd continues to trade in a strong primary uptrend, maintaining a clear higher-high, higher-low structure on the daily timeframe. Price
Trigger: Daily close above ₹3,030 with volume
Price Compressing Near Range Hig

INDIGO PAINTS | Daily TF | Swing Buy Setup INDIGOPNTS :- 1D | Buy
Entry: > 1006
SL: 975
T: 1080/1140/1200
For study and learning purposes only. Not financial advice

#LICHSGFIN at 506. Nicely poised for a good move. #LICHSGFIN at 506. Decent financials. FIIs/DIIs have a decent stake which is by and large stable. Quarterly results on 31st. Technically the stock has finished sub wave 4 and is now trying to wind up sub wave-2 of primary -5 and start sub -3 of primary -5 for tgt 891. WTF chart is almost identical.

Amber: High-Voltage Momentum Hits ResistanceAMBER is going to face most critical immediate trigger of the Board Meeting on February 9, 2026, scheduled to approve the unaudited financial results for the quarter ended December 31, 2025.
While Kotak maintains a "Buy" rating with a target of ₹8,100, citing a rebound in RAC (Room Air Conditioner)

Nykaa: Descending Trendline BreakoutNykaa respected the rising structure even during the correction and never lost its trend strength.
Price held the sloping support, absorbed selling pressure, and then gave a clean breakout above the key horizontal resistance around 277 with strong volume.
This move shows acceptance above resistanc
When Price Respects Structure: MTFAThis post is not a forecast and not a trade idea.
It’s simply a visual study of how price behaves when multiple higher-timeframe elements overlap.
Using historical price action only, this chart highlights:
-Monthly Fair Value Gap (Green Zone)
Showing how price reacts, respects, and rebalances ineff

APOLLOPIPE | Channel & Trendline Breakout with Huge Volume💰 CMP: 313.40
📊 Breakout Context: Channel / Trendline breakout confirmed with strong volume current candle, adding conviction.
🎯 Target: 480 (+53.1%)
🛑 Stop Loss: 264 (-15.8%)
⚖️ Risk/Reward Ratio: ~1 : 3.36
🔑 Key Notes:
📌 Strong volume breakout suggests genuine momentum; monitor for retests.
📍

BUY TODAY SELL TOMORROW for 5% DON’T HAVE TIME TO MANAGE YOUR TRADES?
- Take BTST trades at 3:25 pm every day
- Try to exit by taking 4-7% profit of each trade
- SL can also be maintained as closing below the low of the breakout candle
Now, why do I prefer BTST over swing trades? The primary reason is that I have observed t

TORRENT POWER:Likely Tri-Angle Breakout -Huge Target is on cardsTORRENT POWER
-Formed a Triangle Pattern in weekly chart
-Trading at 1429 and above Tri-Angle Pattern Trend line
-trading above all its critical Moving averages Viz 10/20/50/100 in Daily Charts
-Stochastic RSI -Positive divergence at cross over 40 suggests trend reversal and possible upside
-Combina

See all stocks ideas
Today
APOLLOApollo Micro Systems Ltd.
Actual
—
Estimate
—
Today
OLAELECOla Electric Mobility Limited
Actual
—
Estimate
−0.93
INR
Today
CHOLAHLDNGCholamandalam Financial Holdings Ltd
Actual
—
Estimate
—
Today
VIPINDV.I.P.INDUSTRIES LTD.
Actual
—
Estimate
−2.46
INR
Today
SANSERASansera Engineering Limited
Actual
—
Estimate
12.59
INR
Today
CELLOCello World Limited
Actual
—
Estimate
3.70
INR
Today
HAPPYFORGEHappy Forging Limited
Actual
—
Estimate
7.80
INR
Today
BATAINDIABata India Ltd
Actual
—
Estimate
4.86
INR
See more events
Community trends
The crypto has found its supportBitcoin CMP $70690
The beauty of looking at various asset classes is that they rise and fall together. In my view the correction in the crypto is over.
Elliott- The v waves within the C wave is done. Hence to me this correction is over.
Fib- The crypto reversed just shy away from the 59K whic
BITCOIN TRYING FOR BREAKOUT - BULL RUN !BITCOIN TRYING FOR BREAKOUT - BULL RUN !
Might goes up till 90k$

ETH/USD Daily — Support Bounce Setup in a Strong Downtrend
Chart Analysis:
Market Structure:
ETH is clearly in a bearish trend on the daily timeframe. Lower highs and lower lows are intact after a sharp rejection from the major supply zone around 3,300–3,400 (yellow zone).
Impulsive Sell-Off:
The recent move down is strong and aggressive, suggesting capi

From $6 to $0.10 – The $5 Comeback Story Nobody's Talking About MIL:ENA : From $6 to $0.10 – The $5 Comeback Story Nobody's Talking About Yet
As Predicted, Price dumped 60% after breaking down from $0.24 support, now sitting at $0.10.
Current Status:
✅ $0.08–$0.10 = Prime accumulation zone activated
⚠️ Still possible dip to $0.06 (best long-term entry if it hi

BTC 4H Update
Price still trapped in a descending structure.
Lower highs intact, trendline resistance holding.
🔻 Rejection near 71.6k
🧱 Major supply: 85.9k – 90.4k
🛡 Key support: 59.9k
As long as BTC stays below the trendline, rallies look like relief bounces.
Break above = momentum shift.
Lose 60k = next leg do

BTCUSD (1H) – Range Support Bounce | Bullish Reversal SetupBTCUSD (1H) – Range Support Bounce | Bullish Reversal Setup
Bitcoin is trading on the 1-hour timeframe after completing a corrective decline and forming a clear range structure. Price has recently reacted strongly from the lower demand/support zone, indicating buyer interest at this level.
Technical

Crash : the OPPORTUNITY or a TRAPThese are the common crash levels that I have marked
After every crash it has bounced back with atleast 100% of return
I think this crash is also not different it's opportunity that may give a decent return
share your views Is this a opportunity cost ?

BITCOIN Bitcoin Liquidity Sweep Setup – Distribution in Progress?
Bitcoin is currently trading inside a clear upper liquidity zone after a strong impulsive recovery from the lows. Price has now made three attempts to break the upper supply area, but each push is showing weakening momentum.
🔎 What I’m Seei

$ENA bounced hard from the 0.10 and is now consolidating in 1hrMIL:ENA bounced hard from the 0.10 base and is now consolidating inside a bullish flag on the 1H chart. This structure usually forms when sellers are exhausted and price pauses before the next leg. Importantly, this is price compression after expansion, not a weak sideways drift.
Within the flag,

BTCUSD Trend Change, Support & Resistance ZonesBTCUSD is showing signs of slowing down after a strong fall and is moving into a short-term recovery. Earlier, price was making lower highs and lower lows, following a downward trendline, with strong selling pressure. Gaps during the fall show that buyers were weak at higher levels.
Price found sup

See all crypto ideas
Gold Breaks Falling Resistance– Structure Shift Signals PossibleGold has finally broken above the falling resistance trendline, and more importantly, the market structure has flipped. This is the key reason why breakout trades start working better after long corrections.
Earlier, price was respecting the falling trendline, but once sellers failed to push it low

XAUUSD – Brian | M15 Liquidity ReactionXAUUSD – Brian | M15 Liquidity Reaction & Short-Term Structure
Gold is currently trading within a short-term recovery leg after sweeping downside liquidity earlier in the week. The rebound from the lows shows clear liquidity absorption, but price is now approaching a critical sell-side reaction zon

Gold Consolidates to Form a Base — Bullish Trend Restarting!✅ 4H Trend Analysis
● After rebounding from the 4402 low, the market completed the first phase of recovery and has now entered a stage of gradual consolidation and upward movement.
● The current price has moved back above MA10 and MA20 (around 4900), and the short-term moving averages are beginning

Is crude headed north?Crude CMP $63.49
Elliott- this entire correction to me is the 2nd wave and now the 3rd wave should commence from here.
Directional signal- the double bottom is a directional signal. It needs to close above 69 on the monthly basis to confirm the same.
Fibonacci- it made a double bottom at the f

Gold 4H🧠 Market Structure
Price is currently moving in a sideways consolidation after a strong bearish move followed by a recovery.
EMA 9 & EMA 15 are flat and tight → indicating low momentum & upcoming volatility expansion.
Market is trading inside a mid-range zone, not at premium or discount extremes.

XAUUSD/GOLD WEEKLY SELL PROJECTION 08.02.26XAUUSD Weekly Sell Projection – 08.02.26
This is the XAUUSD weekly chart, and this analysis is based on 08 February 2026.
Gold is currently trading near a major resistance zone, where strong selling pressure was seen earlier.
After a sharp rejection from the R2 resistance area, price dropped aggr

XAUUSD H1 – Trendline retest may trigger next bullish moveMarket Context (Macro → Flow) Gold remains highly sensitive to macro headlines as markets continue to price in policy uncertainty around the Fed path and real yields. While no major shock hit today, flows show defensive positioning returning on dips, keeping gold supported despite recent volatility.

XAUUSD (H2) – Liam's AnalysisXAUUSD (H2) – Liam View
Rally into supply | Volatility risk rising
Gold is rebounding from the 4550–4600 demand base, but the broader H2 structure still points to a selling environment. The current move higher looks corrective, driven by short covering and liquidity rotation rather than a confirmed

be ready for gold crash i have seen an diversion in rsi of gold and before i have seen there was a big short position in gold so i also think gold need correction so be ready below red line.

XAUUSD – H1 Outlook: Buying InterestXAUUSD – H1 Outlook: Liquidity Build While Risk Premium Supports Gold | Lana ✨
Gold is holding firm after a clean rebound from the sell-side liquidity sweep, and the current price action suggests the market is now building structure rather than trending aggressively.
📌 Technical picture (SMC/flow-

See all futures ideas
EURGBP - Weekly Smart Money PlanMarket Context
EURGBP steps into the new week under strong macro influence as markets reprice Bank of England vs ECB rate expectations. Sticky UK inflation, mixed UK data, and growing speculation around ECB rate cuts are driving erratic flows rather than clean directional trends.
This backdrop fav

USDCHF Is Not Weak – It’s Testing Support!USD/CHF is currently trading inside a well-defined rising channel, and the recent move lower looks more like a pullback into trend support rather than a breakdown.
For me, this is typical behavior in trending markets. Strong moves don’t continue in a straight line, price pulls back, tests support,

Expecting The Usdchf is preparing for sellside delivery *CHF more stronger than
dollar fundamentally,also it's running
all time low , filled
the weekl daily imbalance and my
expectations to Target liquidity below.
* Even if monthly flips it might go keep on n on lower
Why I did not above near the order block above the monthly breaker? Cause it's

EURUSD Technical Overview (1H Timeframe)EURUSD remains positioned within a corrective market structure following a strong bearish displacement from the higher-timeframe supply zone. The sharp rejection from the 1.1830 to 1.1850 region highlights the validity of the identified bearish order block, indicating active institutional supply and

EURAUD MULTI TIMEFRAME ANALYSIS Hi traders, this is the complete multi-time frame analysis for this pair. Please feel free to ask any questions in the comment section below. The entry will only be made if all strategy rules are met.

EURUSD ANALYSIS OVER 15M CHARTEUR/USD remains under downside pressure, with UOB maintaining a bearish bias while highlighting 1.1750 as a key support level. A deeper move toward 1.1725 is currently seen as less likely, as long as price stays below the strong resistance zone near 1.1860.
Despite the broader downside risk, I’m **

Fall incoming? I don't think so.Hello traders!
Long time no see... With the Japanese elections just around the corner, there are certain speculations of an incoming fall. My analysis does not agree with that. I think JPY is heading for 159.500 buyside liquidity . Even if it is heading lower, it is highly unlikely that it goes no

See all forex ideas
Trade directly on Supercharts through our supported, fully-verified, and user-reviewed brokers.


