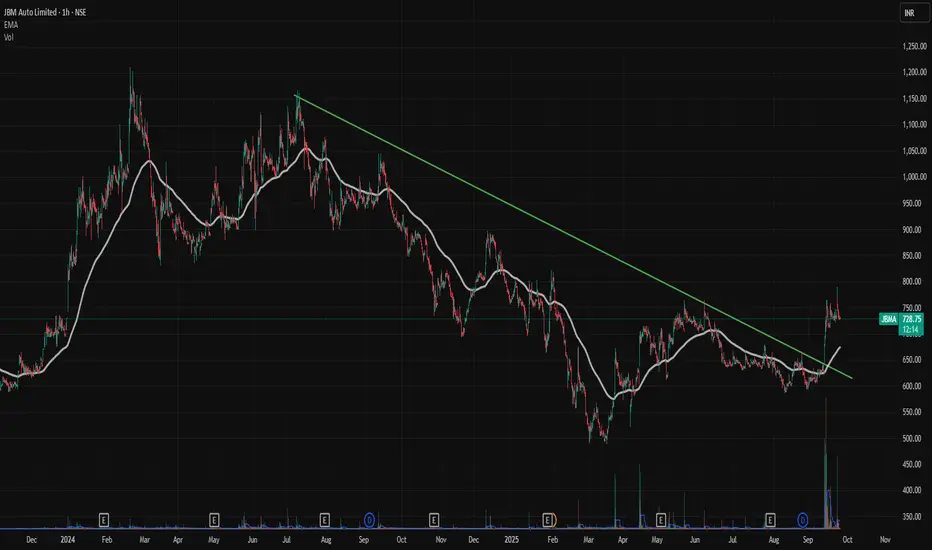
Gapup breakout in JBMAA good good gap up in JBMA.
Very healthy volumes showing up.
Very good time to enter as consolidating after gapup
Trendline breakout also.
good setup
can enter on 1 hr time frame
Risk to Reward ratio 1:2 or higher .
Thank u
Abdul Maajid Gouri

The best trades require research, then commitment.
Get started for free$0 forever, no credit card needed

Scott "Kidd" PoteetThe unlikely astronaut

Where the world does markets
Join 100 million traders and investors taking the future into their own hands.
Major indices
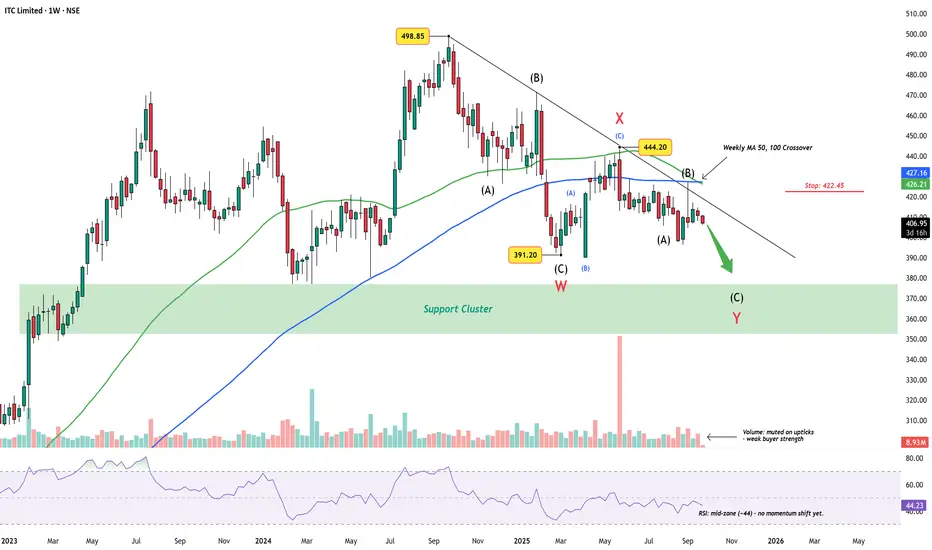
ITC Limited Weekly Chart – Wave Y Targets Support ClusterITC has been trending lower since the ₹498.85 peak, carving out what appears to be a complex W-X-Y correction. The first leg (W) found support near ₹391.20, followed by a corrective bounce into X at ₹444.20. The decline since then has kept price under a descending trendline, respecting the larger co
Tanla Platforms : Inverted Head & Shoulder in making Tanla Platforms is forming a inverted head and Shoulder pattern right shoulder . On Friday last week , the stock is just around the neckline .
The Stock just started holding above 50 and 200 DMA.
RSI daily reading is above 70 indicating a positive momentum.
Need to be watchful in next week , i

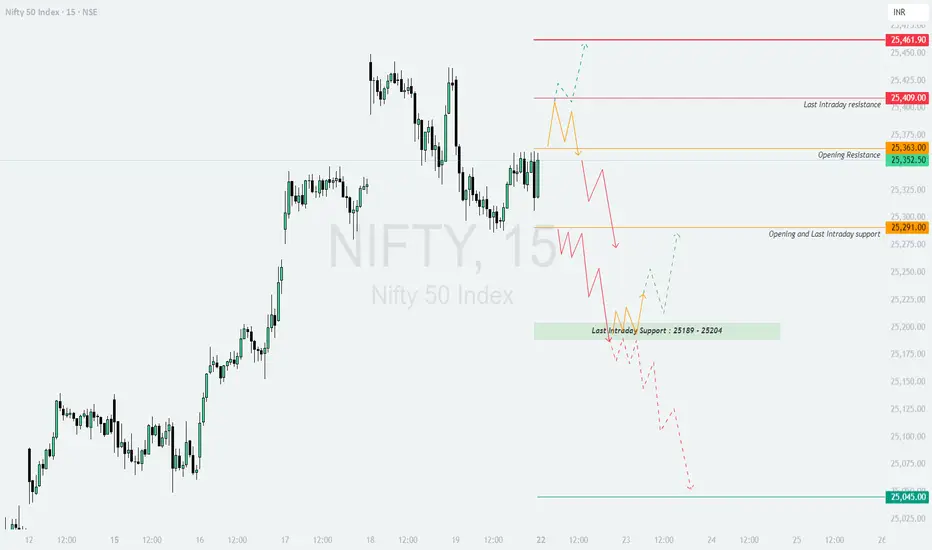
NIFTY : Trading levels and Plan for 22-Sep-2025NIFTY TRADING PLAN – 22-Sep-2025
The index closed around 25,352, with immediate opening resistance at 25,363, and higher hurdles near 25,409 (last intraday resistance) and 25,461. On the downside, supports are placed at 25,291 (opening/last intraday support) and the 25,189–25,204 zone. The critica
Positive moves on beaten down stock(Adani Green)Posititive news has come for the adani group from higher court. Adani Green is beaten down stock(may be not because of news flows but because of valuation). But now buying is there from the lower levels.
Valuations have come down in last 2-3 years(however still expensive valuation). But may be this

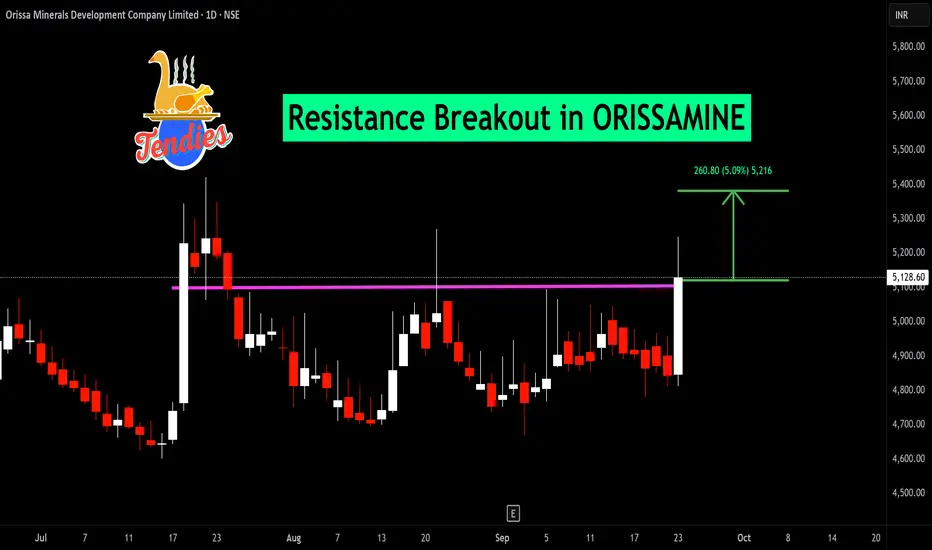
Sigachi’s Technical Surge: Next Resistance in SightOver the past month, Sigachi traded within a well-defined consolidation range, reflecting a period of equilibrium between buyers and sellers. However, in the most recent week, the stock decisively broke out above this consolidation zone on increased trading volume a classic signal of renewed bulli

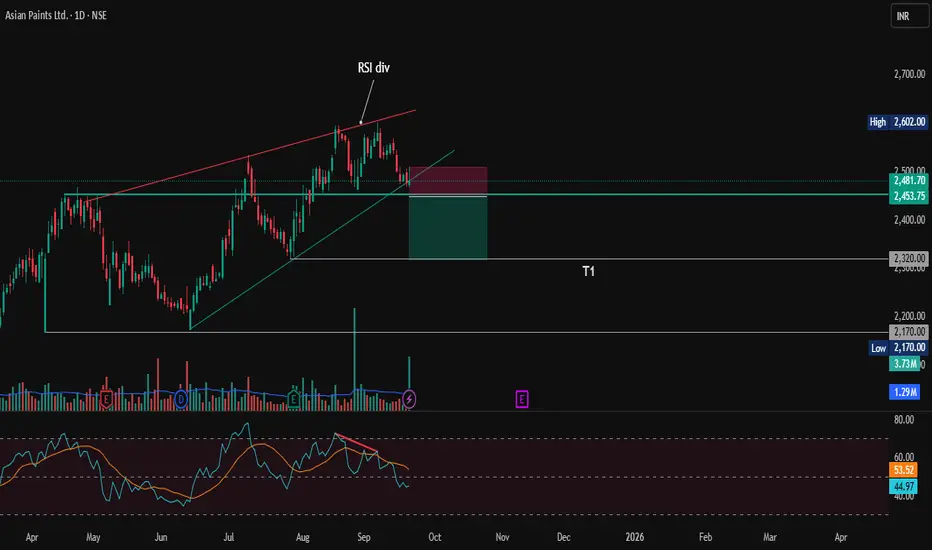
Asian Paints: Short Setup — Bearish Reversal SignalAsian Paints shows signs of a potential short opportunity after forming a bearish reversal pattern (Rising wedge) on the daily chart. The stock failed to sustain above the resistance near 2600, Formed a Double top pattern. The RSI is showing bearish divergence, signaling weakening momentum. hinting
Market Cycles I have made efforts in Explaining How Markets work in cyclical basis
once The bull Run completes , Market ideally enters in Price & Time Corrections
which enter in one of two know phases
01) Deep Price Corrections
02) Bracketed Market Price corrections
This is education content if you have

JSWSTEEL TRENDLINE BREAKOUTJSWsteel breaking trendline resistance weekly basis
good volume last few weeks
bullish RSI above 60
trading at al time high
can reach to target 1250 soon
NO BUY/SELL RECOMENDATION

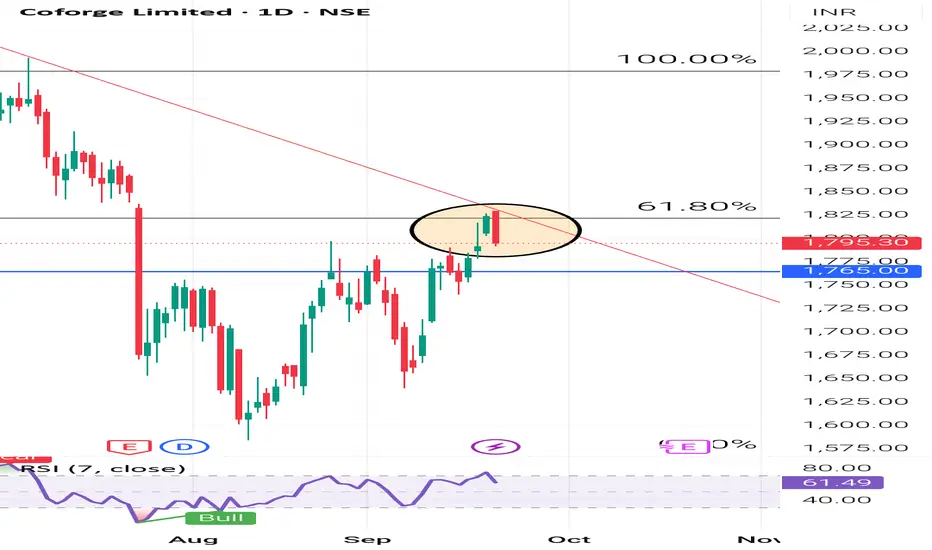
COFORGE LIMITED ( 1D ) 🔑 KEY LEVELS 🔑
✔ Fibonacci Retracement 61.80%
✔ Trend Line Act As Resistance.
✔ RSI Also Overbought Zone.
🎯 TRADING PLAN 🎯
✔ Near the key levels , Bearish Engulfing
Candlestick Pattern has formed.
✔ The Entry Point is Below @ 1792.10
✔ The Stopl
See all editors' picks ideas
FiniteStateMachine🟩 OVERVIEW
A flexible framework for creating, testing and implementing a Finite State Machine (FSM) in your script. FSMs use rules to control how states change in response to events.
This is the first Finite State Machine library on TradingView and it's quite a different way to think about your

Trading Activity Index (Zeiierman)█ Overview
Trading Activity Index (Zeiierman) is a volume-based market activity meter that transforms dollar-volume into a smooth, normalized “activity index.”
It highlights when market participation is unusually low or high with a dynamic color gradient:
Light Blue → Low Activity (thin p

Expected Value Monte CarloI created this indicator after noticing that there was no Expected Value indicator here on TradingView.
The EVMC provides statistical Expected Value to what might happen in the future regarding the asset you are analyzing.
It uses 2 quantitative methods:
Historical Backtest to ground your anal

Bar Index & TimeLibrary to convert a bar index to a timestamp and vice versa.
Utilizes runtime memory to store the 𝚝𝚒𝚖𝚎 and 𝚝𝚒𝚖𝚎_𝚌𝚕𝚘𝚜𝚎 values of every bar on the chart (and optional future bars), with the ability of storing additional custom values for every chart bar.
█ PREFACE
This library aims to tackle s

Liquidity Void Detector (Zeiierman)█ Overview
Liquidity Void Detector (Zeiierman) is an oscillator highlighting inefficient price displacements under low participation. It measures the most recent price move (standardized return) and amplifies it only when volume is below its own trend.
Positive readings ⇒ strong up-move

DeltaFlow Volume Profile [BigBeluga]🔵 OVERVIEW
The DeltaFlow Volume Profile builds a compact volume profile next to price and enriches every bin with flow context : bullish vs. bearish participation (%), a per-bin Delta % , an optional Delta Heat Map , and a PoC band with the bin’s absolute volume. This lets you see not just

Volume by Time [LuxAlgo]The Volume by Time indicator collects volume data for every point in time over the day and displays the average volume of the specific dataset collected at each respective bar.
The indicator overlays the current volume and the historical average to allow for better comparisons.
🔶 USAGE
Thr

FlowScope [Hapharmonic]FlowScope: Uncover the Market's True Intent 🔬
Ever wished you could look inside the candles and see where the real action is happening? FlowScope is your microscope for the market's flow, designed to give you a powerful edge by revealing the volume distribution that price action alone can't sh

VWAP Price ChannelVWAP Price Channel cuts the crust off of a traditional price channel (Donchian Channel) by anchoring VWAPs at the highs and lows. By doing this, the flat levels, characteristic of traditional Donchian Channels, are no more!
Author's Note: This indicator is formed with no inherent use, and serves

Fibonacci Sequence Circles [BigBeluga]🔵 Overview
The Fibonacci Sequence Circles is a unique and visually intuitive indicator designed for the TradingView platform. It combines the principles of the Fibonacci sequence with geometric circles to help traders identify potential support and resistance levels, as well as price expansio

See all indicators and strategies
Community trends
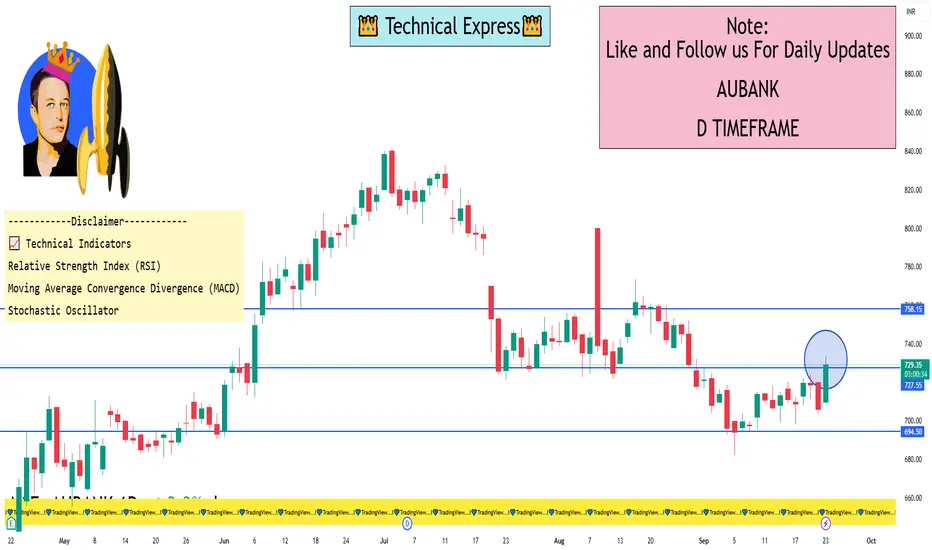
AUBANK 1 Day View📊 Intraday Technical Levels (1-Day Time Frame)
Based on pivot point analysis and Fibonacci retracements, here are the key support and resistance levels for today:
🔹 Standard Pivot Points
Support Levels: S1: ₹709.93, S2: ₹693.88, S3: ₹683.92
Resistance Levels: R1: ₹725.98, R2: ₹732.07
🔹 Camarill
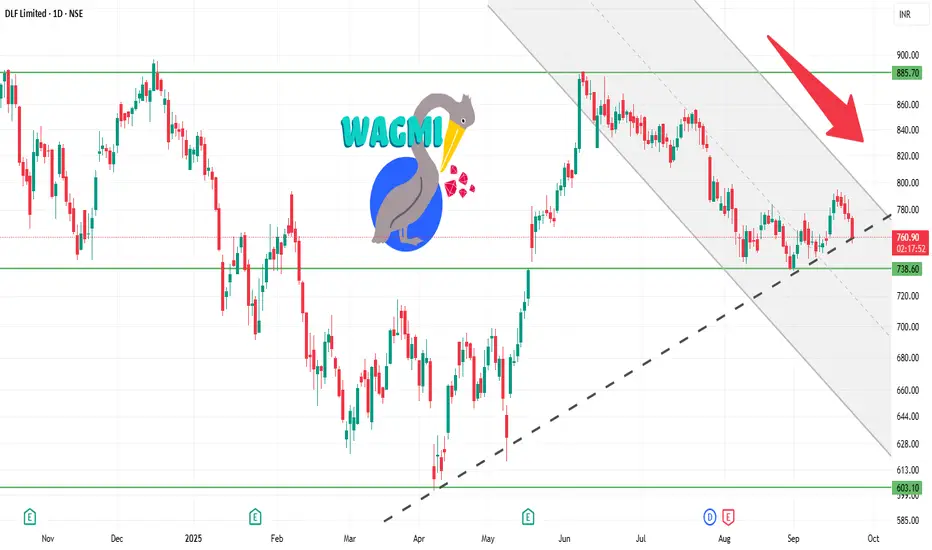
DLF 1D Time frame📍 Today’s Expected Range (Intraday Approximation)
Expected High: ₹767–₹775
Expected Low: ₹756–₹750
These are approximate intraday levels. Actual prices may fluctuate slightly due to market volatility.
🔍 Key Points
Current price: ₹760–₹761, trading near the middle of the day’s range.
If price b
Canara Bank (CANBK)Breakout above ₹119.50 with strong volume confirms momentum.
Entry Zone: Near breakout (₹119.50–122)
Stoploss: ATR-based, just below breakout (~₹116)
Targets: ₹129.40 → ₹136.40 (Fib extension)
Macro Drivers:
Hopes of RBI rate cuts after Fed dovish stance
Stronger economic data supporting fina

Short term swing on Jyoti CNCWith the earnings flattening out , EPS seems to have bottomed out and recent CEO statements clearly indicate strong order book and positive cash flow in Q3 leading upto Q4.
Along with these fundamental view , it formed a base between 878 - 924 range. Entererd the trade on breakout and pull back in

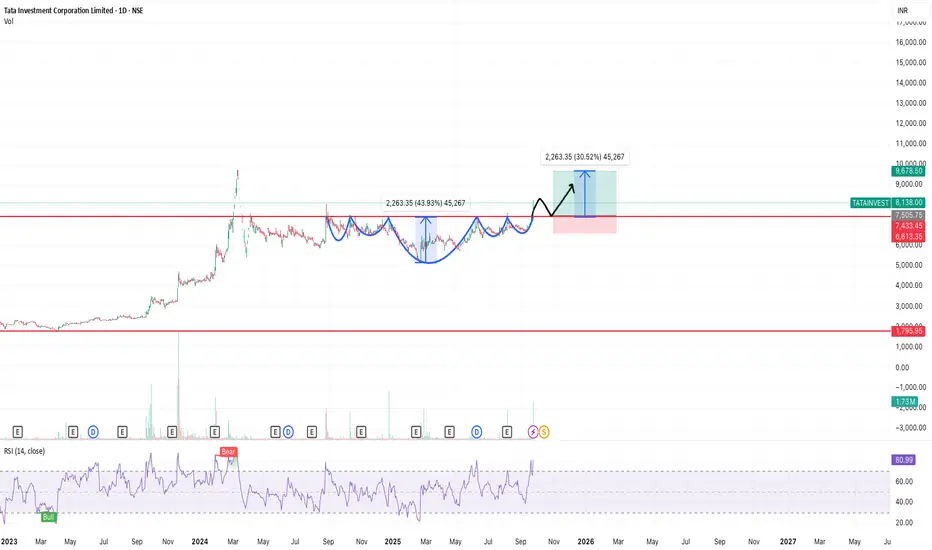
Tata Investment Corporation : Inverted Head & Shoulder(breakout)Tata Investment Corporation is forming a inverted head and Shoulder pattern right shoulder . On Friday last week , the stock is just around the neckline .
The Stock just gave breakout on daily, weekly and monthly candles and can be bought on retest
RSI daily reading is above 70 indicating a positi
BUY TODAY SELL TOMORROW for 5%DON’T HAVE TIME TO MANAGE YOUR TRADES?
- Take BTST trades at 3:25 pm every day
- Try to exit by taking 4-7% profit of each trade
- SL can also be maintained as closing below the low of the breakout candle
Now, why do I prefer BTST over swing trades? The primary reason is that I have observed that
ITC Limited Weekly Chart – Wave Y Targets Support ClusterITC has been trending lower since the ₹498.85 peak, carving out what appears to be a complex W-X-Y correction. The first leg (W) found support near ₹391.20, followed by a corrective bounce into X at ₹444.20. The decline since then has kept price under a descending trendline, respecting the larger co
Asian Paints: Short Setup — Bearish Reversal SignalAsian Paints shows signs of a potential short opportunity after forming a bearish reversal pattern (Rising wedge) on the daily chart. The stock failed to sustain above the resistance near 2600, Formed a Double top pattern. The RSI is showing bearish divergence, signaling weakening momentum. hinting
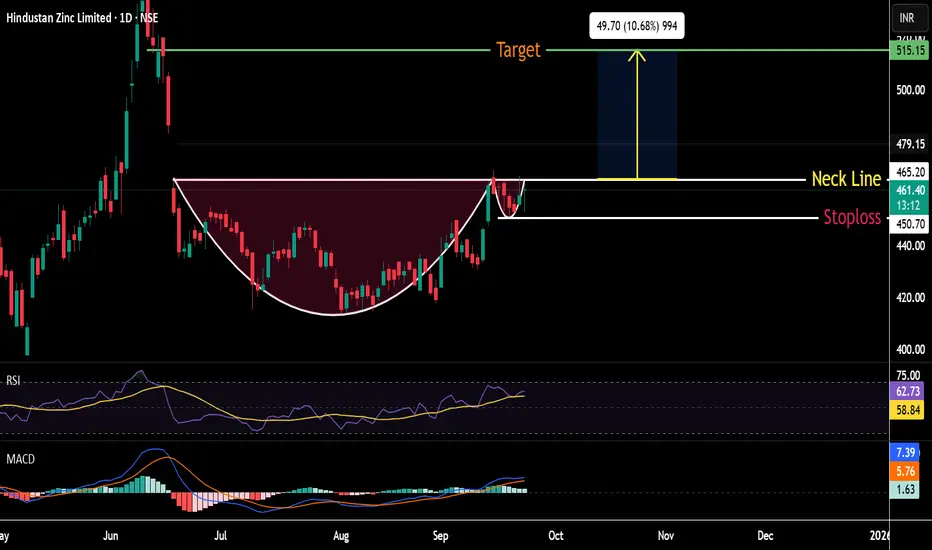
Cup & Handle Pattern formation in Hindustan ZincHindustan Zinc formed Cup & Handle Pattern on Daily Chart ,Stock is Trading above all important moving averages(20,50,100,200) & MACD & RSI also indicating positive momentum.
Breakout of it will happen above 465 level & Target will be 515 Rs ,with a stoploss of 450Rs.
its not a buy or sell call ..Fo
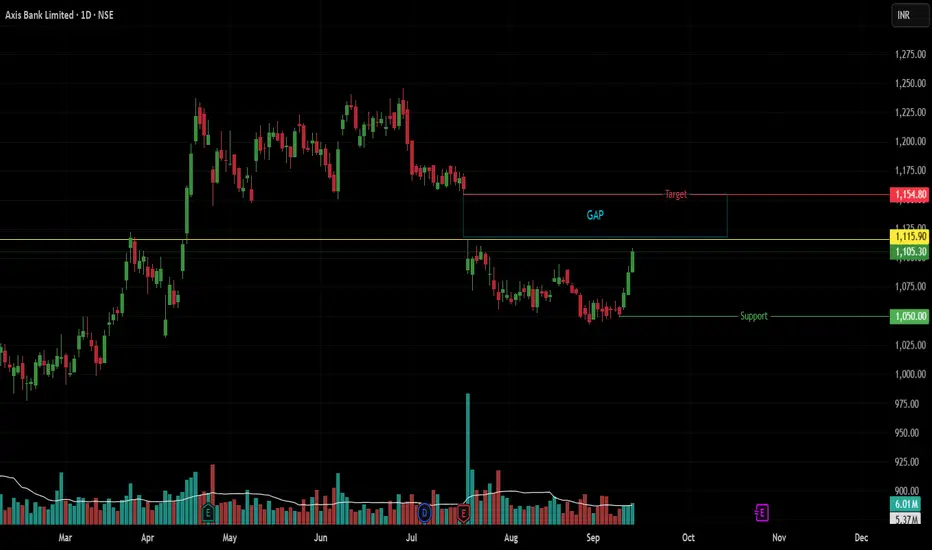
AXISBANK at ₹1115: Breakout or Rejection?Scrip: Axis Bank | Exchange: NSE | Timeframe: Daily
Summary:
Price is approaching a significant resistance level at ₹1115, which was the high of the July 18th gap-down session. A high-volume breakout above this level could trigger a move to fill the gap up to ₹1154. Conversely, a rejection at this
See all stocks ideas
No scheduled reports
Community trends
BTCUSDT – Possible Bounce Back Zone Ahead?Title:
🚀 BTCUSDT – Possible Bounce Back Zone Ahead?
Description / Note:
Bitcoin is at a decisive point. If price loses the Bull Market Support Band, the next key area of interest may be the 50-week SMA, currently lining up near the $100K region.
Why it matters:
📌 The 50-week SMA has been a reliable

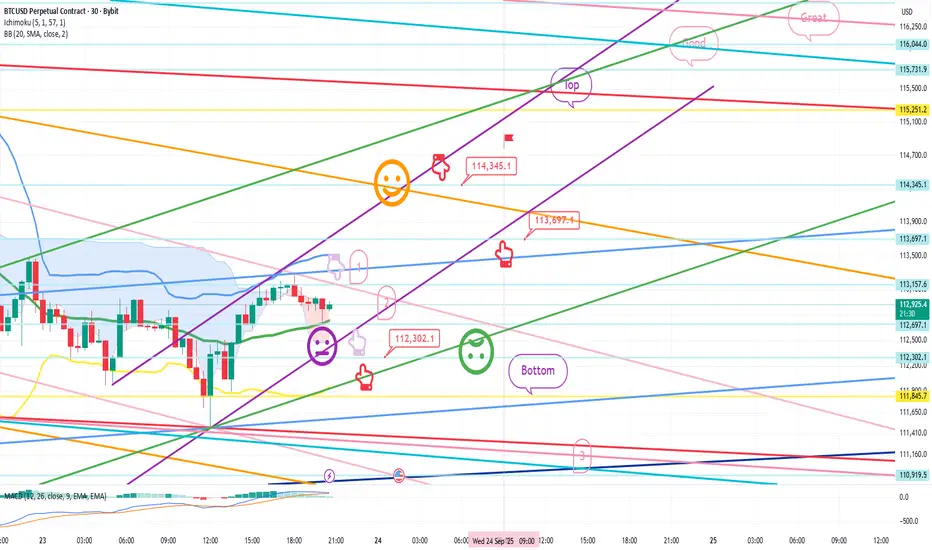
Bitcoin Bybit chart analysis September 23Hello
It's a Bitcoin Guide.
If you "follow"
You can receive real-time movement paths and comment notifications on major sections.
If my analysis was helpful,
Please click the booster button at the bottom.
This is Bitcoin's 30-minute chart.
There's an indicator release near 11:00 AM on the Nasd
BTC Neowave UpdateBTC Intraday Update
Our entry 1 is activated yesterday, so maintain that with stoploss
2nd entry will be created when.....s1 will complete by breaking up of black cycles
Short Term Trend
Learn More about trend here

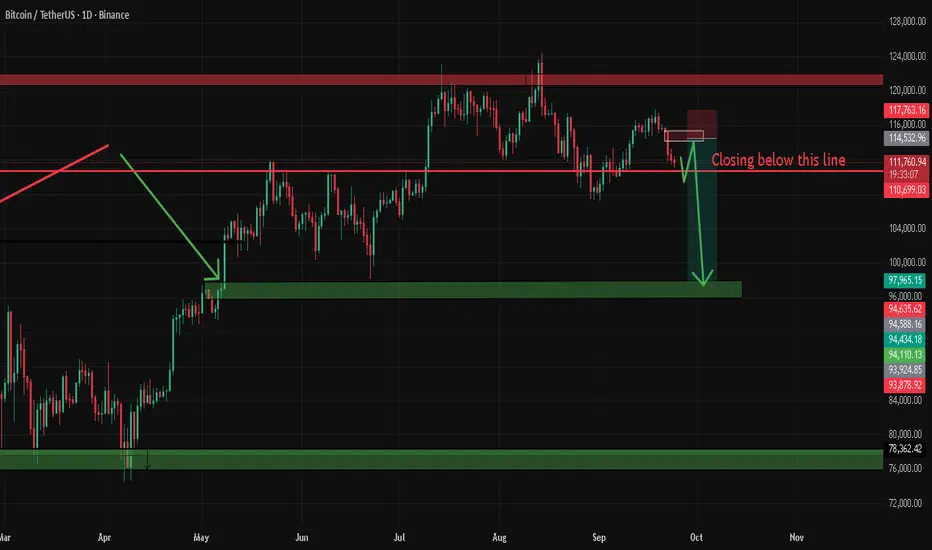
btc short entry waiting for closing as you can clearly see why i have marked demand and supply and pretty sure for a short trade once it closed below that red line
BTC LONG on small time frame Trade or observation can be placed as per given details
My strategy is working 90% of time, I have backtasted it many times
,I am sure I will crack this target without hunting sl

Bitcoin’s Correction Puzzle: Wedge Break, Macro Shifts!!Bitcoin has entered a fascinating phase after breaking down from its rising wedge formation, leaving the market in a medium-term correction cycle. Current price action around 113000 is trying to stabilize, but the structure suggests this zone is fragile. If bulls cannot reclaim and hold above the in

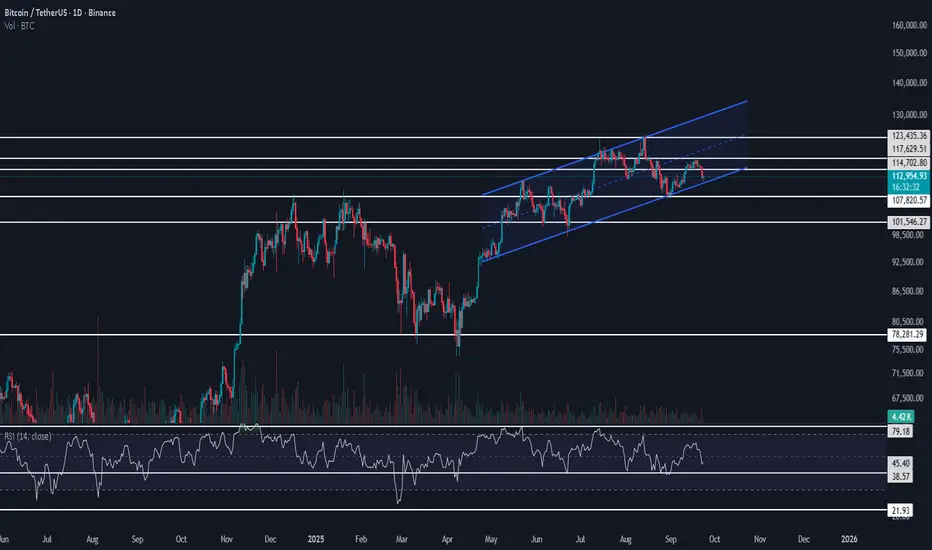
BTCUSDT Technical AnalysisBitcoin is currently moving inside a bullish ascending channel, which is aligned with its previous upward momentum. If the upper boundary of the channel breaks, we can consider this structure as a bullish flag breakout, signaling continuation to the upside.
The High Wave Cycle (HWC) trend remains b
CRYPTO ALERT: SOLANA SHORT TERM BEARISH TREND IN 4H CHARTSOLANA, one of the most traded crypto after BTC and ETH is in a short term bearish trend on the 4H chart. It has multiple demand zones and unmitigated order blocks pending for execution before any further upward movement.
SOLUSD can be shorted at CMP 236 with Stop Loss at 244 for short term targets

ETH BIG HAMMERAfter good correction ETH has made a hammer at the previous liquidity zone (Support).
One can look for Buy on dip from here on in ETH.
SL- 4070
Target- 4300, 4370, 4400
Disclaimer- This is just for Education Purpose.
Follow for mor such content and learnings.
Jai Shree Ram.

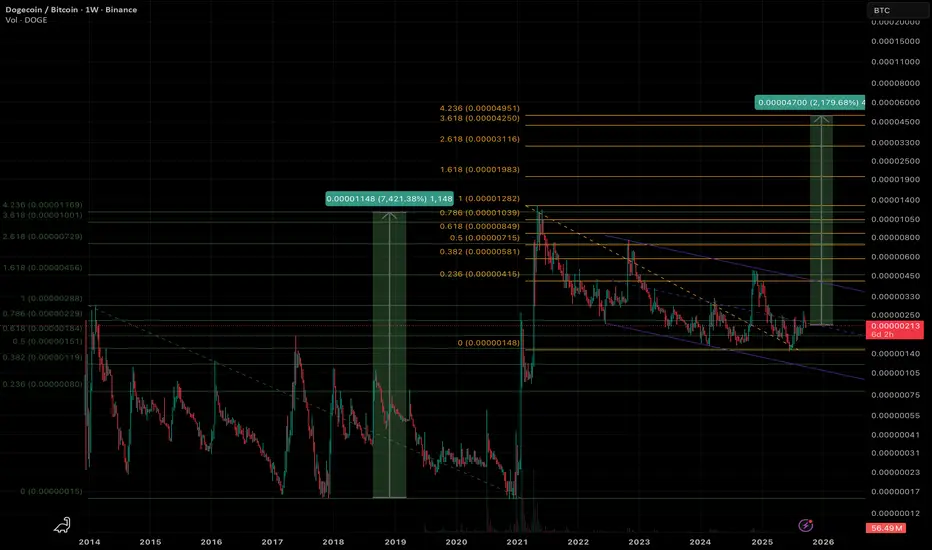
DOGEBTCDOGEBTC ticker wrt Fibonacci Retracement Levels - aligned perfectly in the past bull run. I have marked new levels here…. Let’s wait and watch. Near 2000% upwards potentially if the replication happens.
Cycle mimetics may recur if bull momentum continues. Marked are levels for profit taking - S/R z
See all crypto ideas
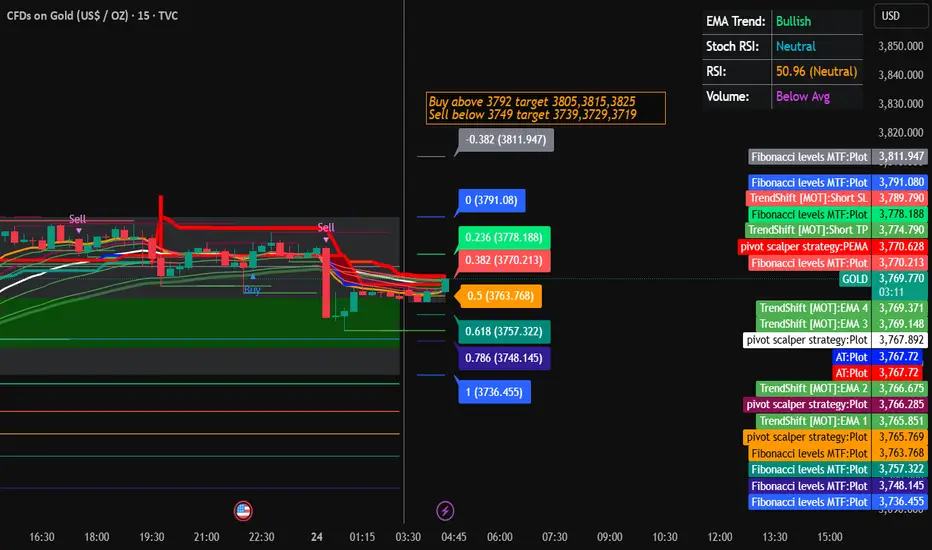
Gold Trading Strategy for 24th September 2025 (IST 0445 AM)📊 GOLD TRADING SETUP (XAU/USD)
✨ Buy Setup
🔼 Entry: Buy above the high of 1-hour candle close above 3792
🎯 Targets:
🥇 3805
🥈 3815
🥉 3825
🛡️ Stop Loss (SL): Place SL a few points below 3792 (manage according to risk appetite).
⚡ Sell Setup
🔽 Entry: Sell below the low of 15-min candle close below 37
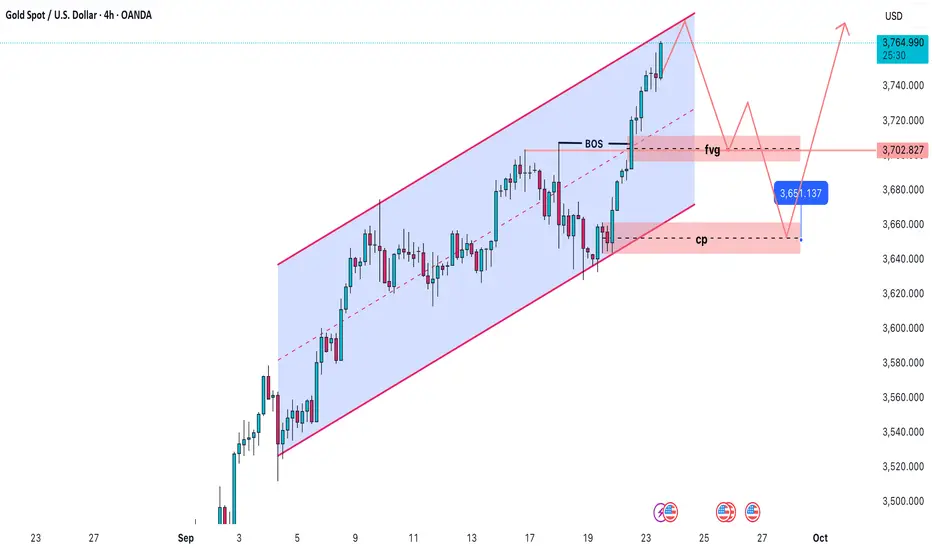
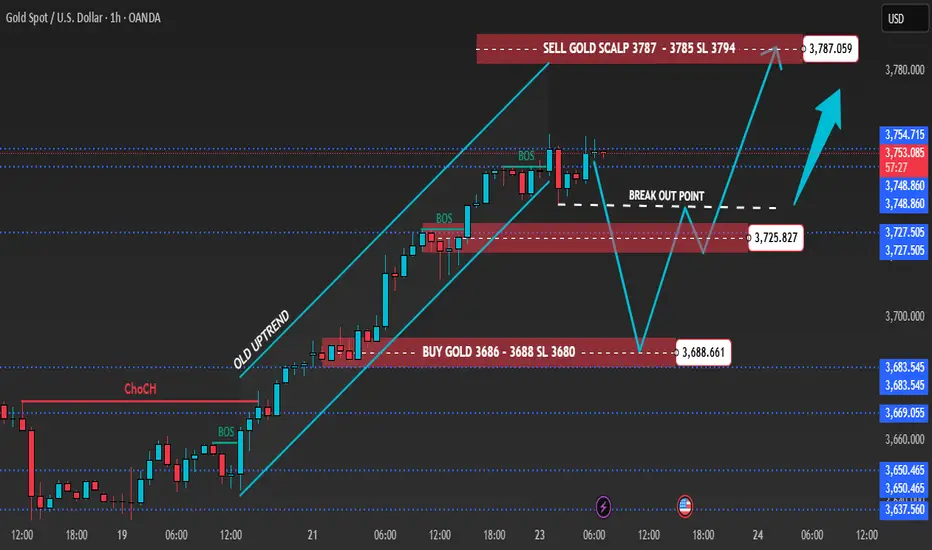
GOLD TREND 23/09 SIMPLE ANALYSIS1. Market Context
Price is currently moving within an ascending channel.
A recent BOS (Break of Structure) indicates that buyers are still in control.
There is an untested FVG (Fair Value Gap) and CP (Demand Zone) below.
2. Key Levels
Immediate resistance: around 3,758 – 3,760 USD.
FVG zone: 3
Silver’s Bullish Cycle: Zones to Buy, Levels to Aim ! Silver is running one of its strongest bullish phases in recent years, having broken through key ranges and now holding around the mid-43s with momentum still intact. The structure shows that 42.7 is the immediate support staying above this level keeps short-term bulls in control. Once pressure mou

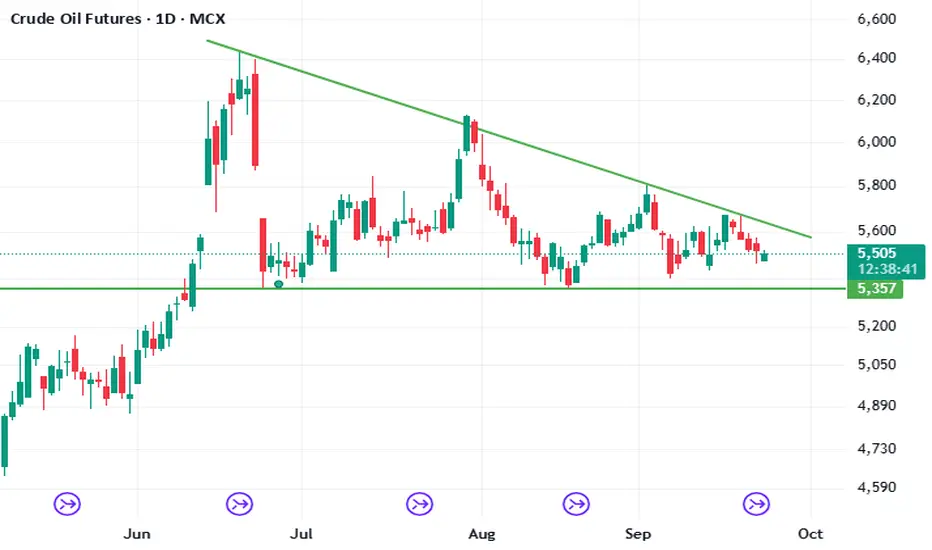
BIG MOVECrude Oil
Look at crude oil daily chart. Big move will come, either bullish or bearish. Observe two trend lines.
I am not SEBI Registered
This is my view Only.
gold spot today will down close as per chart petterngold today will close down from friday closing . as per chart pettern
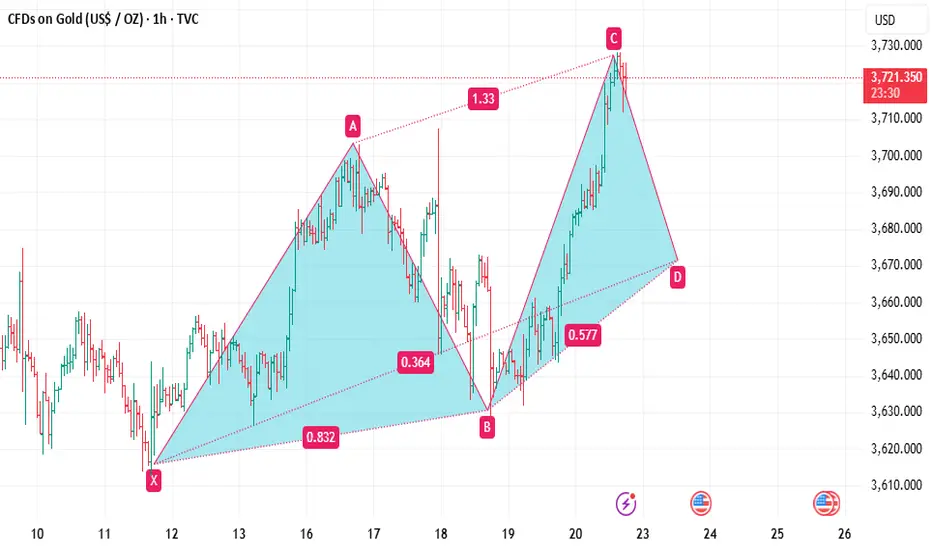
XAUUSD 09/24 – Scenario after the Fed's Key SpeechHello everyone,
Gold continues its upward momentum in recent sessions. Yesterday, the price touched the 1.618 Fibonacci level on the H4 chart and then declined, indicating a slight rejection right after the PMI news.
Technical Perspective
The Wolfe Waves structure remains intact, not yet broken.

Gold Sets New Record: Rate Hopes Driving Price HigherHello, traders!
Gold surged to a record high of $3,726.19/oz on September 22, fuelled by growing investor expectations for a clearer Fed rate-cutting path. Traders are now betting on two more rate cuts this year with a very high probability.
The growth drivers have shifted from being primarily cen

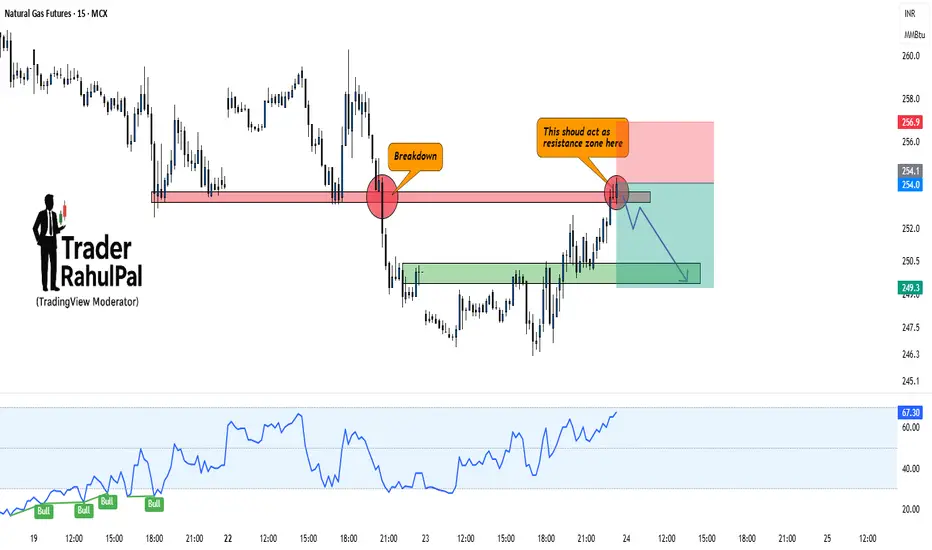
Natural Gas – Breakdown Retest Could Trigger Fresh FallHello everyone, Let's analyse Natural Gas and it has recently broken down from a key support level, turning it into resistance. The price is now retesting that zone, and unless bulls manage to reclaim it strongly, the downside remains the higher probability.
Current Setup:
Previous support arou
Gold 1H – Inflation Worries & Risk Sentiment Guide MovesGold on the 1H chart is hovering near 3,753 after multiple BOS confirmations, holding a firm bullish bias yet approaching premium resistance. Liquidity sits above 3,787–3,785, while fresh demand zones are placed at 3,725–3,723 and deeper at 3,688–3,686.
Today’s narrative around sticky U.S. inflation
GoldDaily bias Bullish
4H structure Look's good for buys
have a clean 15M BFVG
and entry pattern is 15M englufying candle

See all futures ideas
USDJPY Becoming BearishFX:USDJPY
Namaskaram Everyone
Price is currently at very good structure and price to sell
If stop loss is big for you, than dont trade. Mean do not take more than 1 percent, on my charts. If you really wants to grow your capital.
I think price will easily go towards the febnachi .61 and f

Good palce to shot Here lower liquidity swept with CHOCH as changed market shift , Current Order Block good Inducemnent, Good go for Shot

AUDNZD Trading Idea – Momentum & Liquidity OutlookThe pair has been in a clear expansion phase, showing strength after multiple structure breaks. Momentum has favored the upside, while recent consolidation reflects market participants taking profits and rebalancing orders.
A corrective wave appears to be unfolding, which is typical after strong im

UsdJpy Bullish / LONG### USDJPY Wyckoff Accumulation Trade Idea
**Market Perspective:**
Recent price activity in USDJPY exhibits a Wyckoff accumulation pattern on the 15-minute chart, suggesting that smart money is absorbing liquidity ahead of a potential markup phase. Accumulation is confirmed by a high-volume rejec

EURUSD MULTI TIME FRAME ANALYSISHello traders , here is the full multi time frame analysis for this stock , let me know in the comment section below if you have any questions , the position will be taken only if all rules of the strategies will be satisfied. wait for more price action to develop before taking any position. I sugge

You going to lossI need daily candle close on the black Box.. then I am looking for sell if I get my entry signals

EURUSD BUY PLANPair: EURUSD
Current Price: 1.17415
🔹 Market Context
Price is currently reacting at a very important Order Block (OB) zone.
Daily trend is bullish and aligns with the 4H structure, adding confluence for upside continuation.
Market is showing good upside momentum from this level.
🔹 Trade Idea
Buy Bia

CAN WE - $EUROLooking for a small reversal during UK session to take out the Monday High a short term bullish and long term bearish on MIL:EURO

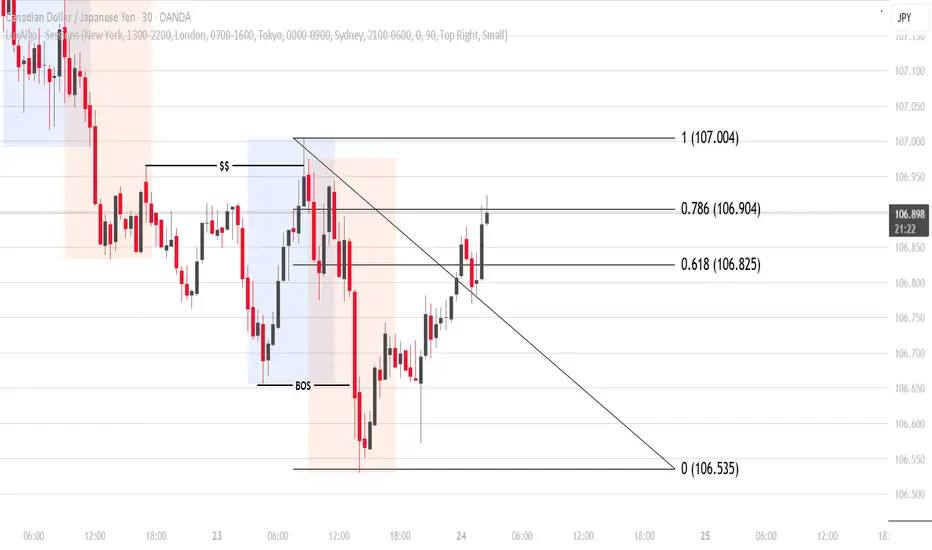
cadjpy shortTo break down a CAD/JPY short trade, here's how you can approach it — including technical, fundamental, and trade setup details:
long viewweekly market structure is positive an currently daily tf is also +ve
if s=daily turns negative , ihave marked some important support areas bases on ema ns fibonacci.

See all forex ideas
| - | - | - | - | - | - | - | - | ||
| - | - | - | - | - | - | - | - | ||
| - | - | - | - | - | - | - | - | ||
| - | - | - | - | - | - | - | - | ||
| - | - | - | - | - | - | - | - | ||
| - | - | - | - | - | - | - | - | ||
| - | - | - | - | - | - | - | - | ||
| - | - | - | - | - | - | - | - | ||
| - | - | - | - | - | - | - | - |
Trade directly on the supercharts through our supported, fully-verified and user-reviewed brokers.


