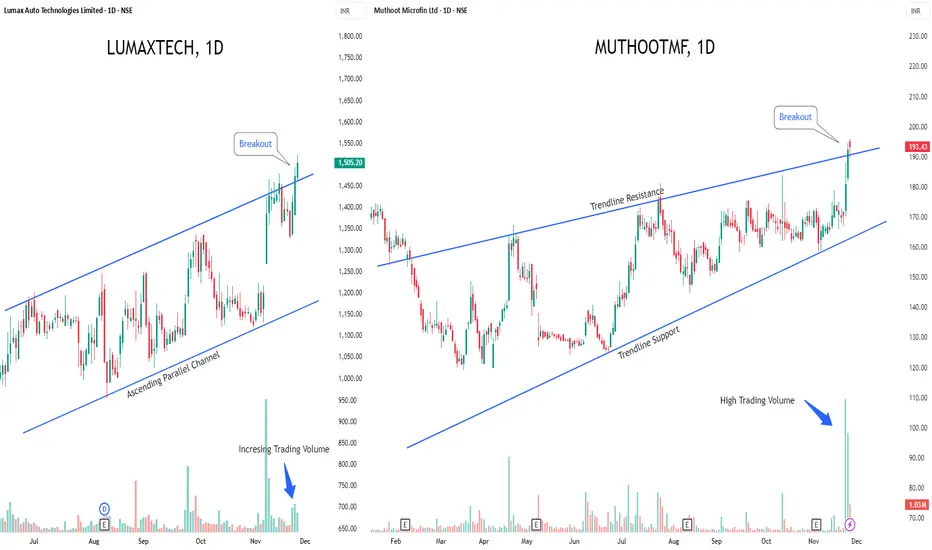
LUMAXTECH & MUTHOOTMF - Breakout Stocks to Watch This Week!1️⃣ Lumax Auto Technologies NSE:LUMAXTECH — Fresh Breakout Alert
Lumax is riding a strong uptrend and has cleanly broken above the upper boundary of its ascending parallel channel.
If this breakout sustains, the stock could see a sharp upside rally ahead.
Rising volumes are confirming strong

Black Friday
The greatest deal of the year is here.Get it before the point of no return.
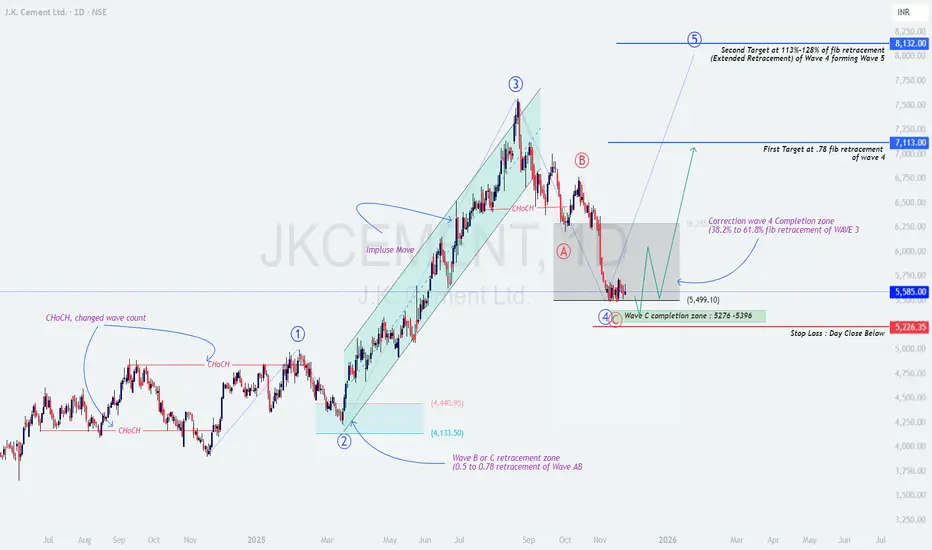
JKCEMENT at Demand Zone – Is Wave 5 About to Start?⚡ JK CEMENT – Wave 4 Correction Completing | Wave 5 Blast Loading?
🧠 Overall Market Structure
JK Cement is showing a textbook Elliott Wave progression, and price has now entered the crucial Wave 4 → Wave C completion zone (₹5276–₹5396).
This zone aligns with 38.2% to 61.8% retracement of Wave 3
Falling Wedge Pattern (Bullish Setup) | Re-Opportunityit did give an opportunity last week, then fell, and is again at an opportunity zone now.
RSI Analysis
Your RSI shows:
RSI near 37–38
This is close to oversold, which is usually where reversals happen
Earlier, RSI bounced from similar levels
➡️ Supports a bounce possibility.
MACD Analysis
MACD is
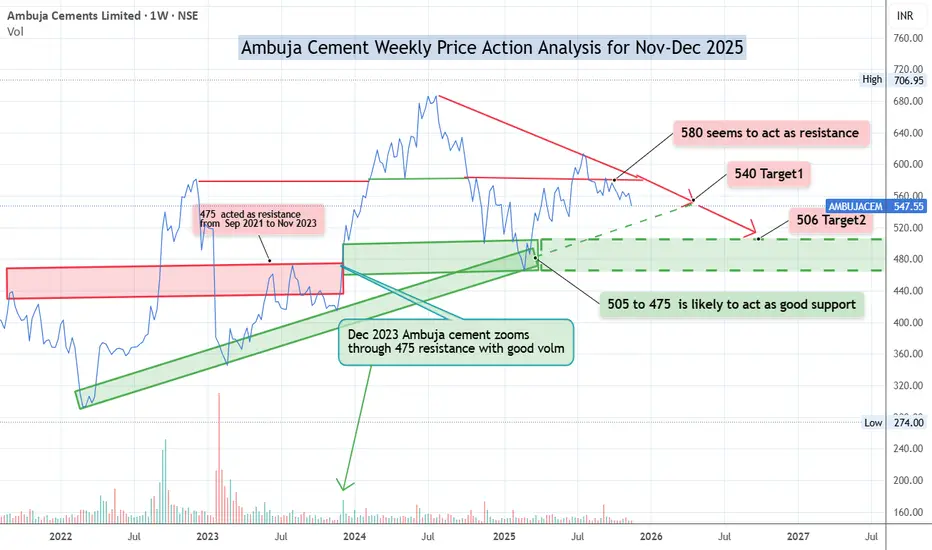
Ambuja Cement Weekly Price Action Analysis for Nov-Dec 2025On Weekly chart Ambuja Cement has closed at 547 on 20-Nov-25
Recent price action indicates the stock is struggling to go past 575-580 area.
It is likely to continue going down till its support major region of 505-475.
One can sell/short sell whenever the stock comes near 570 region. Keeping SL of 5
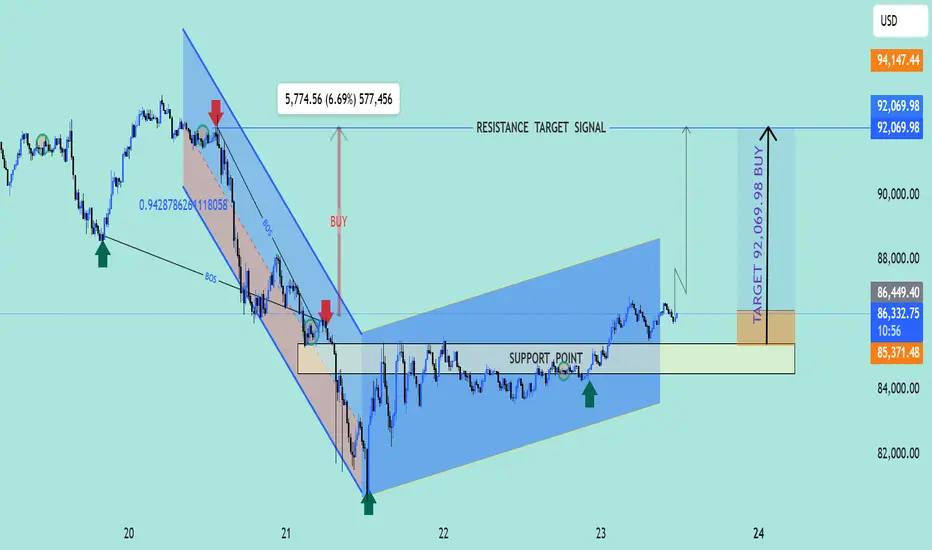
4. Price Action Analysis with Target at 92K1. Market Structure
The chart shows that the market was previously in a downtrend, but price has now created a bullish structure shift.
This shift is confirmed by a Break of Structure (BOS) to the upside, meaning buyers have taken control.
---
2. Support Zone
Price reacted strongly from the sup
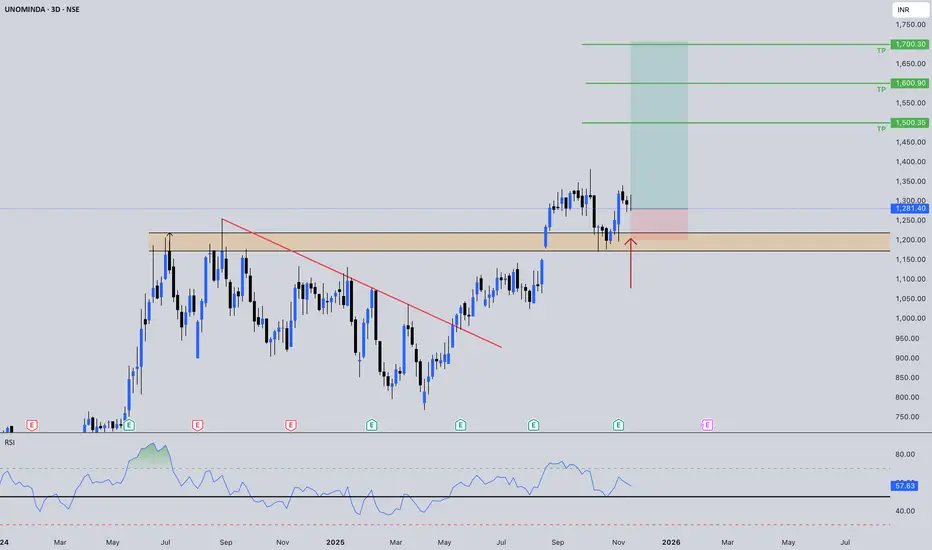
UNOMINDA: Post-Breakout Retest - Setting Up For Wave 2
Price shows a text-book breakout and retest of a multi-month consolidation high, signaling a potential acceleration phase in the Auto Components space.
🔍 Technical Snapshot (3-Day Chart)
Metric: Breakout Zone
Value: ₹1,180–₹1,250
Interpretation: Critical horizontal resistance flipped to suppo
HDFCLifeHDFCLife has a very long consolidation and going up and down in the range.
Previous wave has a downfall and not it is started with uptrend. So some uptrend it has small correction and ready to move up side.
So, above 770 we can see upside movement till the 800-820.
So, as per technical it's good

Consolidation face ends? Anuras has been in some decent consolidation for last 6 months and has seen strong volumes in last 2-3 session. Post results season buying is intriguing since not much happened post call. Watch out for some action. Please note RSI is 76 so take position according to your appetite.

H&S pattern Bearish in SBICARDHead & Shoulders pattern finished in SBICARD.
On breakdown of trendline, will target the downside target equal to the range of head (from top of head to neckline)
Targets are mentioned, including key levels in between. Stop is above halfway of the right shoulder

INFOSYS MY TECHNICAL VIEWS 19-11-25After retest of support, multiple times, price ready to go up.
Nifty It and Infosys charts are almost identical..
Nifty is already in trend. VIX Normal. dollar index below 100. Good delivery. Everything look perfect. Anything missing?
Your views and suggestion are invited.

See all editors' picks ideas
Count█ OVERVIEW
A library of functions for counting the number of times (frequency) that elements occur in an array or matrix.
█ USAGE
Import the Count library.
import joebaus/count/1 as c
Create an array or matrix that is a `float`, `int`, `string`, or `bool` type to count elements from, t

Holographic Market Microstructure | AlphaNattHolographic Market Microstructure | AlphaNatt
A multidimensional, holographically-rendered framework designed to expose the invisible forces shaping every candle — liquidity voids, smart money footprints, order flow imbalances, and structural evolution — in real time.
---
📘 Overview
The Hol

PriceFormatLibrary for automatically converting price values to formatted strings
matching the same format that TradingView uses to display open/high/low/close prices on the chart.
█ OVERVIEW
This library is intended for Pine Coders who are authors of scripts that display numbers onto a user's charts. T

LogNormalLibrary "LogNormal"
A collection of functions used to model skewed distributions as log-normal.
Prices are commonly modeled using log-normal distributions (ie. Black-Scholes) because they exhibit multiplicative changes with long tails; skewed exponential growth and high variance. This approach i

Range Oscillator (Zeiierman)█ Overview
Range Oscillator (Zeiierman) is a dynamic market oscillator designed to visualize how far the price is trading relative to its equilibrium range. Instead of relying on traditional overbought/oversold thresholds, it uses adaptive range detection and heatmap coloring to reveal where pri

Volume Surprise [LuxAlgo]The Volume Surprise tool displays the trading volume alongside the expected volume at that time, allowing users to spot unexpected trading activity on the chart easily.
The tool includes an extrapolation of the estimated volume for future periods, allowing forecasting future trading activity.
🔶 U

Smooth Theil-SenI wanted to build a Theil-Sen estimator that could run on more than one bar and produce smoother output than the standard implementation. Theil-Sen regression is a non-parametric method that calculates the median slope between all pairs of points in your dataset, which makes it extremely robust to o

Fair Value Gaps by DGTFair Value Gaps
A refined, multi-timeframe Fair Value Gap (FVG) detection tool that brings institutional imbalance zones to life directly on your chart.
Designed for precision, it visualizes how price delivers into inefficiencies across chart, higher, and lower (intrabar) timeframes — offering a fl

TASC 2025.11 The Points and Line Chart█ OVERVIEW
This script implements the Points and Line Chart described by Mohamed Ashraf Mahfouz and Mohamed Meregy in the November 2025 edition of the TASC Traders' Tips , "Efficient Display of Irregular Time Series”. This novel chart type interprets regular time series chart data to create an ir

Simplified Percentile ClusteringSimplified Percentile Clustering (SPC) is a clustering system for trend regime analysis.
Instead of relying on heavy iterative algorithms such as k-means, SPC takes a deterministic approach: it uses percentiles and running averages to form cluster centers directly from the data, producing smoo

See all indicators and strategies
Community trends
LUMAXTECH & MUTHOOTMF - Breakout Stocks to Watch This Week!1️⃣ Lumax Auto Technologies NSE:LUMAXTECH — Fresh Breakout Alert
Lumax is riding a strong uptrend and has cleanly broken above the upper boundary of its ascending parallel channel.
If this breakout sustains, the stock could see a sharp upside rally ahead.
Rising volumes are confirming strong
Bearish Engulfing Candle: BAJAJ_AUTOToday's low is the support, i.e., 8996, which, if breached, will trigger the bearish engulfing candle.
The reason for publishing a video idea instead of a simple chart idea is to show you an interesting setting in the parallel channel of TradingView, in case you don't know about it.
Target range do

COFORGE- BREAKOUT FROM FIBO ZONESwing analysis of COFORGE depicts clear breakout from fibonacci levels on weekly chart poised for perfect 1:2 Risk reward. Any retracement should be considered as an opportunity to buy. All our Stock ideas for positional and intraday trades are based on Fibo setups with consistent Risk Reward.

BUY TODAY SELL TOMORROW for 5%DON’T HAVE TIME TO MANAGE YOUR TRADES?
- Take BTST trades at 3:25 pm every day
- Try to exit by taking 4-7% profit of each trade
- SL can also be maintained as closing below the low of the breakout candle
Now, why do I prefer BTST over swing trades? The primary reason is that I have observed that

HIND ZINC: MAKING H/S PATTERNhind zinc is making h/s in weekly tf.. entry and target are given in chart

CenturyPly | Out of Triangle Consolidation?DISCLAIMER: This idea is NOT a trade recommendation but only my observation. Please take your trades based on your own analysis.
Points to consider:
----------------------
1. Stock has been consolidating in a triangle since Sept of last year
2. Relative Volume has dried up significantly prior to

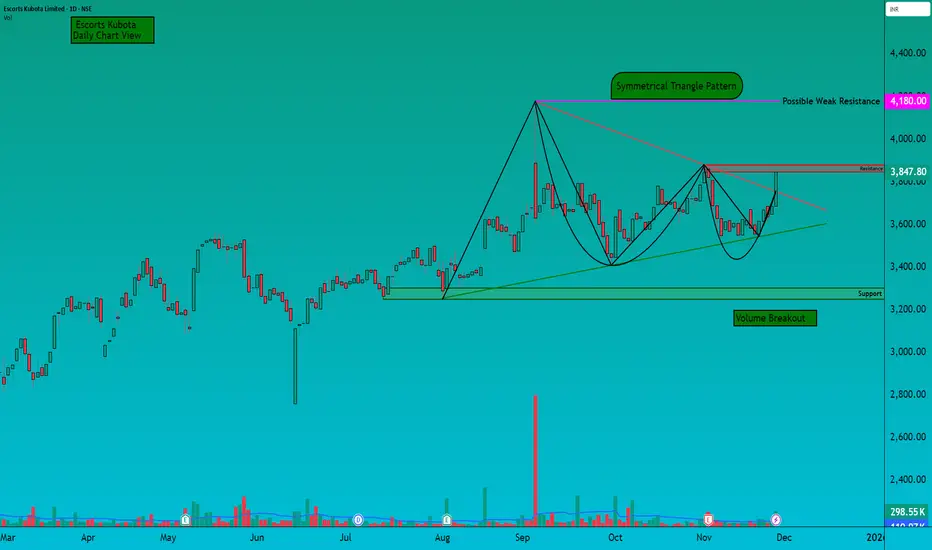
ESCORTS - Symmetrical Triangle Breakout Attempt
💹 Escorts Kubota Ltd (NSE: ESCORTS)
Sector: Machinery & Tractors | CMP: 3847.80 | View: Symmetrical Triangle Breakout Attempt
Chart Pattern: Symmetrical Triangle Pattern
Candlestick Pattern: Strong Bullish Momentum Candle
Swing High: 4180
Swing Low: 3250
STWP Trade Analysis:
Bullish Breakout Level
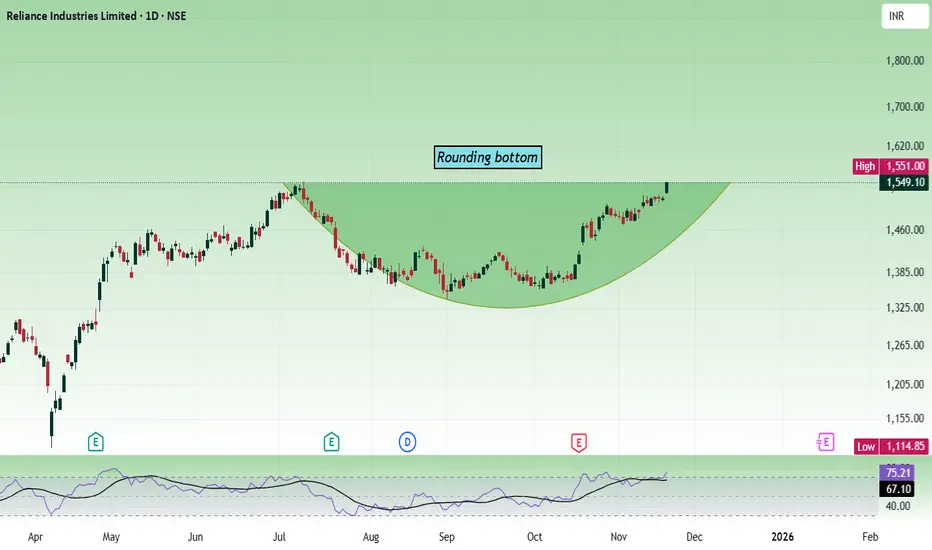
Reliance - Multi time frame analysis...We are going to see the daily and weekly charts. It's beautiful to see how the patterns are aligning.
The daily chart shows, the price has formed a rounding bottom, and right now it is testing the rounding bottom resistance/high.
The weekly chart shows, the price is nearing the cup and handle patter
Long Jsw HoldingsTechnical Overview – JSW Holdings Ltd (Weekly Chart)
The weekly chart of JSW Holdings Ltd indicates that the price is currently stabilizing around the 50-week EMA, suggesting the formation of a potential accumulation base. A classic bullish RSI divergence is observed, signalling weakening downside

How to approach any Trade like a PROI make educational content videos for swing / positional trading
Charts used in this video are 3 months older for experience sharing using Bar replay feature of Trading view .

See all stocks ideas
Today
S
SUDEEPPHRMSUDEEP PHARMA LIMITED
Exchange
BSE
Offer price
6.31 - 6.65
USD
Dec 3
F
FRMIMother Nutri Foods Limited
Exchange
BSE
Offer price
1.24 - 1.31
USD
Dec 5
T
TINLogiciel Solutions Ltd.
Exchange
BSE
Offer price
2.05 - 2.16
USD
Dec 5
C
CMPIPurple Wave Infocom Ltd.
Exchange
BSE
Offer price
1.35 - 1.42
USD
Dec 8
C
CHWYClear Secured Services Ltd.
Exchange
NSE
Offer price
1.40 - 1.48
USD
Dec 8
J
JOCMInvicta Diagnostic limited
Exchange
NSE
Offer price
0.90 - 0.95
USD
Dec 9
T
TPVNeochem Bio Solutions Ltd.
Exchange
NSE
Offer price
—
Dec 9
E
EMASHelloji Holidays Ltd.
Exchange
BSE
Offer price
1.23 - 1.32
USD
See more events
Community trends
FVG Retracement With EMA, RSI & Fib Confluence📈 Bitcoin Chart – FVG Retracement With EMA, RSI & Fib Confluence in a Bearish Market Structure
This chart showcases a sustained bearish sequence on BTC, defined by a clean continuation of Lower Highs (LH) and Lower Lows (LL). Throughout this decline, multiple Fair Value Gaps (FVGs) have formed bo

[SeoVereign] BITCOIN BEARISH Outlook – November 27, 2025I’m sharing a Bitcoin downside idea as of November 27.
Bitcoin has recently seen a sharp decline, and it’s undeniable that this has gradually increased the possibility of a rebound.
However, when examining the current chart structure closely, the key conditions that, by my standards, would confirm

Is BTCUSD (Bitcoin) heading towards $91,000?Hello!
BTC has finally broken through its main downward trendline, signaling a shift in market sentiment after a prolonged period of selling pressure. Following this breakout, the price formed a clear inverse head and shoulders pattern, indicating that buyers have stepped in strongly after the fina

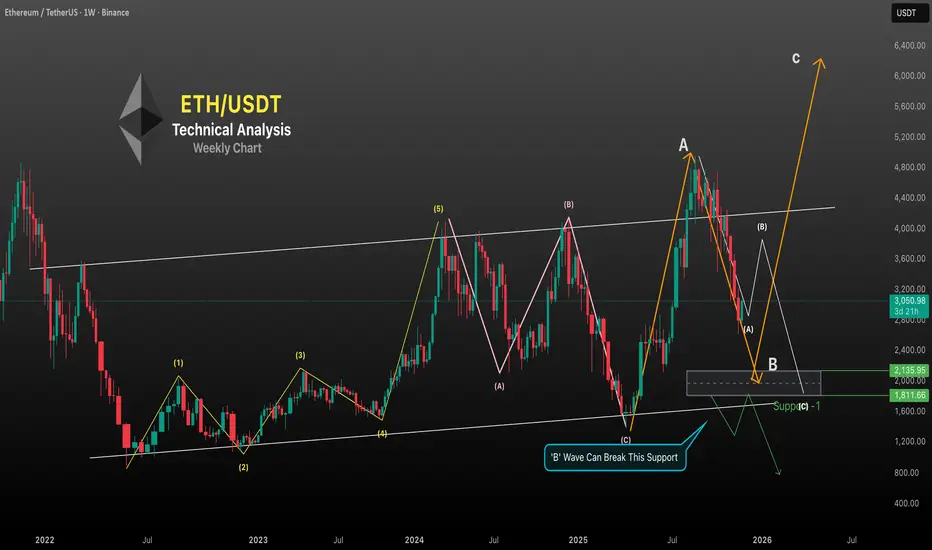
Ethereum – Elliott Wave Analysis (Weekly Chart)
#Phase 1:
Impulse Wave (1–5) Completed
ETH completed a 5-wave impulsive structure from the 2022 lows to the 2024 top:
Wave (1) – Initial reversal from the bear market bottom
Wave (2) – Deep corrective pullback
Wave (3) – Strong expansion wave (typically the largest, as shown here)
Wave (4) –
BTCUSD Analysis on (27/11/2025)BTCUSD UPDATEDE
Current price- 90850
If price stay above 85000,then next target 99000,106500 and below that 80000
Plan; if price break 90850-89700 area and above that 91500 area,we will place buy oder in BTCUSD with target of 99000,106500 & stop loss should be placed at 85000

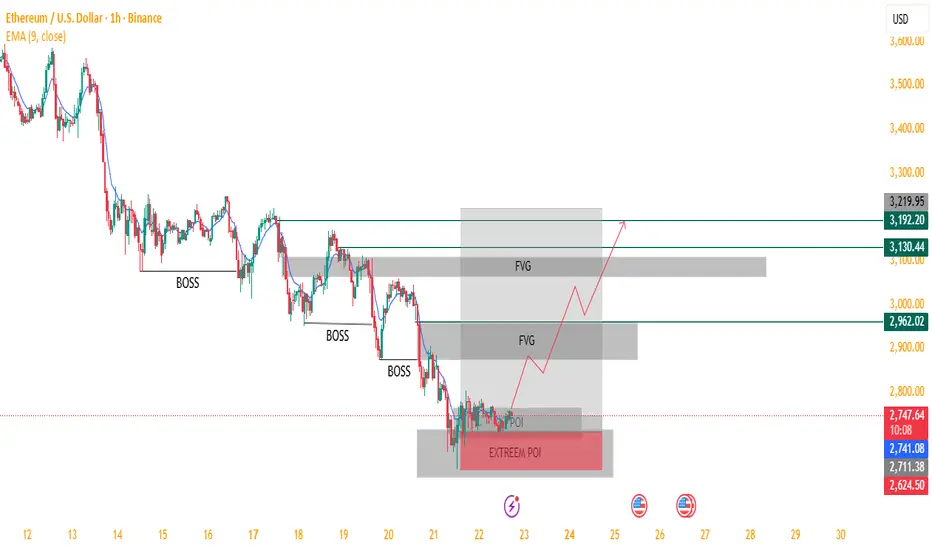
ETH/USD – Potential Bullish Reversal from Extreme POI !Analysis:
The chart suggests Ethereum is currently trading inside a strong Extreme Point of Interest (POI) after a series of Breaks of Structure (BOSS) to the downside. Price has entered a demand zone that may trigger a bullish reversal.
Key observations:
Downtrend Structure: Multiple BOSS confirm
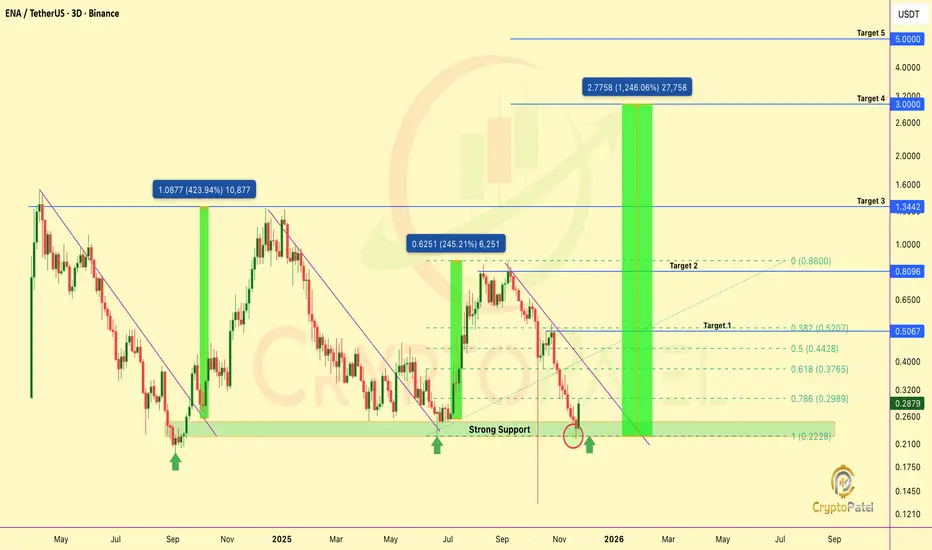
$ENA Technical Outlook: Major Reversal Signal TriggeredMIL:ENA Technical Outlook: Major Reversal Signal Triggered
ENA has cleanly rebounded from its structural support at $0.24–$0.22, a zone that has historically defined trend inflection. As long as price holds above this base, the bullish probability sharply increases, with a potential multi-fold exp
BTCUSD SHOWING A GOOD UP MOVE WITH 1:10 RISK REWARD BTCUSD SHOWING A GOOD UP MOVE WITH 1:10 RISK REWARD
DUE TO THESE REASON
A. its following a rectangle pattern that stocked the market
which preventing the market to move any one direction now it trying to break the strong resistant lable
B. after the break of this rectangle it will boost the market p

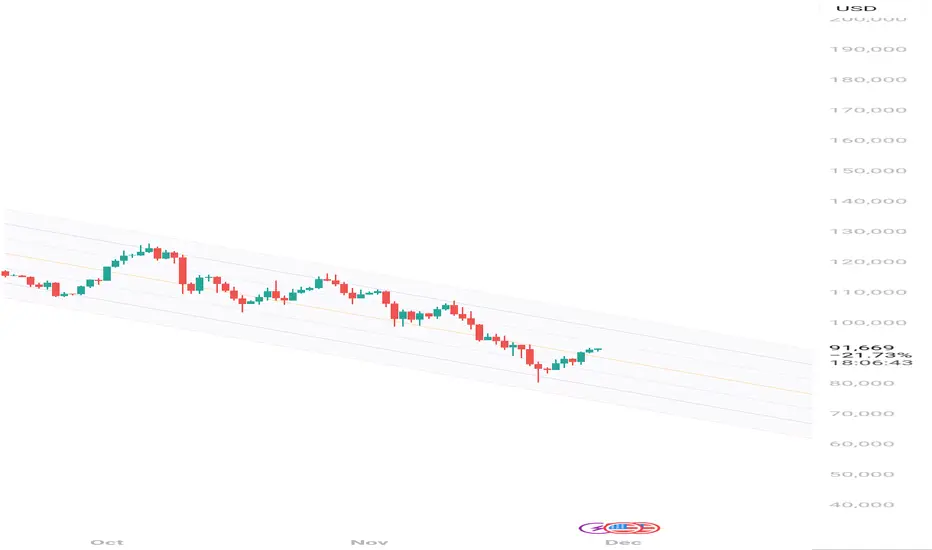
Parallel Channel Idea 1 day TF
For intraday traders, no trading zones are 98k and 104k.
My opinion is, BTC will go up till 98k and fall down to 86-88k for final correction phase.
Also, please don't follow any opinions.
Look at the chart yourself, the channel trend, ema support areas, and candle pattern in various TF
zzzHowever, by 2025, this thesis evolved. The "mining boom" strained the domestic grid during dry seasons and failed to generate the anticipated broad-based employment. Consequently, the Ministry of Energy and Mines announced a suspension of electricity supply to mining operations effective early 2026,

See all crypto ideas
Gold (XAUUSD)15-Min Chart Update | Support Zone Holding StronglyHello guys, Gold continues to respect its rising channel structure, moving between the rising support and resistance trendlines. After a minor correction, the price has once again bounced from the rising support trendline, showing strong buying interest near the lower boundary of the channel.
This

Short I anticipate that December 5th is approaching, and the value of silver may experience a retraction following its peak for the current month

Gold Trading Strategy for 28th November 2025Trade plan (15-minute close rules)
Long (Buy) Plan 🟢
Entry: place a buy order after a 15-min candle closes above $4170 (you may use a market order on the next candle open or a buy-stop just above the high).
Primary targets:
Target 1: $4182 — partial take profit (TP1). 🎯
Target 2: $4195 — add/scale

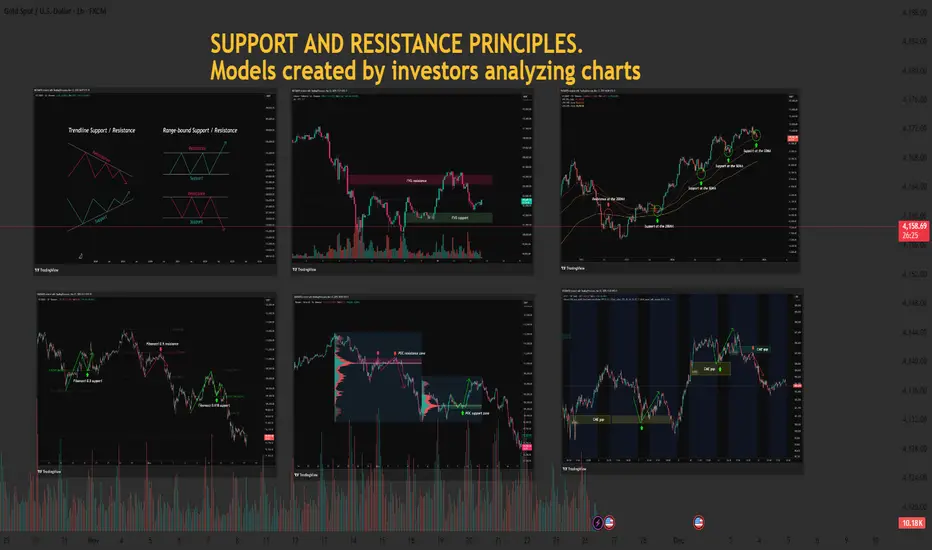
Essential Guide to Support and Resistance 1️⃣ The Importance of Support and Resistance in the Highly Volatile Crypto Market
- The cryptocurrency market operates 24/7/365 and shows significantly higher volatility than traditional financial markets. This volatility creates exceptional profit opportunities but also triggers intense fear and gr
Crude Oil Resistance Breakout – Retest & Buy OpportunityCrude Oil has broken above a key resistance zone, which had previously acted as a strong supply area multiple times. After the breakout, the price is now approaching the same zone for a potential retest.
If the retest holds as support and bullish candles appear, it can confirm buyer strength and pr

XAUUSD – Waiting for Trend Confirmation Around the 4,160–4,170..XAUUSD – Waiting for Trend Confirmation Around the 4,160–4,170 Zone
At the moment, gold has not shown a clearly defined medium-term trend. Price is moving around an important resistance zone, so instead of predicting direction early, I prefer waiting for price reaction at key levels before taking a

XAU/USD – Gold Holds Above Key Support as Pullback Stays LimitedGold remains capped below its two-week high during the Asian session, but the downside is clearly limited.
Market sentiment is shaped by:
A weaker USD as dovish Fed expectations gain traction
Rising probability of rate cuts in upcoming meetings
Improving global risk sentiment amid hopes of progre

XAUUSD – H1 uptrend channel, short-term downside risk increasingXAUUSD – H1 uptrend channel, short-term downside risk increasing Brian – Prioritize short selling at the channel peak, wait to buy back at lower support
I. Strategy Summary Gold is trading in an uptrend channel on H1, but the rise around 4.160 shows signs of weakening, increasing short-term correct

silver crucial updatesilver update--- silver sustain abv 159300 looks up side 159900--160300-160700++++ in spot stya abv 52.60$ look 53$--53.50$++ near yes if sustain than will see more boom
trading ideas--- buy on dips good way with strict support sl likw 52.29 BMV:IN mcx 158300@ sl use must

Silver today booked 3400 points profit,buy given yesterday alsoSilver today booked 3400 points profin on 2 traded , continuesly buying recommended from Friday evening.
Parameters Data
Asset Name Silver MCX
Reason 🟩 Global rate cut hopes aur strong technical momentum ke chalte aggressive buying.
R:R 🟩 R:R ratio is favourable for a target near R2. / Threshold:

See all futures ideas
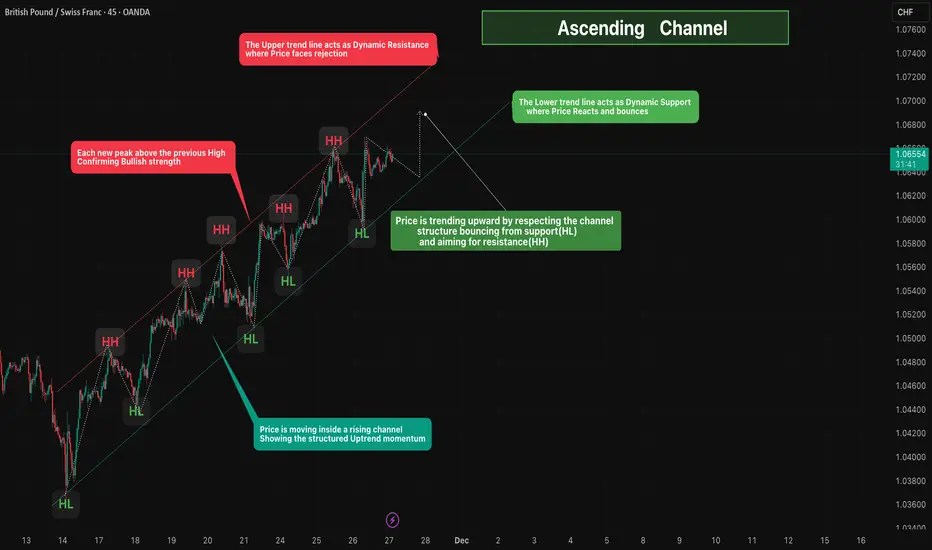
Ascending Channel🔎 Overview
Price is moving inside a well-defined Ascending Channel, showing a strong and structured uptrend.
The market continues to form Higher Highs (HH) and Higher Lows (HL), confirming consistent buying pressure.
The channel provides clear dynamic support and resistance, helping identify
Interesting EURUSD Rebounce w/ chance of BPR and FVG respectedIdea create from FVG 1H respected through US High Impact News. Market interesting with chance of BPR 15m short term and rebounce with OB 5M look like strong effective. Lets risk a bit for SHORT position to see if price can be back at BPR 15m, if right then we looking for BUY position when market ef

CADJPY could keep rising furtherOANDA:CADJPY The market has been on a clear upward trajectory for some time, with each swing reaching higher peaks and forming higher lows. The rising trendline has been the driving force behind this momentum.
Following the recent surge, the price has pulled back slightly, forming a textbook bulli

USD/JPY short term buyAs per wave analysis USD/JPY one more wave needs to be extended for an target of 157.866. One can look for buy side in short term.


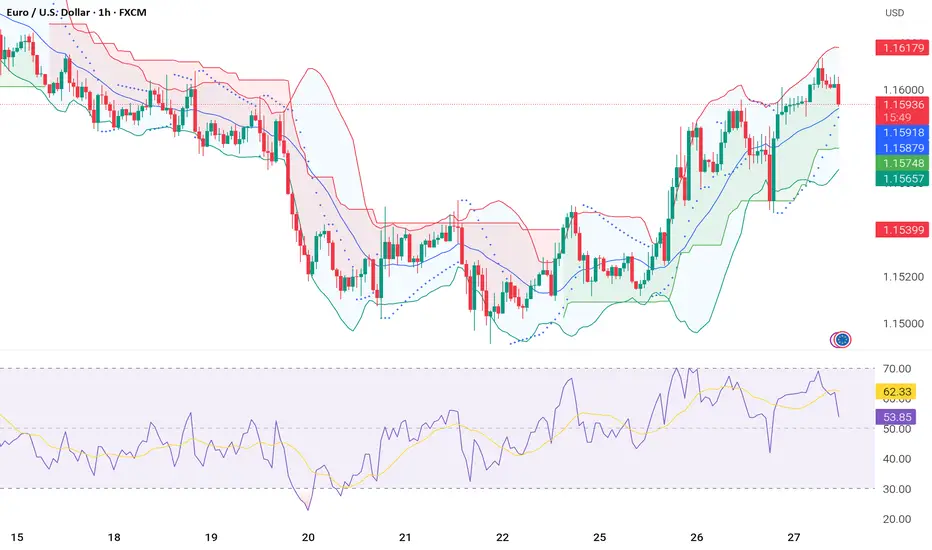
Eurusd technical Analysis EUR/USD is trading in a short-term bullish structure after bouncing from the mid-Bollinger band and holding above the intraday support zone at 1.1575–1.1565. Buyers pushed price toward the upper band, but the pair is now facing strong resistance at 1.1615–1.1620, where recent candles show rejection.
USDJPY MULTI TIMEFRAME ANALYSIS Hello traders , here is the full multi time frame analysis for this pair, let me know in the comment section below if you have any questions , the entry will be taken only if all rules of the strategies will be satisfied. wait for more price action to develop before taking any position. I suggest yo

NZDUSD - Mandelbrot Theorem 1:7 RRSome properties of the Mandelbrot set
This section summons some properties of the Mandelbrot set first without proof, then some statements are proved.
Theorem 3 (Symmetry) The Mandelbrot set is symmetric with respect to the real axis. This means, if a complex number $ z$ belongs to the mandelbro

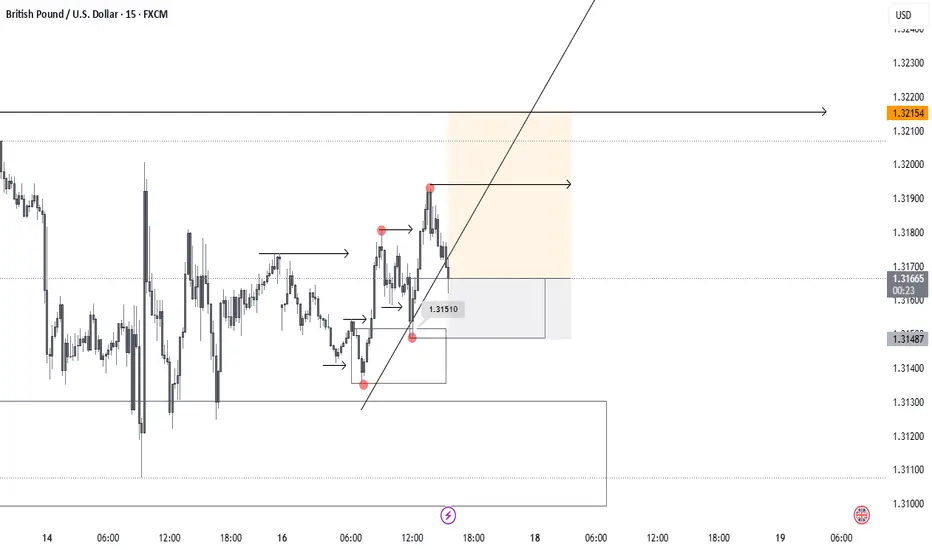
GU Intraday setup on GU
Going with the structure and bullish orderflow.
First target 4H high and will look to take some partials on 15min most recent high.
USDINR breakout on day's chart-21Nov25On the daily chart a breakout has been seen in USDINR. Presenting a long term view in my analysis. It is following a parallel bracket movement. Good time to buy Dollar for another 1 year period for range between 91 to 92.
Analysis is for educational purpose, I am not a SEBI advicer.

See all forex ideas
| - | - | - | - | - | - | - | - | ||
| - | - | - | - | - | - | - | - | ||
| - | - | - | - | - | - | - | - | ||
| - | - | - | - | - | - | - | - | ||
| - | - | - | - | - | - | - | - | ||
| - | - | - | - | - | - | - | - | ||
| - | - | - | - | - | - | - | - | ||
| - | - | - | - | - | - | - | - | ||
| - | - | - | - | - | - | - | - |
Trade directly on the supercharts through our supported, fully-verified and user-reviewed brokers.


