TRADINGVIEW IS LOOKING FOR A NEW INDIAN REGION MODERATOR!Join Our Team: Exciting Opportunity to Become a Moderator for the Indian Region Community at TradingView!
Hello TradingView Enthusiasts,
Are you passionate about trading and the TradingView platform? We are on the lookout for a new moderator to join our INDIAN REGION Community and help elevate th

The best trades require research, then commitment.
Get started for free$0 forever, no credit card needed

Scott "Kidd" PoteetPolaris Dawn astronaut

Where the world does markets
Join 100 million traders and investors taking the future into their own hands.

Market Outlook & Trade Setup – Monday, 2nd Feb 2026Major indices corrected heavily yesterday during the Budget announcement due to the increase in STT in F&O and no respite in LTCG.
Nifty, Sensex and Bank nifty went minus by almost 500,1200 and 1500 points respectively. We expect the selling to continue further. Additionally, the selling in metals c

PTL Trade SetupCurrent Market Price (CMP): 41.50
Breakout Context: Consolidation breakout confirmed yesterday with strong volume, which adds conviction.
Target: 46.62 (approx. +12.3% from CMP)
Stop Loss: 40.03 (risk of about -3.5% from CMP)
Key Notes
- A breakout with volume often signals genuine momentum, but

KAYNES above 3427 – Breakout or Pullback?KAYNES Technology India has strong long-term earnings growth and good profit and revenue growth over recent years, supported by expanding electronics & EMS market trends.
The stock trades with a relatively high P/E but is backed by a firm order book and industry relevance.
Despite recent volatility

Breakout soon Arman Financial Symmetrical Triangle Breakout Setup
RSI near 60 and rising
Trading above EMA50
Volume increasing
2+ yrs of consolidation
Enter after breakout confirmation!
Disc: for study, DYOR

Expecting audcad sell delivery for buy setupsBetween these two red lines inside weekly+daily imb, the set-up could be find for buys
Why? Price already taken the liquidity above and it possible scenario
shows the probability
of retracement ( where structure shift indicates sellside delivery,
however buys will be
more safer approach fundam

PAGEIND M PATTREN BREAKDOWN 31 01 2026📈 1) Pageind Pattern Structure: M-Pattern / Double Top
An M-Pattern (Double Top) is a bearish reversal pattern with the following components:
Left Top → Right Top ≈ equal highs
Neckline → horizontal support connecting the swing lows between tops
Breakdown → close below the neckline confirms the pat

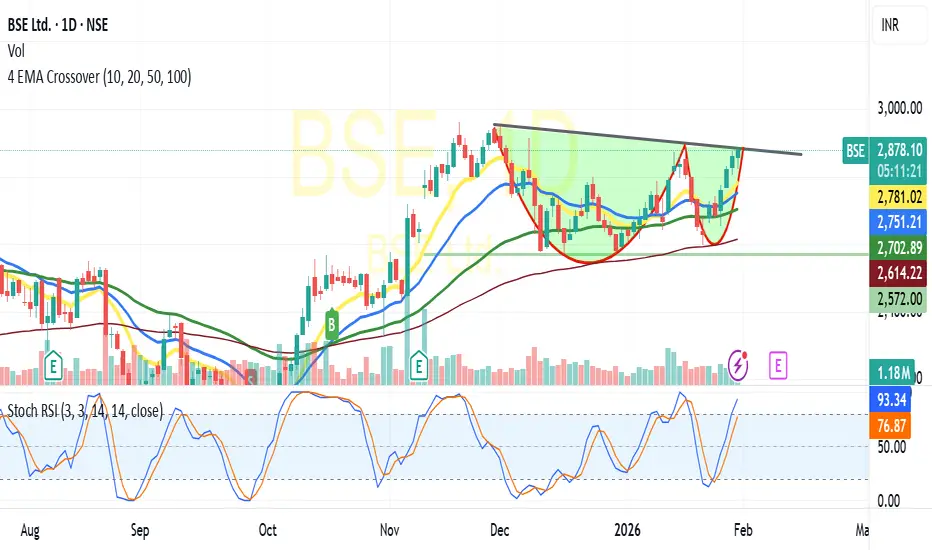
BSE-Likely Cup &Handle Break outBSE:
Trading at 2881 and above all its critical Moving averages Viz10/20/50/10 DEMA
In daily chart has formed C&H Pattern,
Based on the pattern and price volume suggests -breaking the Neckline resistance at 2880-2900 likely to test 2950/3000+ shortly(For educational purpose only)
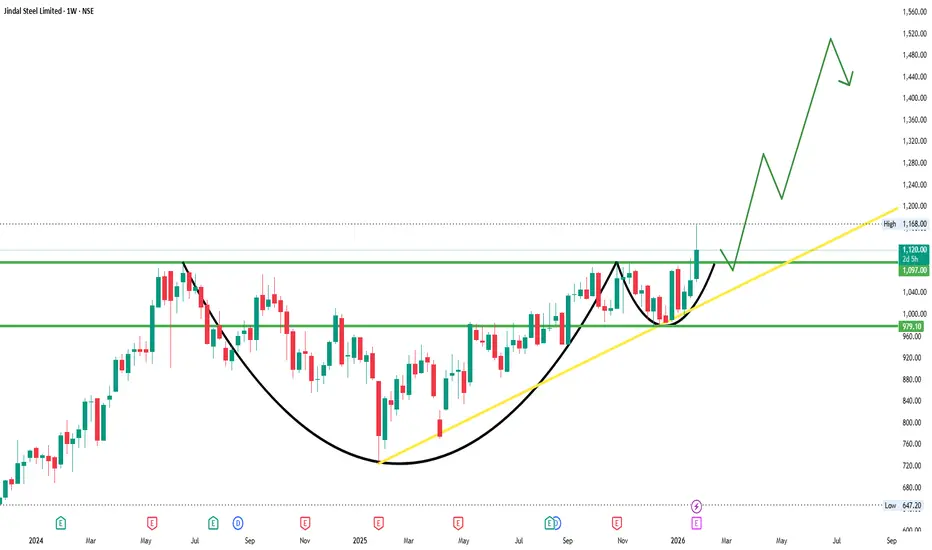
JINDALSTELJINDALSTEL
bullish trend is Showing on the chart.
buy signals in
technical indicators and
cup with handle & ascending triangle chart pattern.
BUYING RANGE 1090/1100
Watch for a breakout above 1090/1100 to sustain the bullish trend. If the resistance holds, there could be a retest towards 975/980
FUSION - Time to shine?DISCLAIMER: This is NOT a trade recommendation but only my observation. Please do your own analysis before entering your trades
Points to note:
-----------------
1. Price has been in consolidation for 8 months inside a triangle
2. Attempt to breakdown was rejected with price swiftly moving back i

See all editors' picks ideas
Hyperfork Matrix🔱 Hyperfork Matrix 🔱 A manual Andrews Pitchfork tool with action/reaction propagation lines and lattice matrix functionality. This indicator extends Dr. Alan Andrews' and Patrick Mikula's median line methodology by automating the projection of reaction and action lines at equidistant intervals, cr

Arbitrage Matrix [LuxAlgo]The Arbitrage Matrix is a follow-up to our Arbitrage Detector that compares the spreads in price and volume between all the major crypto exchanges and forex brokers for any given asset.
It provides traders with a comprehensive view of the entire marketplace, revealing hidden relationships among d

Wyckoff Schematic by Kingshuk GhoshThe "Wyckoff Schematic" is a Pine Script indicator that automatically detects and visualizes Wyckoff Method accumulation and distribution patterns in real-time. This professional tool helps traders identify smart money movements, phase transitions, and critical market structure points.
Key Features

Volume Cluster Profile [VCP] (Zeiierman)█ Overview
Volume Cluster Profile (Zeiierman) is a volume profile tool that builds cluster-enhanced volume-by-price maps for both the current market window and prior swing segments.
Instead of treating the profile as a raw histogram only, VCP detects the dominant volume peaks (clusters) insid

DeeptestDeeptest: Quantitative Backtesting Library for Pine Script
━━━━━━━━━━━━━━━━━━━━━━━━━━━━━━━━━━
█ OVERVIEW
Deeptest is a Pine Script library that provides quantitative analysis tools for strategy backtesting. It calculates over 100 statistical metrics including risk-adjusted return ratios (Sharpe

Arbitrage Detector [LuxAlgo]The Arbitrage Detector unveils hidden spreads in the crypto and forex markets. It compares the same asset on the main crypto exchanges and forex brokers and displays both prices and volumes on a dashboard, as well as the maximum spread detected on a histogram divided by four user-selected percenti

Multi-Distribution Volume Profile (Zeiierman)█ Overview
Multi-Distribution Volume Profile (Zeiierman) is a flexible, structure-first volume profile tool that lets you reshape how volume is distributed across price, from classic uniform profiles to advanced statistical curves like Gaussian, Lognormal, Student-t, and more.
Instead of forcin

Multi-Ticker Anchored CandlesMulti-Ticker Anchored Candles (MTAC) is a simple tool for overlaying up to 3 tickers onto the same chart. This is achieved by interpreting each symbol's OHLC data as percentages, then plotting their candle points relative to the main chart's open. This allows for a simple comparison of tickers to tr

Vdubus Divergence Wave Pattern Generator V1The Vdubus Divergence Wave Theory
10 years in the making & now finally thanks to AI I have attempted to put my Trading strategy & logic into a visual representation of how I analyse and project market using Core price action & MacD. Enjoy :)
A Proprietary Structural & Momentum Confluence System

Per Bak Self-Organized CriticalityTL;DR: This indicator measures market fragility. It measures the system's vulnerability to cascade failures and phase transitions. I've added four independent stress vectors: tail risk, volatility regime, credit stress, and positioning extremes. This allows us to quantify how susceptible markets are

See all indicators and strategies
Community trends
PTL Trade SetupCurrent Market Price (CMP): 41.50
Breakout Context: Consolidation breakout confirmed yesterday with strong volume, which adds conviction.
Target: 46.62 (approx. +12.3% from CMP)
Stop Loss: 40.03 (risk of about -3.5% from CMP)
Key Notes
- A breakout with volume often signals genuine momentum, but

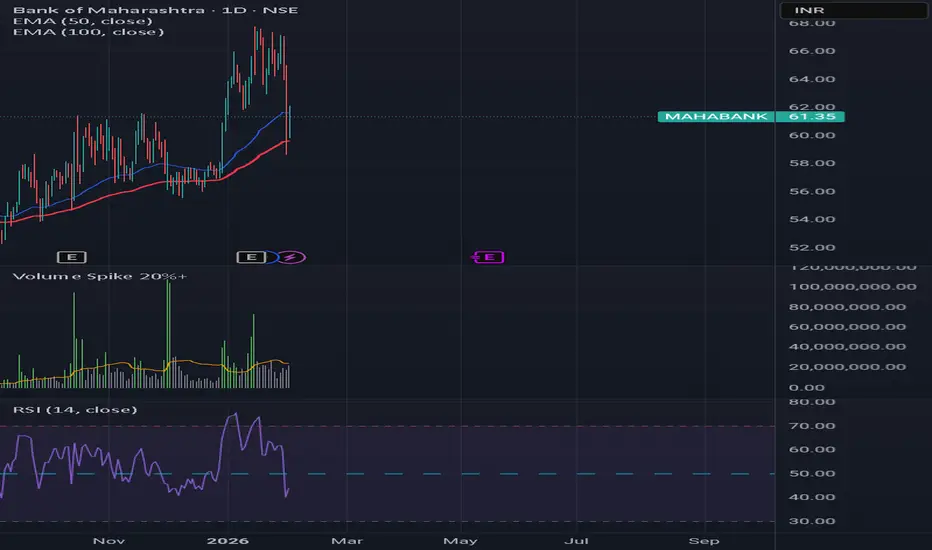
MAHABANKShowing support at 8t 50 days MA
RSI bounced back from its lower level (39 to 43) and becoming stronger.
MACD on monthly chart indicates share prices is preparing for longterm bet.
MCX NSE/BSE(STOCK) EQUITY, GREAT BUYING OPPROTUNITY."a great dip occurred, and i have been waiting eagerly to buy at this price following the stock split. this is an excellent opportunity to purchase and target a sale price between 3,000 and 3,110. if you are a long-term buyer, you can hold for three to four years and potentially see your investment

Maruti Suzuki: Gearing Up for a BreakoutMaruti Suzuki (MARUTI) is currently at a strategic inflection point, exhibiting a super bullish outlook as it transitions from a traditional ICE powerhouse to an EV contender. Fundamental strength is anchored by a record-breaking Q3 FY26, where net sales surged 29% YoY to ₹475 billion. The imminent

KAYNES above 3427 – Breakout or Pullback?KAYNES Technology India has strong long-term earnings growth and good profit and revenue growth over recent years, supported by expanding electronics & EMS market trends.
The stock trades with a relatively high P/E but is backed by a firm order book and industry relevance.
Despite recent volatility
Keep MRPL on your WatchlistMRPL forming a Symmetrical Triangle Breakout Setup📈
✔️RSI above 65 and rising
✔️Trading above EMA50
✔️Volume increasing
✔️+11 months of consolidation
enter after breakout confirmation
Disc: not a recommendation. DYOR

BLUESTARCO – Pure Price Action in ActionBLUESTARCO was moving inside a falling channel for a long time, where price kept coming down from the upper trendline and taking support at the lower trendline, showing how clearly it respected the structure. Recently, price reached the lower support again and bounced strongly, which tells us that s

Positional or Longterm Opportunity in NAVA LtdGo Long @ 570.9 for Targets of 607.25, 643.6, 679.95 and 716.3 with SL 534.55
Reasons to go Long :
1. The stock formed a Bullish Engulfing Pattern (marked with a orange color).
2. Also there is a strong Trendline (marked with green color) which supports the stock.
3. Also there is a strong deman

Symmetrical Triangle Masterpiece : Multi-Layout W,DtfStep into this dynamic multi-layout window opened right in front of you—a split-screen showcase of pure price action artistry.
Left Side: Weekly Timeframe
Here, a symmetrical triangle (a classic continuation or reversal pattern formed by two converging trendlines of equal slope) takes center stage.

See all stocks ideas
Today
RBARestaurant Brands Asia Limited
Actual
—
Estimate
−0.40
INR
Today
INDHOTELIndian Hotels Co. Ltd.
Actual
—
Estimate
5.08
INR
Today
TRANSRAILLTransrail Lighting Limited
Actual
—
Estimate
7.56
INR
Today
AETHERAether Industries Ltd.
Actual
—
Estimate
4.10
INR
Today
ADFFOODSADF Foods Limited
Actual
—
Estimate
—
Today
TRITURBINETriveni Turbine Limited
Actual
—
Estimate
3.17
INR
Today
BAJFINANCEBajaj Finance Limited
Actual
—
Estimate
10.31
INR
Today
DEEDEVDEE Development Engineers Limited
Actual
—
Estimate
—
See more events
No scheduled reports
Community trends
Best entry of all timeJust entry liquidity - when you see liquidity, and market structure change, along with benchmarks like gold and geopolitics. You should be in and win

ETHUSD SHOWING A GOOD DOWN MOVE WITH 1:8 RISK REWARDETHUSD SHOWING A GOOD DOWN MOVE WITH 1:8 RISK REWARD
DUE TO THESE REASON
A. its following a rectangle pattern that stocked the market
which preventing the market to move any one direction now it trying to break the strong resistant lable
B. after the break of this rectangle it will boost the mark

Why Bitcoin’s Stability Is a Warning, Not StrengthBitcoin’s inability to participate in the recent “debasement trade” is not a sign of hidden strength — it’s a sign of waning relevance in the current macro cycle.
While gold and silver surged during the final euphoric phase, Bitcoin’s stagnation near $82,000 suggests that capital actively chose har

Bitcoin Bybit chart analysis FEBURARY 2Hello
It's a Bitcoin Guide.
If you "follow"
You can receive real-time movement paths and comment notifications on major sections.
If my analysis was helpful,
Please click the booster button at the bottom.
This is Bitcoin's 30-minute chart.
The Nasdaq indicators will be released shortly at 12:0

Bitcoin For Short sideBitcoin is likely to form a downside impulse wave if viewed as a continuation of a impulse wave and a correction.

#ETH Risker than beforeWatch for these levels. ETH can head back to $900 to $1000 again.
This chart/indicator is provided for educational and informational purposes only.
It does not constitute financial advice, investment recommendations, or trade signals.
The creator and Systematic Traders Club are not responsible

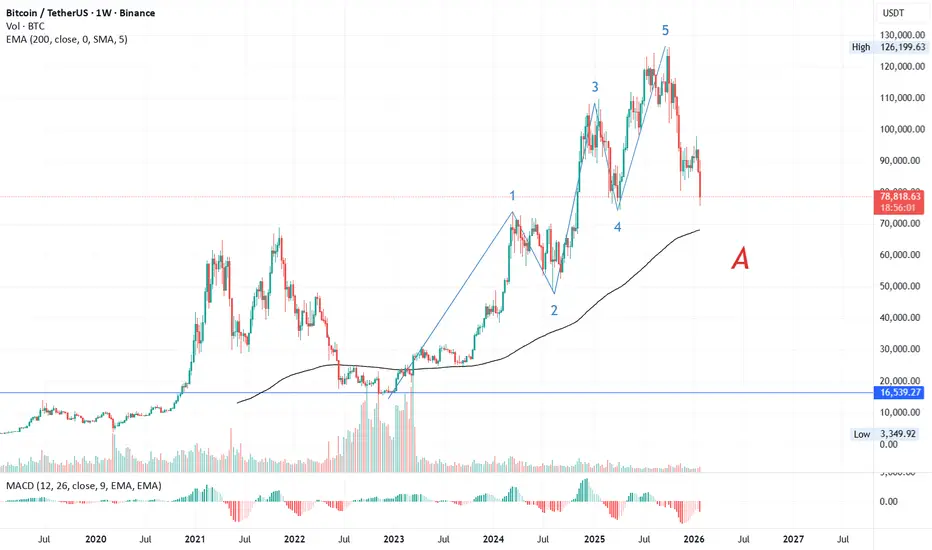
#BitcoinBitcoin Wave Analysis
Bitcoin’s bull run began in December 2022 around $14,500, forming a clear impulsive structure:
- Wave 1: $73,700 (March 2024)
- Wave 2: $50,500 (August 2024)
- Wave 3: $108,000 (January 2025)
- Wave 4: $79,000 (March 2025)
- Wave 5: $126,199 before correction
Aft
$BTC UPDATE: 22% DOWN FROM MY SHORT ZONECRYPTOCAP:BTC UPDATE: 22% DOWN FROM MY SHORT ZONE
When Most MoonBoys Were Calling $200K–$500K... I Shared Shorts at $95K-$98K.
Today: Bitcoin Touched $75,500 ✅
Results Without Leverage: +22%
With 5x Leverage: ~100%+ ProfitIf You Followed the Setup and Now Time to Book Profits.
The Trend Was Clear

Bitcoin Market Structure Shift: The "Kiss of Death" RetestThe current 1-hour chart for BTC/USD shows Bitcoin struggling to maintain upward momentum after a significant sell-off. Price action is currently respecting a descending trendline that has acted as a ceiling for several days.

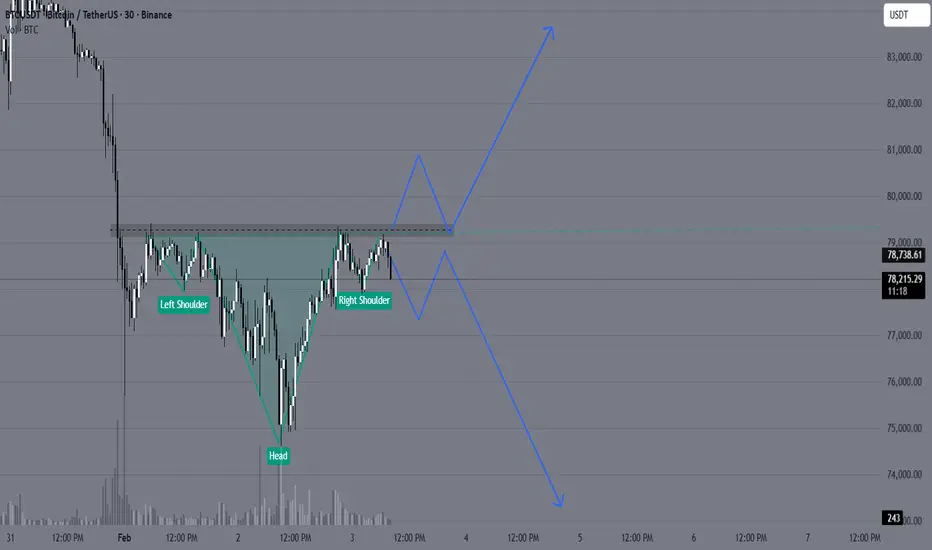
BTCUSD might give Structure Shift Now✅ Pattern: Potential Inverse Head & Shoulders
Look closely:
Left dip → around 76.8k
Deep dip (Head) → around 75k
Right dip → higher low near 76.5k
Now price is pushing back up
This is a classic reversal structure.
✅ Important Level: Neckline Resistance
The dotted zone you marked around:
79,
See all crypto ideas
$TVC:SILVER MOON MISSION:2025-29 is History Repeating Again? TP?🚀 Silver Feature Analysis 2026 – 2029: The Historical Repeat 🚀
TVC:SILVER has recently hit its All-Time High (ATH) three times in history with massive rallies. My analysis is based on the duration and percentage returns of these specific periods:
1️⃣ 1980: (1 Aug 1979 to 29 Jan 1980) – A 6-month

Silver crash at a glanceSilver after hitting 420 is trading at 265 almost 155L down just in 2 sessions a sustainable candle below 250 can create more pressure towards downside let's see if this is a bubble burst or just accumulation

GIFTNIFTY Intra-Swing Level Analysis for 02nd FEB 2026 GIFTNIFTY Intra-Swing Level Analysis for 02nd FEB 2026
🚀Follow & Compare NIFTY spot Post for Taking Trade
━━━━━━━━━₹₹₹₹₹₹₹₹₹₹₹₹━━━━━━━━
💥Level Interpretation / description:
L#1: If the candle crossed & stays above the “Buy Gen”, it is treated / considered as Bullish bias.
L#2: Possibility

gold support at 4550-4600 for the target of 6200-6500gold should take support around 4550-4600 as per fibonacci and then if it consolidates at this level then potential next target is 6200-6500

Silver Weekly Outlook: Post-Exhaustion PhaseSilver has entered a high-volatility post-exhaustion phase after a sharp parabolic rise followed by an equally aggressive correction. The weekly chart clearly shows that price moved too far, too fast, and the recent sell-off is a classic example of mean reversion after euphoric buying. Such phases r

SILVER CRASH >>> What next ?Silver
ATH 422K
Sharp Correction/Dip CMP 265k
View
Gap is highlighted via 3 Yellow Circles
CMP 265K is close to Final Gap
Further Dip till 250K or Max 245K is expected
Reversal from 245K cant be ruled out
Max 240K can be considered as SL
For more insights & trade ideas,
📲 Visit my profile

SILVER SOPT VIEW SILVER POSSIBLE MOVE
RESISTANCE 97.00 , 110.00
SUPPORT 73.00 , 67,00
69.70 below sustain or close invalidation
View is for study purpose only , we are not recommend any trade or investment
Always do your own analysis

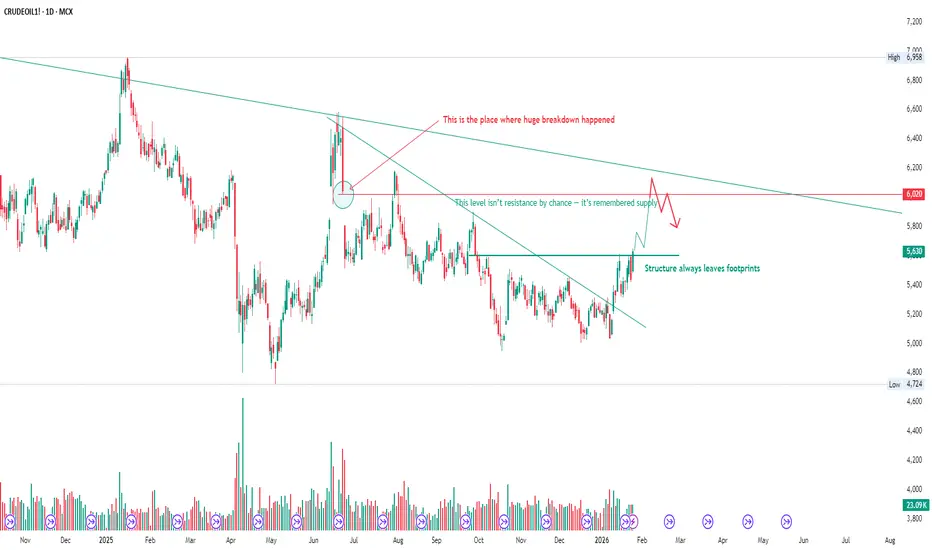
Crude Oil: The Market Is Revisiting the Scene of the BreakdownCrude Oil is revisiting a level where a major structural breakdown occurred in the past.
Markets don’t forget such zones easily. What once triggered aggressive selling often turns into active supply when revisited.
The recent move is not random strength — it’s a retest of prior imbalance, followed
XAGUSD/SILVER WEEKLY SELL PROJECTION 01.02.26XAGUSD Weekly Sell Projection – Script
This is the weekly technical analysis of XAGUSD, also known as Silver.
Price was previously moving inside a parallel uptrend channel.
Near the top of the channel, the market formed an Evening Star candlestick pattern, which indicates a potential bearish rever

XAUUSD: Liquidity Swap Near PDL – Relief Bounce Into Sell ZoneDescription
Gold is currently trading inside a key liquidity zone after a strong bearish impulse.
Price swept sell-side liquidity and is now showing a short-term corrective bounce.
What I’m seeing:
Clear bearish market structure (lower highs & lower lows)
Price reacting from sell-side liquidity

See all futures ideas
EURUSD - 4H - SHORTFOREXCOM:EURUSD
Hello traders , here is the full multi time frame analysis for this pair, let me know in the comment section below if you have any questions, the entry will be taken only if all rules of the strategies will be satisfied. wait for more Smart Money to develop before taking any pos

EURUSD - WEEKLY OUTLOOKOn the Monthly & Weekly timeframes, EURUSD remains bearish.
Price is currently holding in the premium area and has printed a strong weekly rejection candle from a monthly Order Block, which supports downside continuation.
🔍 Daily Perspective
Expectation is for price to move into the discount area,

Expecting EurCHF bearish Why should we trust this idea 💡??Eur has 2.15% interest rate ,while chf is safe heaven currency so
it would shows always significant strength towards chf ,apart from that any Ongoing panic
global events will also cause CHF bullish with aligning the price action parameters by following liquidity 💲⚔

EUR/USDEURUSD experienced a clean intraday sell-side liquidity sweep, breaking below the prior range low with strong bearish displacement, signaling a stop-driven move rather than organic trend continuation.
Price tagged the lower liquidity pool, printed a sharp rejection wick, and immediately delivered a

EUR/JPY Long: Riding the Momentum After Clean BOS The price action on EUR/JPY is currently displaying strong bullish momentum on the M15 timeframe. After a period of consolidation, the pair has successfully achieved a Break of Structure (BOS) to the upside, signaling a transition from a range-bound environment to an active uptrend.

Trade AUDJPY with Precision – Real-Time Insights Await!Never miss a AUDJPY opportunity again. Get live quotes, advanced charting tools, and instant trade execution—all in one platform. Perfect for traders who act on precision.

Just a Normal setupTake the buy ONLY if one of these happens:
4H or 1H strong bullish close from the zone
Long lower wick + bullish body (rejection)
5m/15m break of structure upward, then pullback
Sweep below demand → fast reclaim above 1.184

USDCHF 1W T/F ANALYSIS---
USDCHF 1w t/f analysis----
📊 Market Structure Explanation (usdchf – 1w):-
Centeral structure are a vibrancy (Explanation of Vibrancy structure > this structure are first volume contraction and bended both side also then empulsive move and break it`s sel

AUDJPY : Bulls Defending the Line 106.60 !AUDJPY has undergone a significant correction, sliding from the 109.00 peak down to the 106.20 region. However, the bears have hit a massive roadblock. We are currently seeing a strong reaction from a historical demand zone (105.80 – 106.00), marked by the clear rejections in the shaded circles on t

EURUSD to test the highs !!ICT Concepts: Price delivering out of a 1hr FVG. SMT with GBPUSD. Price now should move from a IRL to the ERL.

See all forex ideas
| - | - | - | - | - | - | - | - | ||
| - | - | - | - | - | - | - | - | ||
| - | - | - | - | - | - | - | - | ||
| - | - | - | - | - | - | - | - | ||
| - | - | - | - | - | - | - | - | ||
| - | - | - | - | - | - | - | - | ||
| - | - | - | - | - | - | - | - | ||
| - | - | - | - | - | - | - | - | ||
| - | - | - | - | - | - | - | - |
Trade directly on Supercharts through our supported, fully-verified, and user-reviewed brokers.


