Part 6 Learn Institutional Trading What Are Options?
An option is a financial derivative whose value is based on an underlying asset—such as stocks, indices, or commodities. The two main types of options are:
Call Option: Gives the holder the right to buy an asset at a specific price (called the strike price) before or on the expiration date.
Put Option: Gives the holder the right to sell an asset at a specific strike price before or on the expiration date.
The buyer of an option pays a premium to the seller (writer) for this right. The seller, in return, assumes an obligation—if the buyer exercises the option, the seller must fulfill the contract terms.
Community ideas

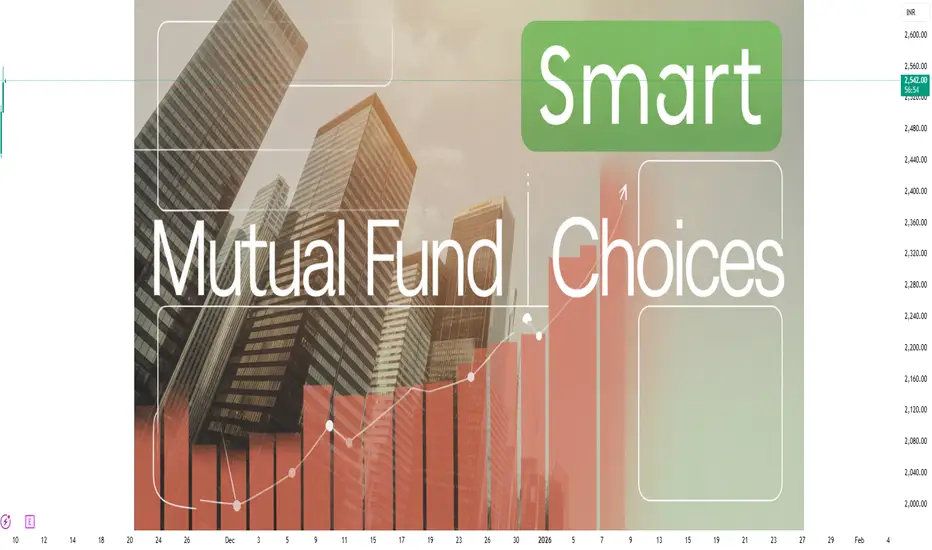
Why “Smart Choices” Matter in Mutual Fund Investing1. The Power of Informed Decision-Making
When you invest in a mutual fund, you’re essentially trusting a professional fund manager to invest your money across different assets like equities, bonds, or money market instruments. However, not all mutual funds are created equal. Each fund has its own investment strategy, risk profile, and objectives. A smart investor understands this and makes choices that align with their personal goals — such as capital appreciation, income generation, or wealth preservation.
For instance, someone saving for retirement in 20 years should not choose a short-term debt fund. Instead, an equity mutual fund with strong long-term growth potential would make more sense. Similarly, if an investor’s goal is to park funds for six months, equity mutual funds would be too volatile — a liquid or ultra-short-term fund would be more appropriate.
Smart investing starts with matching the fund’s characteristics with your financial goals. It’s not about chasing high returns; it’s about making the right choices for your situation.
2. Avoiding Emotional Traps and Market Noise
One of the biggest enemies of wealth creation is emotional decision-making. Many investors panic during market downturns or get carried away by bullish euphoria, switching funds or redeeming investments at the wrong time.
Making smart choices in mutual fund investing means staying disciplined. It means understanding that markets move in cycles and that volatility is part of the game. Smart investors don’t react to short-term fluctuations; they focus on long-term fundamentals.
For example, during a market correction, an impulsive investor might redeem their equity mutual fund holdings to “cut losses,” while a smart investor might see it as a chance to invest more at lower valuations — positioning themselves for stronger future gains.
Smart choices are guided by rational thinking and patience, not fear or greed.
3. Importance of Fund Selection
Fund selection is where the real “smart” in smart investing shows up. With thousands of mutual fund schemes available, it’s easy to get lost. But not all funds are good fits for every investor.
A smart investor looks beyond the marketing hype and flashy past returns. They analyze factors such as:
Fund performance consistency over different market cycles
Expense ratio (how much you pay in fees annually)
Fund manager’s experience and track record
Portfolio composition (which sectors and stocks the fund invests in)
Risk-adjusted returns — not just how much the fund earns, but how efficiently it earns it
For instance, two funds may both show 12% annual returns, but one might have taken significantly higher risk to achieve that. Smart investors prefer funds that deliver steady performance with controlled volatility.
4. Risk Management: The Core of Smart Investing
Every investment carries some level of risk — whether it’s market risk, credit risk, or interest rate risk. Smart choices help investors manage and balance these risks.
A common mistake is assuming that higher returns automatically mean better investments. In reality, higher returns often come with higher risks. Smart investors diversify across asset classes (equity, debt, gold, etc.) and fund categories (large-cap, mid-cap, hybrid, etc.) to reduce the impact of any one sector or asset’s underperformance.
Moreover, they regularly review their portfolios to ensure the asset allocation still matches their risk tolerance and life goals. For example, a 30-year-old might have 80% equity exposure, but by age 50, they might gradually shift to a more balanced or debt-heavy portfolio.
Smart risk management isn’t about avoiding risk — it’s about understanding and controlling it.
5. The Compounding Effect: Reward for Smart Patience
Mutual fund investing rewards those who make smart, consistent, and patient choices. The real power of mutual funds lies in compounding — the ability of your returns to generate more returns over time.
For instance, investing ₹10,000 per month for 20 years at a 12% annual return grows to over ₹98 lakh. But stopping after just 10 years would result in only ₹23 lakh — a huge difference driven purely by time and discipline.
Smart investors understand that time in the market is more important than timing the market. They stick with their investment plans, stay invested through ups and downs, and allow compounding to do its magic.
6. Reviewing and Rebalancing: Staying Smart Over Time
Making smart choices isn’t a one-time activity — it’s an ongoing process. Markets evolve, economic conditions change, and personal financial goals shift over time.
Smart investors regularly review their portfolios — at least once or twice a year — to ensure that their funds are performing as expected and are still aligned with their objectives. If a particular fund consistently underperforms or no longer fits the investor’s strategy, a smart reallocation may be needed.
This process, known as portfolio rebalancing, ensures that investors don’t become overexposed to certain sectors or asset classes unintentionally. For instance, if equity markets rally and equity holdings grow disproportionately, the investor may shift some funds back to debt instruments to maintain balance.
7. Tax Efficiency: A Key Part of Smart Choices
Smart investors also consider tax implications when choosing mutual funds. Different types of funds are taxed differently:
Equity mutual funds attract 10% long-term capital gains tax if held for more than one year (above ₹1 lakh).
Debt funds, on the other hand, are taxed at the investor’s slab rate for gains after three years.
Investors can also take advantage of tax-saving mutual funds (ELSS) under Section 80C, which provide both wealth creation and tax benefits.
Being tax-smart enhances net returns and ensures that more of your earnings stay in your pocket rather than going to the tax department.
8. The Role of SIPs in Making Smart Choices
Systematic Investment Plans (SIPs) are one of the smartest tools available in mutual fund investing. They allow investors to invest small amounts regularly, removing the burden of timing the market. SIPs help average out the cost of investment through rupee-cost averaging and instill financial discipline.
By investing monthly instead of making lump-sum contributions, investors can navigate market volatility more effectively. SIPs also make it easier to stay consistent — a hallmark of smart investing.
9. Learning from Mistakes and Evolving
Even the smartest investors make mistakes. What separates successful investors from the rest is their ability to learn and adapt. Smart choices involve not just knowledge, but also self-awareness — understanding one’s biases, emotions, and limitations.
Over time, smart investors refine their strategies, stay updated with market trends, and make better decisions based on experience and data.
10. Conclusion: Smart Choices Build Wealth, Not Luck
Mutual fund investing is one of the most effective ways to grow wealth over time — but it demands smart decision-making at every step. Choosing the right fund, staying disciplined, managing risk, reviewing performance, and maintaining long-term patience all contribute to financial success.
Smart choices are not about predicting the market or chasing short-term gains. They’re about aligning investments with goals, managing emotions, and staying consistent.
In the end, the real difference between an average investor and a successful one isn’t luck — it’s the ability to make smart, informed, and disciplined choices in mutual fund investing.
The Future of High-Frequency Trading (HFT)Speed, Strategy, and the Next Market Revolution
High-Frequency Trading (HFT) has revolutionized global financial markets over the past two decades. What began as an innovation in trading efficiency has evolved into a highly sophisticated ecosystem where algorithms compete for nanosecond advantages. As technology continues to advance and regulations adapt, the future of HFT stands at the crossroads of artificial intelligence, quantum computing, and evolving market structures. This article explores the future of HFT—its direction, challenges, and the forces shaping its next phase.
1. The Evolution of HFT: From Speed to Intelligence
In its early days, HFT was primarily about speed—executing orders faster than anyone else. Firms invested heavily in low-latency networks, co-location services, and custom hardware to shave off microseconds. Those who executed trades even a fraction of a second faster could exploit small price inefficiencies for massive cumulative profits.
However, as markets became saturated with HFT players and infrastructure speeds reached physical limits (the speed of light), the competitive edge began shifting from raw speed to strategic intelligence. Now, success in HFT increasingly depends on smarter algorithms, superior data analysis, and predictive modeling rather than just faster cables.
The next era of HFT will thus be defined not by who is faster, but by who is smarter.
2. The Role of Artificial Intelligence and Machine Learning
Artificial Intelligence (AI) and Machine Learning (ML) are transforming the way HFT strategies are designed and executed. Traditional HFT algorithms rely on rule-based systems—predefined triggers for buying or selling. But AI-driven systems can analyze complex market data, detect evolving patterns, and make autonomous trading decisions in real time.
AI enables “adaptive trading”—algorithms that learn from past trades, market conditions, and competitor behavior to continuously optimize performance. For instance:
Reinforcement learning models can test millions of trading strategies in simulated markets and refine them dynamically.
Neural networks can detect hidden correlations between assets or anticipate volatility spikes.
Natural Language Processing (NLP) can analyze news headlines, social media, and even central bank statements for sentiment signals.
The future of HFT will likely integrate AI into every layer—from signal generation to order execution—creating a new class of self-evolving trading machines.
3. Quantum Computing: The Next Speed Frontier
While AI adds intelligence to HFT, quantum computing may reintroduce a new frontier of speed. Quantum computers have the potential to process vast datasets and run complex probabilistic models exponentially faster than classical computers.
For HFT, this means:
Faster optimization of multi-variable trading strategies.
Instant analysis of correlations across thousands of assets.
Enhanced encryption-breaking capabilities—posing new security challenges for exchanges.
Although quantum technology is still in early stages, firms like IBM, Google, and major hedge funds are already exploring quantum algorithms for portfolio optimization and risk modeling. Within the next decade, early adopters could gain an edge similar to what early HFT pioneers had in the 2000s.
4. Regulation and Ethical Challenges
The rise of HFT has sparked concerns about market fairness and systemic risk. Critics argue that HFT firms gain unfair advantages, manipulate prices, and contribute to flash crashes—sudden market collapses triggered by algorithmic errors or feedback loops.
In response, regulators worldwide are tightening oversight:
Europe’s MiFID II imposes stricter reporting and transparency rules for algorithmic trading.
The U.S. SEC has increased surveillance on market manipulation techniques like “spoofing” and “quote stuffing.”
India’s SEBI has introduced frameworks for algorithmic trading access, ensuring level playing fields.
Going forward, regulation will likely focus on algorithmic accountability—requiring firms to demonstrate that their trading systems are safe, transparent, and auditable. Ethical AI design will become a competitive necessity, as firms must balance profit with stability and fairness.
5. The Expansion of Alternative Markets
Another major trend shaping HFT’s future is the rise of alternative trading systems (ATS) and dark pools. These off-exchange venues allow large institutions to trade with less visibility, reducing market impact. HFT firms are increasingly participating in these environments, providing liquidity and executing arbitrage between public and private markets.
Additionally, the growing ecosystem of cryptocurrency and digital assets has opened a new frontier for high-frequency traders. Crypto exchanges operate 24/7, offering higher volatility and fewer regulatory constraints—ideal conditions for algorithmic strategies. Firms now deploy HFT systems in Bitcoin, Ethereum, and DeFi markets using similar latency-sensitive techniques as in equities or forex.
As tokenized assets and blockchain-based exchanges mature, HFT will play a central role in ensuring liquidity and price efficiency across decentralized markets.
6. Data is the New Edge
In modern HFT, access to superior data often determines success. The future of trading will revolve around alternative data—non-traditional sources such as satellite imagery, shipping data, social media sentiment, and even IoT sensors.
For example:
Monitoring car counts in retail parking lots to estimate sales.
Tracking weather patterns to predict commodity price movements.
Using real-time shipping data to forecast global supply trends.
Combining alternative data with AI allows traders to predict market movements before they appear on traditional indicators. In the coming years, the firms that master data fusion—the integration of structured and unstructured data—will dominate the HFT landscape.
7. Infrastructure Innovation: From Edge Computing to 5G
As markets globalize, latency reduction extends beyond fiber optics. Future HFT infrastructures will likely leverage edge computing, 5G connectivity, and satellite-based communication systems to push execution times closer to real-time.
Edge computing allows algorithms to run geographically closer to data sources—whether stock exchanges or crypto nodes—minimizing transmission delays. Similarly, 5G networks offer sub-millisecond latency and high reliability, unlocking new opportunities for algorithmic trading in mobile and IoT-enabled environments.
Such infrastructure advancements will also democratize HFT, allowing smaller firms to compete without massive investments in traditional data centers.
8. Human Traders in an Algorithmic World
As algorithms dominate, what happens to human traders? While automation has replaced much of manual execution, humans remain critical in designing, supervising, and ethically guiding trading systems.
In the future, human expertise will shift from execution to oversight and creativity:
Developing novel trading logic and hybrid strategies.
Overseeing risk management systems.
Ensuring compliance with regulatory and ethical standards.
The most successful firms will be those that combine human intuition with machine precision—a symbiosis rather than competition.
9. Challenges Ahead: Risk, Saturation, and Market Fragmentation
Despite its advantages, the HFT ecosystem faces significant challenges:
Market Saturation: With thousands of algorithms competing, profit margins per trade are shrinking.
Systemic Risk: Complex inter-algorithm interactions can amplify volatility, as seen during flash crashes.
Cybersecurity Threats: As trading systems become more connected, they also become more vulnerable to hacking and data breaches.
Future resilience will depend on developing robust, self-correcting systems capable of detecting and neutralizing unintended market feedback loops in real time.
10. The Road Ahead: A Smarter, Faster, Fairer Market
The future of HFT lies not in unrestrained speed but in intelligent automation, ethical oversight, and technological balance. As AI and quantum computing push the boundaries of possibility, the financial ecosystem must ensure that innovation does not compromise stability.
Regulators, exchanges, and traders will need to collaborate to create a framework where automation enhances efficiency while maintaining transparency and fairness.
In short, the next generation of high-frequency trading will be:
Smarter — driven by AI and predictive analytics.
Faster — with quantum and edge technologies.
Safer — through regulation, ethics, and human oversight.
The story of HFT is far from over—it’s merely entering its next, most intelligent chapter.

Knowledge of Candle Pattern What a candlestick shows (quick)
Body = open → close (filled/green = close>open bullish, filled/red = close

Banknifty Premium ChartWhat is Option Premium?
It’s the cost of an option contract.
When you buy an option, you pay the premium upfront.
Example: If you buy a Call Option of Reliance ₹2800 at ₹50 premium — you pay ₹50 × lot size.
Who Receives It?
The option seller (writer) receives the premium income immediately when they sell (write) the option.

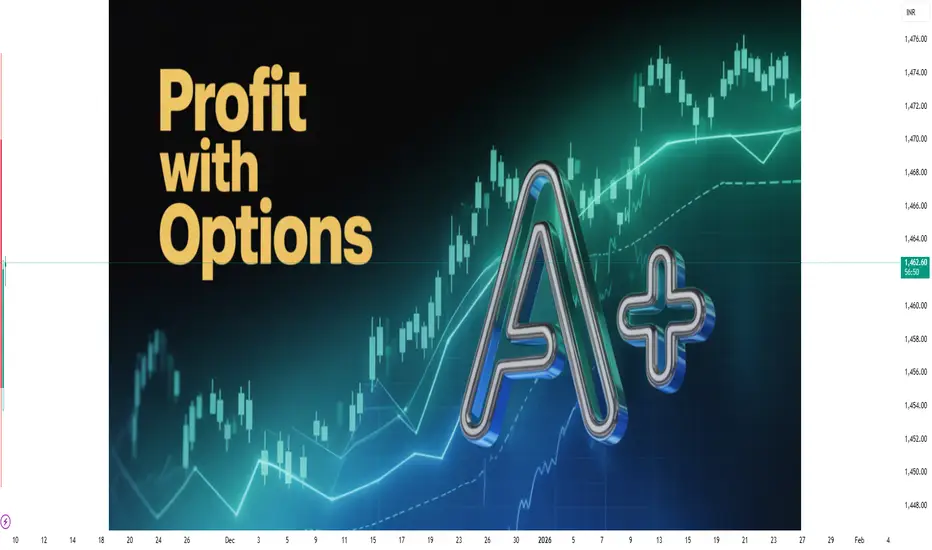
Part 4 Learn Institutional TradingAdvantages of Option Trading
Leverage:
Options allow control over large quantities of an asset with a small investment (premium). This magnifies potential profits.
Limited Risk for Buyers:
When buying options, the maximum loss is limited to the premium paid.
Hedging Capability:
Options can offset potential losses in the underlying portfolio.
Flexibility:
Options can be combined in various strategies to suit market outlooks—bullish, bearish, or neutral.
Multiple Strategies:
Options offer numerous strategies like straddles, strangles, spreads, collars, and iron condors, giving traders the ability to profit in different market conditions.

Part 3 Learn Institutional Trading Purpose of Option Trading
Option trading serves three main purposes:
Hedging (Risk Management):
Investors use options to protect their portfolios against adverse price movements. For instance, if you hold a stock, buying a put option acts as insurance—allowing you to sell the stock at a predetermined price even if the market crashes.
Speculation:
Traders use options to bet on future market direction. Options allow traders to gain exposure with limited capital, as the premium is usually a fraction of the asset’s full price.
Income Generation:
Investors can sell (write) options to earn premiums. For example, selling covered calls against owned stocks generates additional income, even if the stock price remains stable.

Part 1 Support and Resistance What Are Options?
An option is a financial contract between two parties: the buyer (also called the holder) and the seller (also called the writer). The buyer pays a premium to the seller in exchange for the right to buy or sell the underlying asset at a specified strike price before or on a specified expiration date.
There are two main types of options:
Call Option – gives the buyer the right to buy the underlying asset at the strike price.
Put Option – gives the buyer the right to sell the underlying asset at the strike price.

AI-Driven Economies: Boon or Inflation Trap?1. The Economic Boon of AI
a. Productivity Revolution
One of AI’s most powerful contributions lies in its ability to enhance productivity. Unlike previous technological shifts that replaced physical labor, AI enhances cognitive productivity. Algorithms can analyze massive datasets, make real-time decisions, and optimize operations that humans could never process at similar speed or accuracy.
For instance, AI-driven automation in manufacturing reduces downtime, minimizes errors, and lowers production costs. In the service sector, AI chatbots and recommendation engines improve customer experiences while cutting operational costs. As a result, output per worker increases — a key driver of GDP growth.
b. Innovation and New Industry Creation
AI is not just optimizing existing industries but creating entirely new ones. The rise of autonomous vehicles, robotics, healthcare analytics, and smart agriculture represents multibillion-dollar markets built around AI innovation. These new sectors attract massive investment, stimulate entrepreneurship, and create high-value jobs in data science, engineering, and software development.
The global AI market, projected to surpass $2 trillion by 2030, has become a cornerstone of modern industrial policy. Nations investing early in AI infrastructure, like the U.S., China, and India, are positioning themselves as leaders in the next phase of the digital economy.
c. Efficiency in Resource Allocation
AI systems enable more efficient use of resources — energy, raw materials, and capital. In agriculture, AI optimizes irrigation and fertilizer use; in finance, it reduces bad loans through predictive risk models; and in logistics, it minimizes fuel consumption by optimizing routes. These efficiencies reduce costs and environmental impact simultaneously — a win-win scenario for businesses and governments alike.
d. Deflationary Forces in the Short Term
Interestingly, AI can initially act as a deflationary force. As automation increases, the cost of goods and services tends to drop because of higher productivity and lower labor costs. For example, AI-driven manufacturing allows companies to produce more at lower costs, passing savings on to consumers. This short-term price stability often supports economic expansion and higher consumer spending.
2. The Inflation Trap: Hidden Risks of AI-Driven Economies
While the short-term gains from AI appear promising, long-term structural challenges could create inflationary pressures and social imbalances.
a. Unequal Distribution of Wealth
AI-driven productivity gains do not always benefit everyone equally. Large corporations that own AI technologies and data infrastructure accumulate significant economic power, while smaller firms and low-skilled workers struggle to keep up. This wealth concentration leads to income inequality, which indirectly fuels inflationary cycles.
When profits are concentrated in a few hands, consumer demand may become skewed — luxury goods prices rise, while basic goods and wages stagnate. As the middle class shrinks, governments may increase fiscal spending and social programs to stabilize consumption, adding inflationary pressure to the system.
b. Wage Polarization and Cost-Push Inflation
AI often automates repetitive, low-skill jobs while creating demand for high-skill technical roles. This “job polarization” leads to wage growth at the top and stagnation at the bottom. Over time, this could produce cost-push inflation, especially in sectors like healthcare, education, and housing — where human labor remains essential and costs cannot easily be automated.
Moreover, displaced workers may require retraining or government support, which increases fiscal spending. This government-driven stimulus, though necessary, can also be inflationary if not managed carefully.
c. Overreliance on Technology and Supply Constraints
AI systems depend on complex supply chains — semiconductors, rare earth elements, and high computing infrastructure. If supply disruptions occur (like during the 2020–2022 global chip shortage), the cost of AI deployment could spike dramatically. Such shortages can trigger supply-side inflation, as companies raise prices to offset rising input costs.
d. Productivity Paradox and the Lag Effect
Historically, major technological innovations take years to translate into widespread productivity gains. While AI promises long-term efficiency, short-term disruptions — such as job losses, retraining costs, and restructuring — can slow growth. If governments and central banks anticipate faster gains than reality delivers, they may overstimulate the economy through loose monetary or fiscal policy, unintentionally fueling inflation.
e. Data Monopoly and Market Power
Another inflationary risk comes from AI-driven monopolies. As large tech firms dominate AI data and computing ecosystems, competition declines. With fewer players controlling markets, they gain pricing power. For instance, if a handful of companies control AI chips or cloud computing, they can increase prices with little resistance — embedding inflation within critical digital infrastructure.
3. The Policy Balancing Act
The challenge for policymakers is to harness AI’s growth potential without allowing it to destabilize inflation and inequality.
a. Investing in Human Capital
Education and reskilling programs are essential to help workers adapt to AI-driven changes. By closing the skill gap, governments can prevent mass unemployment and wage stagnation — two key sources of inflationary pressure. Encouraging AI literacy at all education levels ensures that the workforce evolves alongside technology.
b. Strengthening Competition and Regulation
To prevent monopolistic practices, policymakers must enforce antitrust laws and promote open data ecosystems. Encouraging small and medium enterprises (SMEs) to adopt AI through subsidies or shared platforms can democratize productivity gains, spreading benefits more evenly across the economy.
c. Smart Monetary Policy
Central banks face a unique challenge: distinguishing between AI-driven deflation (from productivity) and AI-driven inflation (from inequality or bottlenecks). Adaptive monetary policies — including real-time data analysis powered by AI itself — could help maintain balance.
d. Sustainable AI Infrastructure
AI consumes significant energy and computing resources. Building green, efficient data centers and investing in renewable energy reduces the risk of cost-driven inflation tied to energy usage.
4. The Long-Term Outlook
If managed wisely, AI could usher in a new era of sustainable, inclusive growth. Imagine economies where AI predicts demand accurately, minimizes waste, and boosts productivity across industries — from healthcare diagnostics to energy optimization. However, without careful regulation and equitable access, AI could deepen divides, distort price structures, and trap economies in persistent inflation.
The real test will be governance — how nations balance innovation with fairness. Economies that combine AI adoption with strong education systems, ethical regulation, and transparent competition policies will likely emerge as winners. Those that allow monopolies, inequality, and resource inefficiencies to spread may find themselves facing an inflationary storm masked as progress.
Conclusion
AI-driven economies are neither pure blessings nor inherent traps — they are complex ecosystems shaped by human choices. Artificial Intelligence can unlock enormous wealth and efficiency, but it can also magnify inflationary risks if benefits are unevenly distributed or poorly regulated.
The future of AI in economics depends not only on technological progress but on policy foresight. Governments, corporations, and societies must collaborate to ensure that AI serves as a tool for inclusive growth rather than a catalyst for inflationary instability. The question, therefore, is not whether AI will reshape economies — it already is — but whether we can guide its power wisely enough to ensure prosperity without falling into the inflation trap.

Understanding How Options Work: Calls and Puts Simplified1. What Are Options?
An option is a type of financial contract that gives the buyer the right, but not the obligation, to buy or sell an underlying asset (like a stock, index, or commodity) at a predetermined price (called the strike price) before or on a specific date (called the expiration date).
Think of options as insurance contracts — they allow you to protect, speculate, or leverage your positions in the market.
The buyer of the option pays a premium (price of the option).
The seller (also called the writer) receives this premium and is obligated to fulfill the contract if the buyer decides to exercise it.
There are two types of options:
Call Option – the right to buy an asset.
Put Option – the right to sell an asset.
2. Call Options Explained (The Right to Buy)
A call option gives the buyer the right to buy an underlying asset at the strike price within a certain period.
Let’s take an example:
Suppose Stock A is trading at ₹100. You buy a call option with a strike price of ₹105 for a premium of ₹3, expiring in one month.
This means:
You pay ₹3 per share for the right to buy Stock A at ₹105 any time before expiry.
If the stock price rises above ₹105, your option gains value because you can buy at ₹105 while the market price is higher.
Scenario 1: Stock goes up to ₹115 before expiry.
You can buy at ₹105 and immediately sell at ₹115 — making a profit of ₹10.
Your net profit = ₹10 (gain) - ₹3 (premium) = ₹7 per share.
Scenario 2: Stock stays below ₹105.
Your option is out of the money (no advantage in exercising it).
You lose only the premium paid (₹3).
So, a call option benefits from rising prices.
3. Put Options Explained (The Right to Sell)
A put option gives the buyer the right to sell an underlying asset at the strike price within a certain period.
Example:
Stock B is trading at ₹100. You buy a put option with a strike price of ₹95 for a premium of ₹2.
This means you have the right to sell Stock B at ₹95 even if the price falls.
Scenario 1: Stock falls to ₹85 before expiry.
You can sell at ₹95 while the market price is ₹85 — gaining ₹10.
Your net profit = ₹10 (gain) - ₹2 (premium) = ₹8 per share.
Scenario 2: Stock stays above ₹95.
You wouldn’t exercise your right to sell at ₹95 when the market offers ₹100.
You lose only the premium (₹2).
So, a put option benefits from falling prices.
4. Understanding Option Premiums
The premium is the price of the option, and it consists of two parts:
Intrinsic Value:
The amount by which an option is in the money.
For a call: Intrinsic Value = Current Price - Strike Price
For a put: Intrinsic Value = Strike Price - Current Price
Time Value:
Extra value because there’s still time left before expiration.
The longer the time to expiry, the higher the premium.
Example: If a call option on Stock A (price ₹110) has a strike of ₹100, it’s already ₹10 in the money. If the premium is ₹12, then ₹10 is intrinsic value and ₹2 is time value.
5. How Option Sellers Make Money
While buyers pay the premium and hope the market moves in their favor, option sellers profit if the market doesn’t move much.
Call Seller (Writer): Hopes the price stays below the strike price.
Put Seller (Writer): Hopes the price stays above the strike price.
If the option expires worthless, the seller keeps the entire premium. However, sellers face unlimited potential losses if the market moves sharply against them — which is why writing options requires higher margin and risk management.
6. Why Traders Use Options
Options are powerful because they offer multiple strategic uses:
a. Hedging (Protection)
Investors use options to protect existing positions.
Example: If you own a stock at ₹100 and fear a short-term decline, you can buy a put option at ₹95. If the stock falls, your put gains, offsetting the loss.
b. Speculation
Traders buy calls if they expect prices to rise or puts if they expect prices to fall. Because options cost less than the actual stock, they allow for higher leverage — magnifying potential returns.
c. Income Generation
Experienced traders sell (write) options to earn premiums, especially in sideways markets. Covered call writing and cash-secured puts are popular income strategies.
7. Option Moneyness: In, At, and Out of the Money
Understanding an option’s moneyness helps evaluate its worth.
In the Money (ITM): Already profitable if exercised.
Call: Market Price > Strike Price
Put: Market Price < Strike Price
At the Money (ATM): Market Price = Strike Price
Out of the Money (OTM): Not profitable if exercised.
Call: Market Price < Strike Price
Put: Market Price > Strike Price
For example, if a stock trades at ₹100:
₹90 call = ITM
₹100 call = ATM
₹110 call = OTM
8. Expiration and Time Decay (Theta Effect)
Every option has an expiration date — after which it becomes worthless.
As time passes, the time value portion of the premium decreases — this is known as time decay or theta.
Time decay accelerates as the option nears expiry. That’s why buyers usually prefer longer durations (more time value), while sellers prefer shorter ones (faster decay).
9. Risk and Reward Profile
Here’s how the payoff works for each type:
Call Buyer: Unlimited profit (as price rises), limited loss (premium).
Call Seller: Limited profit (premium), unlimited loss (if price soars).
Put Buyer: High profit (as price falls), limited loss (premium).
Put Seller: Limited profit (premium), high loss (if price crashes).
This asymmetry is what makes options both powerful and risky.
10. Real-World Example: A Simplified Scenario
Let’s take a complete example:
You believe Reliance Industries (trading at ₹2500) will rise. You buy a call option with a strike of ₹2550, paying ₹40 premium.
If Reliance rises to ₹2650 → Gain = ₹100 - ₹40 = ₹60 profit.
If Reliance stays below ₹2550 → Option expires worthless → Loss = ₹40.
Alternatively, if you think it will fall, you buy a put option with a strike of ₹2450 for ₹35.
If Reliance drops to ₹2350 → Gain = ₹100 - ₹35 = ₹65 profit.
If it stays above ₹2450 → Option expires worthless → Loss = ₹35.
11. Why Understanding Calls and Puts Matters
Options aren’t just tools for speculation — they’re also essential for managing market exposure and improving portfolio efficiency. Once you understand the behavior of calls and puts, you can combine them into advanced strategies like spreads, straddles, or iron condors — each designed for specific market outlooks.
12. Conclusion: Simplifying the Power of Options
At their core, call and put options are about flexibility. They allow you to control an asset without necessarily owning it, limit your downside while amplifying your upside, and customize your market exposure.
Call = Right to Buy (Bullish tool)
Put = Right to Sell (Bearish tool)
By mastering these basics, you lay the foundation for smarter trading decisions — whether your goal is profit, protection, or passive income. In the world of finance, knowledge of options doesn’t just open doors; it gives you the power to design your own opportunities.
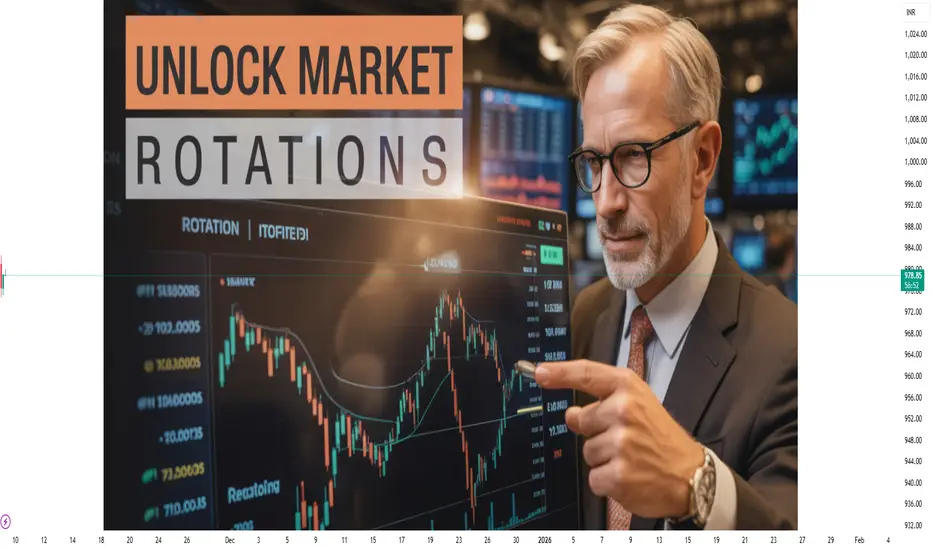
Why Market Rotations Matter for Every Trader and Investor1. What Is Market Rotation?
Market rotation refers to the flow of money between different sectors, asset classes, or investment themes over time. It happens as investors shift their capital based on changing economic conditions, interest rates, inflation expectations, or risk appetite.
For example, during periods of economic recovery, investors often move money into cyclical sectors like banking, manufacturing, and real estate. In contrast, when the economy slows, funds often rotate into defensive sectors like healthcare, consumer staples, or utilities that provide stable earnings regardless of the cycle.
At its core, market rotation is like a dance — money never leaves the market entirely; it simply moves to where it expects the best performance next.
2. The Economic Cycle and Its Impact
Market rotations are deeply connected to the economic cycle, which includes four major phases: expansion, peak, contraction, and recovery.
Expansion: When growth is strong and confidence is high, investors prefer cyclical stocks like autos, financials, and industrials.
Peak: As the economy overheats, inflation rises, and interest rates climb, investors start trimming exposure to growth-heavy stocks.
Contraction: During slowdowns or recessions, investors seek safety in defensive sectors such as utilities, FMCG, and healthcare.
Recovery: When conditions improve again, capital flows back into riskier assets, including technology and small caps.
Recognizing where we are in the economic cycle helps traders and investors anticipate which sectors will lead and which will lag, improving portfolio allocation and timing.
3. Sector Rotation – The Heart of Market Dynamics
Sector rotation is one of the most visible forms of market rotation. It reflects how investors reallocate funds among various industries to capture relative strength.
For example:
When interest rates rise, banks and financials tend to benefit from higher lending margins.
When commodity prices surge, energy and metal stocks often outperform.
When technology innovation dominates, IT and digital sectors lead the charge.
Smart investors track sector rotation through indicators like the Relative Strength Index (RSI), moving averages, or relative performance charts to identify which areas of the market are gaining momentum.
Understanding sector rotation allows traders to be “in the right place at the right time,” maximizing returns while minimizing exposure to lagging industries.
4. Style Rotation – Growth vs. Value
Market rotations don’t only happen between sectors; they also occur between investment styles — primarily growth and value.
Growth stocks (like tech companies) thrive when the economy is expanding and interest rates are low.
Value stocks (like traditional industrials or financials) perform better when inflation and interest rates rise.
During the 2010s, growth stocks led global markets as central banks kept interest rates near zero. However, as inflation spiked post-2020, value sectors like energy and banking began to outperform.
Recognizing when the market is shifting from growth to value (or vice versa) helps traders realign portfolios early and avoid being caught on the wrong side of market trends.
5. Asset Rotation – Beyond Stocks
Market rotation also extends across asset classes. Investors move funds between equities, bonds, commodities, and even cash depending on macroeconomic trends.
For example:
When inflation rises, money often flows out of bonds (which lose value as yields rise) and into commodities like gold or oil.
During uncertainty, capital moves out of equities and into safe-haven assets like the U.S. dollar or government bonds.
When global liquidity improves, funds rotate back into risk assets like emerging markets and small caps.
For traders, tracking these inter-asset flows provides early signals of broader market shifts and risk sentiment changes.
6. How Traders Can Profit from Market Rotations
For traders, identifying early signs of sector or asset rotation can open up opportunities for high-probability trades.
Use volume and price action to detect institutional money flow. Rising volume in a sector ETF or leading stock often indicates the start of a rotation.
Track leadership changes: If defensive sectors start outperforming, it may signal risk aversion and potential correction.
Combine technical and fundamental signals: For example, use breakout patterns along with macro cues like inflation data or rate hikes.
Rotations often begin before the broader market realizes it, so being early gives traders a decisive advantage.
7. Long-Term Investors: Why It Matters Even More
Long-term investors benefit immensely from recognizing market rotations. Allocating capital to leading sectors during each stage of the economic cycle can dramatically enhance portfolio returns and stability.
For instance:
During recoveries, investors can overweight cyclicals and small caps.
As the economy matures, shift to growth and technology.
During downturns, emphasize defensives and high-dividend stocks.
This proactive rebalancing approach not only boosts returns but also reduces drawdowns during turbulent markets. In short, understanding rotations leads to smarter asset allocation and compounding performance.
8. Tools and Indicators to Track Rotations
A few popular tools and indicators can help identify market rotations early:
Relative Rotation Graphs (RRG): Visually map sector momentum and relative strength.
ETF Flows: Track where institutional money is moving through sector ETFs.
Breadth Indicators: Monitor how many stocks are participating in rallies or declines.
Volume Profile & Market Structure: Analyze how institutional volume shifts across price levels and sectors.
By combining these tools with macro awareness, investors can stay aligned with the flow of capital — the real engine of market performance.
9. Common Mistakes Traders Make During Rotations
Many traders and investors fail to recognize market rotations until it’s too late. Here are common pitfalls:
Chasing past winners: Buying tech at the top while money rotates to energy or value stocks.
Ignoring macro trends: Overlooking interest rate changes or inflation data that trigger sector shifts.
Emotional bias: Staying loyal to a sector even when it loses relative strength.
Avoiding these mistakes requires discipline, regular analysis, and the flexibility to adapt your strategy when the market narrative changes.
10. The Bottom Line – Follow the Flow, Not the Noise
Market rotations aren’t just another trading concept — they are the heartbeat of market behavior. They reveal where big money is moving and why. Whether you’re managing a short-term portfolio or building long-term wealth, understanding rotations helps you:
Anticipate market trends
Position in leading sectors early
Manage risk more effectively
Capture outsized returns through strategic allocation
In the end, successful trading and investing come down to aligning with where capital is flowing next — not where it has been. By mastering market rotations, you move from reacting to trends to predicting and profiting from them.
Part 1 Ride The Big Moves How Option Trading Works
Option trading involves four basic positions:
Buy Call (Long Call): The trader expects the underlying asset’s price to rise.
Sell Call (Short Call): The trader expects the price to stay the same or fall.
Buy Put (Long Put): The trader expects the underlying asset’s price to fall.
Sell Put (Short Put): The trader expects the price to stay the same or rise.
For example, if a trader buys a call option on a stock with a strike price of ₹100 and pays a premium of ₹5, they have the right to buy the stock at ₹100 even if it rises to ₹120. In this case, their profit per share would be ₹15 (₹120 - ₹100 - ₹5). However, if the stock remains below ₹100, they would not exercise the option and would lose only the premium of ₹5.

Part 2 Support and Reistance Key Terminology in Option Trading
Before diving deeper, it’s important to understand the essential terms used in option trading:
Strike Price: The fixed price at which the holder can buy (call) or sell (put) the underlying asset.
Premium: The price paid by the option buyer to the seller for the contract.
Expiration Date: The date on which the option contract expires. After this date, the option becomes worthless if not exercised.
In-the-Money (ITM): A call option is ITM when the underlying price is above the strike price; a put option is ITM when the underlying price is below the strike price.
Out-of-the-Money (OTM): A call option is OTM when the underlying price is below the strike price; a put option is OTM when the underlying price is above the strike price.
At-the-Money (ATM): When the underlying asset price equals the strike price.
Underlying Asset: The financial instrument (stock, index, currency, or commodity) on which the option is based.

Part 2 Ride The Big Moves How Option Prices Are Determined
Option prices are influenced by several factors. The most common model used to calculate the theoretical value of an option is the Black-Scholes Model. The key factors that affect option prices include:
Underlying Asset Price: The higher the price of the asset, the higher the value of a call option and the lower the value of a put option.
Strike Price: The difference between the strike and current market price affects the intrinsic value of the option.
Time to Expiration: The more time left until expiration, the higher the premium (because there’s more time for the option to become profitable).
Volatility: Higher volatility increases option premiums since the chance of large price movement rises.
Interest Rates and Dividends: These can slightly influence option values, especially for longer-term options.

Premium Charts Tips for Successful Option Trading
Master the basics before applying advanced strategies.
Analyze market trends, OI data, and IV regularly.
Use proper risk management—never risk more than 1–2% of capital per trade.
Avoid trading near major events (earnings, RBI policy) unless experienced.
Keep learning through backtesting and continuous strategy refinement.

Part 12 Trading Masster ClassOption Trading in India
In India, options are traded on exchanges like the NSE (National Stock Exchange) and BSE (Bombay Stock Exchange). The most active instruments include NIFTY, BANKNIFTY, and FINNIFTY indices, as well as popular stocks like Reliance, TCS, and HDFC Bank.
Indian traders have access to weekly and monthly expiries, providing short-term opportunities. SEBI regulates derivatives trading to ensure transparency and protect investors. Margin requirements, contract sizes, and position limits are predefined to manage systemic risk.

Part 11 Trading Masster ClassRole of Implied Volatility (IV) and Open Interest (OI)
Implied Volatility (IV): Indicates expected market volatility. Rising IV increases option premiums. Traders buy options during low IV and sell during high IV.
Open Interest (OI): Reflects the number of outstanding option contracts. Rising OI with price indicates strong trend confirmation, while divergence signals reversals.
These metrics help traders assess market sentiment and build informed positions.

Part 10 Trade Like InstitutionsOption Buying vs. Option Selling
Option Buyers have limited risk (premium paid) and unlimited potential profit. However, time decay works against them as Theta reduces the option’s value daily.
Option Sellers (Writers) have limited profit (premium received) but potentially unlimited risk. Sellers benefit from time decay and stable markets.
In the Indian market, most professional traders and institutions prefer option selling due to the high success rate when markets remain range-bound.

Pat 9 Tradig Master ClassThe Greeks in Options
The Greeks measure the sensitivity of an option’s price to various factors:
Delta: Measures how much the option’s price changes for a ₹1 move in the underlying asset.
Gamma: Measures the rate of change of delta; it helps traders understand how delta will change as the market moves.
Theta: Measures time decay—how much the option loses value each day as expiration approaches.
Vega: Measures sensitivity to volatility changes.
Rho: Measures sensitivity to interest rate changes.
Understanding these helps traders manage risk and create balanced strategies.

Part 8 Trading Master ClassOption Pricing
Option prices depend on several factors, collectively described by the Black-Scholes model. The main components are:
Underlying price: The current price of the stock or index.
Strike price: Determines whether the option is ITM, ATM, or OTM.
Time to expiration: Longer duration means higher premium, as there’s more time for the market to move favorably.
Volatility: Higher volatility increases premium since price movements are more unpredictable.
Interest rates and dividends: These have smaller effects but are still part of option pricing.
The relationship between these factors is known as the “Greeks.”

Part 7 Trading Master ClassBasic Terminology
To understand option trading, one must know a few key terms:
Strike Price: The price at which the underlying asset can be bought (call) or sold (put).
Premium: The price paid by the buyer to the seller for the option contract.
Expiration Date: The date on which the option contract expires. In India, options typically expire every Thursday (for weekly options) or the last Thursday of the month (for monthly options).
In-the-Money (ITM): A call option is ITM when the market price is above the strike price; a put option is ITM when the market price is below the strike price.
Out-of-the-Money (OTM): A call is OTM when the market price is below the strike, and a put is OTM when the market price is above the strike.
At-the-Money (ATM): When the market price and strike price are roughly equal.

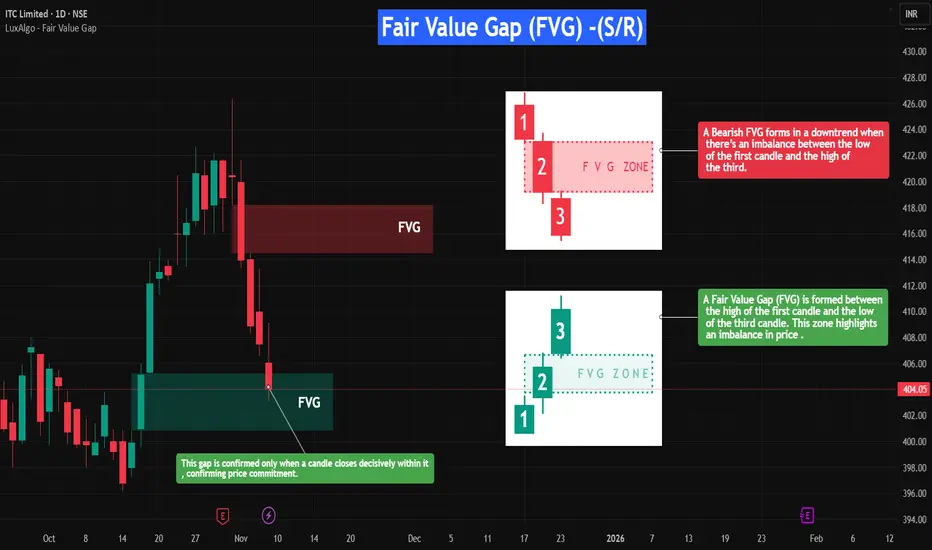
Fair Value Gap (FVG) — Support and Resistance (S/R)🔎 Overview
The Fair Value Gap (FVG) is a unique price imbalance or inefficiency on a price chart where the market rapidly moves, leaving one or more candles without overlapping wicks between highs and lows.
This signifies aggressive buying or selling, resulting in a “gap” of untraded prices.
Once spotted, FVGs often act as magnets, drawing price back to fill the gap — and later serve as dynamic support or resistance zones, depending on the market direction.
⸻⸻⸻⸻⸻⸻⸻⸻⸻⸻
📔 Concept
A Fair Value Gap forms when:
1️⃣ Resistance FVG -- A strong impulsive move causes the low of the first candle and the high of the third candle (in a three-candle sequence) to fail to overlap, leaving a visible gap.
2️⃣ Support FVG -- A strong impulsive move causes the high of the first candle and the low of the third candle (in a three-candle sequence) to fail to overlap, leaving a visible gap.
3️⃣ Imbalance -- This gap highlights an area where orders were skipped, signaling an imbalance between buyers and sellers.
4️⃣ Rebalance -- When revisited, a Bullish FVG often acts as support, while a Bearish FVG acts as resistance, as price reacts to rebalance the inefficiency before the trend continues.
⸻⸻⸻⸻⸻⸻⸻⸻⸻⸻
📌 How to Use
✅ Validation → A valid FVG exists as long as the gap remains unfilled, and traders watch for price to revisit and react to it.
🟩 Bullish FVG → Support: When price retraces into the gap and finds buying interest, the zone holds as support.
🔴 Bearish FVG → Resistance: When price rallies into a bearish gap and faces rejection, the zone holds as resistance.
❌ Devalidation → If price decisively closes inside the FVG, the gap is considered “filled,” and the setup loses significance.
Typically, the lowest unfilled bullish FVG below price in an uptrend (and the highest bearish FVG above in a downtrend) carries more weight and is prioritized for confluence.
⸻⸻⸻⸻⸻⸻⸻⸻⸻⸻
📊 Chart Explanation
Symbol → NSE:ITC
Timeframe → 1D
On the right-hand side, the Fair Value Gaps (FVGs) are illustrated in detail to give a closer look at how they form and function.
These visual examples explain how FVGs represent price inefficiencies — zones that later act as dynamic support or resistance once price revisits them.
On the left-hand side, you can see real-time examples of FVGs forming within live price action.
When a candle closes decisively inside a bullish FVG, it confirms price commitment, allowing the zone to act as support and potentially propel price upward.(These are plotted using open sourced indicator )
This setup beautifully demonstrates how understanding FVG structure helps identify high-probability reaction zones where the market seeks to rebalance itself.
⸻⸻⸻⸻⸻⸻⸻⸻⸻⸻
👀 Observation
Fair Value Gaps work best in volatile markets or during strong impulsive moves.
When price revisits an unfilled gap, the reaction helps define new support or resistance.
Combining FVGs with key structural levels, volume analysis, or momentum indicators (like RSI or Moving Averages) improves reliability.
Always prioritize clean, unfilled gaps aligned with the trend direction for higher conviction.
⸻⸻⸻⸻⸻⸻⸻⸻⸻⸻
💡 Conclusion
The Fair Value Gap not only signals where the market may “rebalance” itself after price inefficiencies but also identifies potential support and resistance zones.
Recognizing how bullish and bearish FVGs interact with price allows traders to anticipate reactions, manage risk, and refine entries and targets with greater accuracy.
⸻⸻⸻⸻⸻⸻⸻⸻⸻⸻
⚠️ Disclaimer
📘 For educational purposes only.
🙅 Not SEBI registered.
❌ Not a buy/sell recommendation.
🧠 Purely a learning resource.
📊 Not Financial Advice.
Advanced Chart Patterns in Technical Analysis1. Introduction to Advanced Chart Patterns
In trading, patterns repeat because human behavior is repetitive. Fear, greed, and hope drive market movements, and these emotions get imprinted in price charts. Advanced chart patterns are an extension of classical technical formations, combining structure, volume, and momentum to forecast price trends. Mastering them helps traders differentiate between false breakouts and genuine opportunities.
Advanced patterns generally fall into two main categories:
Continuation Patterns – Indicating a pause before the prevailing trend continues.
Reversal Patterns – Signaling the end of a trend and the beginning of a new one.
2. Head and Shoulders (Reversal Pattern)
The Head and Shoulders pattern is one of the most reliable reversal signals. It indicates a change in trend direction — from bullish to bearish (standard form) or from bearish to bullish (inverse form).
Structure:
Left shoulder: A price rise followed by a decline.
Head: A higher peak than the left shoulder, followed by another decline.
Right shoulder: A lower rise, followed by a breakdown through the neckline.
Neckline: Connects the lows between the shoulders and serves as a key breakout level.
Once the price breaks below the neckline, it confirms a bearish reversal. The target is estimated by measuring the distance from the head to the neckline and projecting it downward.
Inverse Head and Shoulders works similarly but in the opposite direction — signaling a bullish reversal after a downtrend.
3. Cup and Handle Pattern
The Cup and Handle is a bullish continuation pattern resembling a teacup. It was popularized by William O’Neil in his book How to Make Money in Stocks.
Formation:
Cup: A rounded bottom, showing a gradual shift from selling to buying.
Handle: A short pullback or consolidation that follows the cup, forming a downward-sloping channel.
When the price breaks above the handle’s resistance with strong volume, it often signals a continuation of the prior uptrend.
Target: The depth of the cup added to the breakout point.
This pattern is often seen in growth stocks and long-term bullish markets.
4. Double Top and Double Bottom
These patterns are classic but essential to advanced technical traders due to their reliability and frequency.
Double Top:
Appears after a strong uptrend.
Price makes two peaks at similar levels separated by a moderate decline.
A breakdown below the “neckline” confirms a bearish reversal.
Double Bottom:
Appears after a downtrend.
Two troughs form around the same level with a peak in between.
A breakout above the neckline signals a bullish reversal.
Volume confirmation is crucial — rising volume on the breakout adds credibility to the pattern.
5. Flag and Pennant Patterns
Flags and Pennants are short-term continuation patterns that often appear after a strong price movement, known as the “flagpole.”
Flag: Forms as a small rectangular channel sloping against the main trend.
Pennant: Appears as a small symmetrical triangle following a sharp move.
These patterns typically consolidate the market before the next strong move in the same direction.
Breakout Rule:
When price breaks in the direction of the previous trend, accompanied by high volume, it confirms continuation.
Target Projection:
Length of the flagpole added to the breakout point.
6. Wedge Patterns
Wedges are advanced chart patterns signaling either continuation or reversal depending on their position and direction.
Rising Wedge:
Forms when price makes higher highs and higher lows, but the slope narrows upward.
Typically appears in an uptrend and indicates weakening bullish momentum — a bearish reversal signal.
Falling Wedge:
Forms with lower highs and lower lows converging downward.
Usually appears in a downtrend, indicating a potential bullish reversal.
Volume generally declines during formation and expands during breakout, confirming the move.
7. Symmetrical, Ascending, and Descending Triangles
Triangles represent consolidation phases and serve as reliable continuation patterns.
Symmetrical Triangle:
Characterized by converging trendlines with no clear direction bias.
Breakout direction typically follows the prior trend.
Ascending Triangle:
Horizontal resistance with rising support.
Usually forms during an uptrend, signaling bullish continuation.
Descending Triangle:
Horizontal support with declining resistance.
Typically bearish, indicating continuation of a downtrend.
Triangles are volume-sensitive patterns — declining volume during formation and surge during breakout strengthens reliability.
8. Rectangle Pattern
A Rectangle or Trading Range represents a period of indecision between buyers and sellers.
Formation: Price oscillates between horizontal support and resistance.
Interpretation:
Breakout above resistance → bullish signal.
Breakdown below support → bearish signal.
Traders often trade within the rectangle until a confirmed breakout occurs, using stop-losses near the opposite boundary.
9. Diamond Pattern
The Diamond Top is an advanced reversal pattern that forms after a prolonged uptrend. It begins as a broadening formation (wider price swings) and ends with a narrowing triangle — resembling a diamond shape.
Indicates distribution and market exhaustion.
Once price breaks below the support line, it confirms a bearish reversal.
This pattern is rare but highly reliable when spotted correctly.
10. Harmonic Patterns (Advanced Category)
Harmonic patterns use Fibonacci ratios to predict potential reversals with high precision. These include Gartley, Bat, Butterfly, and Crab patterns.
Gartley Pattern: Indicates retracement within a trend, typically completing at the 78.6% Fibonacci level.
Bat Pattern: Uses deeper retracement levels (88.6%) to identify precise turning points.
Butterfly Pattern: Suggests a reversal near 127% or 161.8% Fibonacci extensions.
Crab Pattern: Known for extreme projections (up to 224% or more), signaling deep retracements.
These patterns require advanced understanding of Fibonacci tools and are used by professional traders for precision entries.
11. Rounding Bottom and Top
Rounding Bottom:
Gradual shift from bearish to bullish sentiment.
Indicates long-term accumulation before a breakout.
Typically seen in major trend reversals in large-cap stocks.
Rounding Top:
Slow shift from bullish to bearish sentiment.
Represents distribution and is often followed by a sustained downtrend.
These patterns form over long durations (weeks or months) and are reliable for positional traders.
12. Broadening Formation
Also known as a megaphone pattern, it shows increasing volatility and investor uncertainty.
Formation: Two diverging trendlines — one ascending, one descending.
Meaning: Early sign of market instability; may precede major reversals.
Trade Setup: Enter once a confirmed breakout occurs beyond the pattern boundaries.
13. Volume and Confirmation in Chart Patterns
Volume plays a critical role in confirming pattern validity. Key principles include:
Decreasing volume during consolidation or pattern formation.
Increasing volume during breakout, confirming institutional participation.
False breakouts often occur on low volume, trapping retail traders.
Combining volume indicators (like OBV or Volume Oscillator) with pattern analysis enhances accuracy.
14. Practical Application and Risk Management
Even the most reliable patterns fail without proper risk management and confirmation strategies.
Wait for breakout confirmation with candle close beyond key levels.
Use stop-loss slightly below support or above resistance.
Combine patterns with momentum indicators like RSI or MACD for confirmation.
Avoid overtrading; focus on quality setups with clear symmetry and volume validation.
15. Conclusion
Advanced chart patterns bridge the gap between price action and trader psychology. They help traders interpret market behavior and anticipate future movements with a structured approach. Patterns like the Cup and Handle, Head and Shoulders, and Wedges reveal not just the direction but also the strength and conviction of trends.
Mastering these patterns requires practice, discipline, and confirmation through indicators and volume. When used correctly, advanced chart patterns empower traders to make informed, high-probability decisions — transforming random price data into profitable trading opportunities.