A Comprehensive Guide to Managing Trading Risk1. Understanding Trading Risk
Trading risk refers to the possibility of losing part or all of the capital invested due to market movements, volatility, or other unforeseen events. Risk can be classified into different types:
Market Risk: The risk that market prices will move unfavorably.
Liquidity Risk: The inability to buy or sell an asset without causing significant price changes.
Credit Risk: The risk that a counterparty may fail to fulfill contractual obligations.
Operational Risk: Losses due to system failures, errors, or human mistakes.
Psychological Risk: Emotional decision-making leading to impulsive or irrational trades.
Understanding the type of risk you are exposed to is the first step toward controlling it.
2. Capital Allocation and Position Sizing
One of the most fundamental principles of risk management is controlling the amount of capital allocated to each trade. Traders often use position sizing to ensure that no single trade can significantly damage their portfolio.
Rule of Thumb: Risk no more than 1–2% of your total trading capital on a single trade. For example, if your capital is ₹1,00,000, your maximum loss per trade should be ₹1,000–₹2,000.
Position Size Formula: Position Size = (Capital at Risk) ÷ (Entry Price – Stop Loss Price). This ensures the risk is limited according to your strategy.
Proper capital allocation protects traders from catastrophic losses and allows them to stay in the game even during losing streaks.
3. Using Stop Losses
Stop-loss orders are essential tools for limiting losses. They automatically close a trade when the market moves against your position by a predetermined amount.
Fixed Stop Loss: A predetermined price level at which the trade will be closed.
Trailing Stop Loss: A dynamic stop loss that moves with favorable price movement, locking in profits while limiting downside.
Volatility-Based Stop Loss: Adjusts stop loss based on market volatility, often using indicators like Average True Range (ATR).
Stop losses remove the emotional component from trading decisions and prevent impulsive reactions during market swings.
4. Diversification
Diversification reduces the overall risk of a trading portfolio by spreading capital across multiple assets, sectors, or markets.
Asset Diversification: Trade in multiple asset classes like stocks, commodities, and forex.
Sector Diversification: Invest across different sectors (technology, healthcare, energy) to mitigate sector-specific risks.
Strategy Diversification: Use multiple trading strategies (trend-following, mean-reversion, scalping) to avoid over-reliance on a single approach.
Diversification reduces the probability that a single adverse market event will wipe out your capital.
5. Risk-Reward Ratio
Every trade carries both risk and potential reward. Maintaining a favorable risk-reward ratio is crucial for long-term profitability.
Definition: Risk-Reward Ratio = Potential Profit ÷ Potential Loss.
Recommended Ratio: Many professional traders aim for a minimum 1:2 ratio, meaning potential profit is at least twice the potential loss.
Even if a trader wins only 50% of trades, a favorable risk-reward ratio ensures profitability over time.
6. Use of Leverage with Caution
Leverage amplifies both gains and losses. While it allows traders to control large positions with limited capital, it can also lead to rapid account depletion if mismanaged.
Leverage Limits: Only use leverage that you can comfortably manage. Beginners should avoid high leverage entirely.
Margin Requirements: Always monitor margin requirements and avoid over-leveraging positions.
Responsible use of leverage is a critical aspect of risk management, especially in highly volatile markets like forex or derivatives.
7. Hedging Strategies
Hedging is a method of reducing exposure to adverse price movements by taking offsetting positions in correlated assets.
Options and Futures: Traders can hedge stock positions using put options or futures contracts.
Currency Hedging: Forex traders may hedge currency exposure to protect against exchange rate fluctuations.
Portfolio Hedging: Using ETFs or inverse instruments to mitigate overall portfolio risk.
While hedging can reduce risk, it also comes at a cost, so it should be applied judiciously.
8. Monitoring Market Conditions
Risk is not static—it fluctuates with market conditions. Traders should continuously monitor macroeconomic events, market news, and technical indicators to adjust their risk exposure.
Volatility Analysis: Use indicators like Bollinger Bands or ATR to measure market volatility.
Economic Events: Keep track of interest rate decisions, inflation data, earnings announcements, and geopolitical events.
Technical Signals: Use trendlines, moving averages, and support/resistance levels to identify potential risk zones.
Being proactive rather than reactive helps in managing risks more effectively.
9. Psychological Risk Management
Emotions can be a trader’s worst enemy. Fear and greed often lead to impulsive decisions that magnify risk.
Trading Plan: Have a detailed plan that includes entry, exit, and risk limits.
Discipline: Stick to your trading plan even during drawdowns.
Avoid Overtrading: Taking too many trades increases exposure to unnecessary risk.
Record Keeping: Maintain a trading journal to analyze mistakes and improve strategies.
Mental resilience and self-discipline are as important as technical risk controls.
10. Continuous Learning and Adaptation
Markets evolve, and strategies that worked in the past may not be effective in the future. Risk management requires constant learning and adaptation.
Backtesting: Test trading strategies on historical data to evaluate risk.
Simulation Trading: Practice with demo accounts to refine risk management without financial loss.
Stay Updated: Read financial news, follow market analysts, and keep learning about new risk management tools.
Continuous improvement ensures that traders adapt to changing market dynamics while protecting capital.
11. Emergency Risk Controls
Even with careful planning, unexpected events like market crashes, flash crashes, or broker failures can occur. Traders should implement emergency risk controls.
Circuit Breakers: Use automatic exit mechanisms during extreme volatility.
Diversified Brokers: Avoid keeping all funds with a single broker.
Insurance Products: Consider financial instruments or policies that protect against catastrophic losses.
Having contingency plans safeguards against black swan events and extreme losses.
Conclusion
Managing trading risk is not about eliminating it—it is about understanding, controlling, and mitigating it. Effective risk management allows traders to survive losing streaks, capitalize on opportunities, and maintain consistent growth. Key principles include prudent capital allocation, stop-loss usage, diversification, favorable risk-reward ratios, disciplined leverage, hedging, and psychological resilience. Continuous monitoring, adaptation, and emergency preparedness further enhance risk control.
Ultimately, the trader who masters risk management doesn’t merely seek profit but protects the most valuable asset: their capital. Profit is fleeting, but capital preservation ensures a seat at the market table for the long term. By integrating these principles into daily trading routines, traders can navigate the uncertain waters of financial markets with confidence and discipline.
Community ideas
Earnings Season TradingWhy Earnings Season Matters
Earnings reports influence stock prices more than most regular market events. The market is constantly pricing in expectations, and earnings represent the moment of truth—where expectations meet reality. If a company beats expectations (called an “earnings beat”), its stock often rallies. If the results disappoint (“earnings miss”), the stock may fall sharply. Additionally, future guidance—what the company predicts about its upcoming quarters—can be more important than the reported numbers themselves.
During earnings season, volumes rise, volatility spikes, and short-term price patterns become much more pronounced. This environment creates both high profit potential and equally high risk, making proper strategy essential.
Key Components of an Earnings Report
Understanding the report helps traders interpret market reactions. Earnings reports usually include:
1. Revenue (Top Line)
Indicates how much money the company generated from its primary business. Strong revenue growth usually signals product demand and market expansion.
2. Net Profit / EPS (Bottom Line)
Earnings per share (EPS) shows profitability per share. Analysts set EPS estimates, and beating or missing EPS forecasts strongly affects the stock price.
3. Operating Margins
Shows how efficiently a company manages costs. Even if revenue is strong, declining margins can cause the stock to fall.
4. Forward Guidance
This includes the company’s insight into future sales, demand, risks, and profitability. Sometimes a company beats current numbers but gives weak guidance, resulting in a price decline.
5. Management Commentary
Covers industry outlook, product pipeline, consumer behavior, macroeconomic impacts, and risk factors.
Why Trading During Earnings Season is Unique
Earnings season amplifies three types of moves:
1. Pre-Earnings Run-Up
Stocks sometimes rise in anticipation of strong results. This is driven by speculation, analyst commentary, or sector optimism.
2. Post-Earnings Reaction
Immediate moves occur within seconds of the results going public. High-frequency trading algorithms often react first.
3. After-Reaction Drift
Even after the initial spike, stocks frequently trend in the direction of the earnings surprise for several days.
These patterns create multiple trading opportunities depending on a trader’s risk appetite.
Popular Earnings Season Trading Strategies
1. Pre-Earnings Momentum Trading
Traders take positions before the results based on:
Recent stock performance
Market sentiment
Sector strength
Insider buying
Analyst upgrades
This strategy aims to capture the run-up but carries the risk of sharp reversals if the actual earnings disappoint.
Example:
Tech stocks often rally into earnings when demand for their products is strong. Traders ride this momentum and exit before the announcement.
2. Post-Earnings Gap Trading
When earnings are released, stocks often show large price gaps up or down. Traders analyze:
Gap size
Volume levels
Overall trend
Pre-market sentiment
They may buy strong gap-ups or short weak gap-downs once a clear trend forms.
3. Volatility Trading Using Options
Earnings increase implied volatility (IV), which inflates option premiums. Traders can take advantage through:
Straddles – betting on big moves in either direction
Strangles – cheaper version of straddles
Iron Condors – betting the stock will remain within a range
IV Crush Trading – betting that volatility will fall after earnings
Volatility trading is extremely popular because earnings produce predictable IV cycles.
4. Guidance-Based Trading
Sometimes the numbers look good but guidance is weak. Smart traders focus on what the company says about:
Future revenue
Interest-rate impact
Cost pressures
Demand changes
Currency effects
Sector slowdowns
Guidance often dictates the direction more strongly than current results.
5. Reaction Fade Strategy
If a stock moves too aggressively immediately after earnings, it sometimes “fades” the move later in the day.
This strategy relies on identifying overreactions.
How to Prepare for Earnings Season Trading
1. Study the Company’s History
Some companies consistently beat expectations (e.g., large tech firms), while others are inconsistent. Knowing historical patterns helps predict reactions.
2. Track Analyst Estimates
Earnings reactions depend on expectations, not just the absolute numbers. Sources include:
Consensus EPS
Revenue expectations
Whisper numbers (informal predictions)
A beat relative to analyst expectations is often more important than year-over-year growth.
3. Analyze Industry and Macro Trends
Earnings of companies in the same sector often follow patterns.
4. Look at Options Data
Option pricing reveals how much the market expects the stock to move.
5. Prepare Risk Management Rules
Due to high volatility, traders must:
Set stop losses
Avoid oversized positions
Manage leverage
Avoid emotional trades
Risks of Earnings Season Trading
While the profit potential is high, risks can be severe:
1. Large Gaps
Unexpected results can cause huge overnight price swings, wiping out positions.
2. IV Crush
Options lose value dramatically after earnings because volatility collapses.
3. Whipsaw Movements
Stocks may move violently in both directions before settling.
4. Market Overreaction
The market sometimes reacts emotionally rather than logically.
5. Liquidity Issues
Some stocks have wide bid-ask spreads during earnings, leading to poor fills.
Best Practices for Successful Earnings Trading
Trade liquid stocks with tight spreads.
Wait for the trend to form instead of jumping in immediately.
Avoid over-leveraging – earnings can break any prediction.
Read the press release and transcript for clarity on guidance.
Combine technical and fundamental analysis.
Don’t trade every earnings report – select only high-probability setups.
Track post-earnings drift for swing setups.
Conclusion
Earnings season trading is one of the most dynamic and opportunity-rich periods in the financial markets. The combination of heightened volatility, strong price movements, and emotionally driven reactions creates an environment ideal for active traders. However, the same factors that offer high profit potential also increase risk, making preparation, discipline, and risk management essential. By understanding earnings reports, analyzing expectations, and using clear trading strategies, traders can navigate earnings season with confidence and aim for consistent profitability.
Types of Financial Markets1. Capital Markets
Capital markets are long-term financial markets where instruments such as equities (shares) and long-term debt (bonds) are traded. These markets help businesses and governments raise funds for expansion, infrastructure, or other long-term projects.
a. Stock Market
The stock market enables companies to raise capital by issuing shares to investors. There are two segments:
Primary Market: Companies issue new shares for the first time through Initial Public Offerings (IPO). This is the market where securities are created.
Secondary Market: After issuance, shares are bought and sold among investors via stock exchanges like the NSE, BSE, NYSE, and NASDAQ.
Importance:
Provides companies with capital for expansion
Offers investors opportunities for wealth creation
Acts as a barometer of the economy
b. Bond Market
The bond market, also called the debt market, deals with the issuance and trading of bonds. These are typically issued by governments, corporations, or municipalities to borrow money.
Types of bonds include:
Government bonds
Corporate bonds
Municipal bonds
Convertible bonds
Role:
It offers stable returns, lower risk compared to equities, and is crucial for government financing.
2. Money Markets
Money markets deal with short-term debt instruments with maturities of less than one year. These markets help institutions manage short-term liquidity needs.
Instruments include:
Treasury bills (T-bills)
Commercial paper (CP)
Certificates of deposit (CDs)
Repurchase agreements (Repos)
Participants: Banks, financial institutions, corporations, mutual funds, and central banks.
Purpose:
To provide short-term funding, support liquidity, and stabilize the banking system.
3. Foreign Exchange (Forex) Market
The forex market is the world’s largest and most liquid financial market. It facilitates the global exchange of currencies.
Key features:
Operates 24/5 across global financial centers
Daily trading volume exceeds trillions of dollars
Involves participants like banks, hedge funds, corporations, retailers, and governments
Types of forex markets:
Spot Market: Immediate currency exchange
Forward Market: Future delivery at a pre-agreed rate
Futures Market: Standardized currency contracts traded on exchanges
Importance:
It enables international trade, investment flows, tourism, and global business operations.
4. Derivatives Markets
Derivatives markets trade financial contracts whose value is derived from an underlying asset—such as stocks, currencies, interest rates, or commodities.
Main derivative instruments:
Futures: Obligatory contracts to buy/sell assets at a future date
Options: Contracts giving the right but not the obligation to buy/sell
Swaps: Exchange of cash flows (e.g., interest rate swaps)
Forwards: Customized over-the-counter (OTC) contracts
Use cases:
Hedging risk (price risk, currency risk)
Speculation for profit
Arbitrage opportunities
Portfolio diversification
Derivative markets enhance liquidity and allow businesses to manage financial exposure efficiently.
5. Commodity Markets
Commodity markets deal with physical goods or raw materials such as:
Gold, silver
Crude oil, natural gas
Agricultural products (wheat, sugar, cotton)
Metals (aluminum, copper)
These commodities can be traded in two ways:
a. Spot Commodity Market
Immediate delivery and payment occur. Prices depend on real-time supply and demand.
b. Commodity Derivatives Market
Futures and options contracts allow traders to speculate or hedge commodity price fluctuations.
Importance:
Commodity markets help producers secure price stability and provide investors with opportunities beyond traditional financial assets.
6. Cryptocurrency and Digital Asset Markets
With rapid technological advancement, cryptocurrencies have created a new type of financial market. These markets trade digital tokens like Bitcoin, Ethereum, and thousands of altcoins.
Features:
Decentralized blockchain-based system
Trades through exchanges like Binance, Coinbase, and others
High volatility, high return potential
Instruments Include:
Spot trading
Futures and perpetual contracts
Staking and yield farming
Cryptocurrency markets are reshaping modern finance, introducing decentralized finance (DeFi), NFTs, and Web3 innovations.
7. Insurance Markets
Though not traditional trading markets, insurance markets play a crucial role in risk distribution. They allow individuals and businesses to transfer risks of financial loss to insurance companies.
Types of insurance markets:
Life insurance
Health insurance
Property and casualty insurance
Reinsurance
These markets support economic growth by offering financial protection and risk coverage.
8. Real Estate Markets
Real estate markets involve buying, selling, and leasing residential, commercial, and industrial properties.
Components:
Physical property market
Real estate investment trusts (REITs)
Mortgage-backed securities (MBS)
Real estate offers steady income through rent and long-term appreciation, making it a key investment category.
9. Credit Markets
Credit markets deal with borrowing and lending between parties. They include:
Bank loans
Credit lines
Mortgages
Consumer lending
These markets influence spending, investment, and economic growth by determining the availability and cost of credit.
10. Over-the-Counter (OTC) Markets
OTC markets involve decentralized trading without a centralized exchange. Participants trade directly through brokers or dealers.
Examples:
Currency forwards
Interest rate swaps
Corporate debt
Certain derivatives
OTC markets offer flexibility but carry higher counterparty risk.
11. Auction Markets
Auction markets match buyers and sellers by competitive bidding. The price is determined by supply and demand.
Examples:
Government bond auctions
Commodity auctions
IPO book-building auctions
These markets ensure transparency and fair price discovery.
Conclusion
Financial markets are diverse, interconnected systems that influence every part of the global economy. Each market—whether capital, money, forex, commodity, or derivatives—serves a unique role in facilitating investment, supporting business operations, managing risk, and driving economic growth. Understanding these markets helps investors, businesses, and policymakers make informed decisions. Together, these markets form the complex network through which money flows, value is created, and economies evolve.

Option Trading & Derivatives (F&O) Trading1. What Are Derivatives?
A derivative is a financial contract whose value is derived from an underlying asset. This underlying can be:
Stocks
Indices (Nifty, Bank Nifty)
Commodities
Currencies
Interest rates
Derivatives do not represent ownership of the underlying asset. Instead, they allow traders to speculate on price movements or hedge risks without directly buying the actual asset.
Why derivatives exist:
Hedging (Risk Management):
Businesses and traders use derivatives to protect against adverse price movements.
Speculation:
Traders can predict price moves and earn profits with relatively small capital (leverage).
Arbitrage:
Taking advantage of price differences across markets to generate risk-free returns.
2. What Is F&O Trading?
The F&O (Futures and Options) segment is the derivatives market where futures contracts and option contracts are traded. These instruments are standardized and regulated by exchanges like NSE and BSE in India.
Futures
A future is a contract between two parties to buy or sell the underlying asset at a predetermined price on a future date.
Key features:
Obligation to buy or sell
Mark-to-market settlement daily
High leverage
No upfront premium—margin required
Options
Options are more flexible. Here, the buyer has the right, but not the obligation, to buy or sell the underlying asset at a specific price before expiry.
This structure makes option trading safer for buyers, as maximum loss is limited to the premium paid.
3. What Is Option Trading?
Option trading involves buying or selling option contracts. Options are of two main types:
A. Call Option (CE)
A call option gives the buyer the right to buy the underlying asset at a particular price (strike price).
Used when the trader expects:
Market will go up
Example: If Nifty is at 21,000 and you expect a rise, you may buy a 21,100 CE.
B. Put Option (PE)
A put option gives the buyer the right to sell the underlying asset at a particular price.
Used when the trader expects:
Market will go down
Example: If you expect Nifty to fall from 21,000, you may buy a 20,900 PE.
4. Components of an Option Contract
Understanding option pricing requires knowing its key elements:
1. Strike Price
The price at which the buyer can buy (Call) or sell (Put) the underlying asset.
2. Premium
The cost paid by the buyer to the seller (writer).
Premium depends on volatility, time left to expiry, and price difference from the underlying.
3. Expiry Date
Options expire on a fixed date.
In India:
Index options: Weekly + monthly expiry
Stock options: Monthly expiry only
4. Lot Size
Options are traded in lots, not single shares.
5. Option Buyers vs Option Sellers
Understanding the difference is critical.
Option Buyer (Holder)
Pays premium
Has limited loss
Profit is unlimited (in calls) or high (in puts)
Buyers need strong directional movement.
Option Seller (Writer)
Receives premium
Has limited profit (premium)
Loss can be unlimited
Sellers win when markets stay sideways or move less than expected.
6. Why Do Traders Prefer Options?
1. Limited Risk for Buyers
Even if the market moves drastically against you, the maximum loss is the premium paid.
2. Low Capital Requirement
Compared to futures or stock delivery, options require lesser capital to take large positions.
3. Hedging Tool
Portfolio managers use options to protect investments from downside risk.
4. Flexibility
Options allow strategies for bullish, bearish, or sideways markets.
7. How Options Derive Value — Premium Breakdown
Option premium consists of:
A. Intrinsic Value
The actual value based on the current market price.
B. Time Value
The value of the time remaining before expiry.
Longer duration = higher premium.
C. Volatility Impact
High volatility increases premium as price movement expectations rise.
8. Types of Options Based on Moneyness
1. In-the-Money (ITM)
Call: Strike < Spot
Put: Strike > Spot
These have intrinsic value.
2. At-the-Money (ATM)
Strike price = current market price.
3. Out-of-the-Money (OTM)
Call: Strike > Spot
Put: Strike < Spot
Cheaper but riskier.
9. F&O Trading Strategies Using Options
Options are versatile, enabling a variety of strategies.
1. Directional Strategies
Good for trending markets:
Long Call (Bullish)
Long Put (Bearish)
Call Spread / Put Spread
2. Non-Directional Strategies
Good for sideways markets:
Iron Condor
Short Straddle
Short Strangle
3. Hedging Strategies
Protective Put
Covered Call
Traders select strategies based on volatility, trend strength, and risk appetite.
10. Risks in F&O Trading
Even though options look simple, F&O trading carries significant risks:
1. High Volatility Risk
Unexpected news can move prices sharply.
2. Time Decay Risk
Option buyers lose value each day.
3. Leverage Risk
Small capital controls large positions, increasing both profits and losses.
4. Liquidity Risk
Some stocks in F&O have low volume, making entry/exit difficult.
11. Who Should Trade Options?
Option trading suits:
Traders who understand market direction
Those with small capital
Risk-managed traders
Portfolio investors wanting hedge protection
Advanced traders who use spreads and combinations
However, without knowledge, beginners should avoid naked option selling due to unlimited risk.
12. Role of F&O in the Financial Market
F&O segment plays a crucial role in overall market stability:
1. Risk Transfer Mechanism
Allows shifting risk between participants.
2. Enhances Market Liquidity
More participants → deeper markets.
3. Price Discovery
F&O prices indicate future expectations.
4. Improves Market Efficiency
Arbitrage aligns cash and futures prices.
Conclusion
Option trading and F&O derivatives form the backbone of modern financial markets. They offer traders the ability to hedge risk, speculate with lower capital, and access leverage for higher potential returns. Options, in particular, stand out because they provide flexibility through calls and puts, limited loss for buyers, and strategic combinations that can suit any market condition. However, the power of leverage and complexity also requires strong understanding, disciplined risk management, and strategic execution. For traders who master these skills, the F&O market becomes a powerful tool for generating consistent returns and managing market uncertainty effectively.

PCR Trading Strategies Option Premium
The option premium is the cost of buying an option contract. It is influenced by several factors:
Underlying Price – higher underlying prices increase call premiums and decrease put premiums.
Strike Price – closer the strike price is to current market price, costlier the option.
Time to Expiry – more time means higher premium.
Volatility – higher volatility increases premium as uncertainty rises.
Interest Rates and Dividends – have minor impacts but still contribute.
These factors are modeled using the Black-Scholes model and other pricing techniques.

Part 12 Trading Master ClassCall Options
A call option benefits the buyer when the price of the underlying asset goes up.
For example, if a stock is trading at ₹100 and you buy a call option with strike price ₹105, you expect the price to rise above ₹105 before expiry. If the stock goes to ₹120, you can buy it at ₹105 and profit from the difference (minus premium). If it stays below ₹105, your loss is limited only to the premium paid.
Put Options
A put option benefits the buyer when the price of the underlying asset goes down.
If a stock trades at ₹100 and you buy a put with a strike price of ₹95, you expect it to fall. If the stock goes to ₹80, you can sell at ₹95 and keep the difference as profit. If price stays above ₹95, your maximum loss is only the premium.

How to Understand Trading-view InterfaceWe provide Trading-view interface in a short way in this video introduction on Trading-view interface.
This video provides a clear and structured walkthrough of the Trading-View interface. It covers chart layout, drawing tools, timeframes, market watchlist in a simple and organized manner to help users understand the platform more effectively.

Part 11 Trading Master Class What Are Options?
Options are financial contracts that give the buyer the right, but not the obligation, to buy or sell an underlying asset at a predetermined price (called the strike price) before or on a specific date. Unlike shares, which give ownership, options only provide trading rights.
There are two main types of options:
Call Option – gives the right to buy.
Put Option – gives the right to sell.
The buyer of an option pays a premium, while the seller (or writer) receives the premium and must fulfill the contract if the buyer exercises it.

Candle Patterns Limitations of Candlestick Patterns
They do not predict exact price targets.
False signals occur during high volatility.
Requires combining with other tools for accuracy.
Works less effectively in extremely choppy markets.

Premium Chart Patterns Limitations of Chart Patterns
False breakouts are common.
Patterns may be subjective—two traders may interpret them differently.
Market news can disrupt even perfect setups.
Patterns on lower timeframes are less reliable due to noise.
Therefore, traders often combine patterns with:
Moving averages
RSI
MACD
Volume analysis
Market structure
This improves accuracy.

How to Identify Multibagger Stocks Using Fundamentals?Hello Traders!
Many people look for multibagger stocks, but only a few understand how to find them. A real multibagger comes from a strong business, not luck. Here are simple fundamentals that help you identify a stock with long-term growth potential.
1. Look for Steady Revenue Growth
A multibagger company grows its sales every year.
Check at least 5 years of consistent growth.
If sales keep increasing, the business is moving in the right direction.
2. Look for Rising Profits and Better Margins
Profit should grow faster than sales.
Higher margins show the company is becoming stronger.
A profitable company can grow without stress.
3. Choose Low-Debt Companies
High debt is a danger sign.
A company with low or zero debt is more stable.
Low debt means less risk during tough times.
4. Check If the Company Has a Strong Advantage
A multibagger usually has something special compared to others.
This can be brand power, technology, low cost, or unique products.
A strong advantage helps the company stay ahead.
5. Study the Management
Good leaders build strong companies.
Look at their track record and decisions.
Honest and stable management is a positive sign.
6. Make Sure the Industry Has Growth
Even a good company cannot grow in a dead industry.
Choose businesses in fast-growing sectors.
Industry growth supports stock growth.
7. Enter at a Fair Price
Even the best company is risky if bought too high.
Compare the valuation with industry averages.
A good business at a fair price becomes a powerful long-term winner.
8. Check Promoter Holding
High promoter holding shows confidence.
Avoid companies where promoters have pledged shares.
When promoters believe in the company, it’s a strong signal.
9. Watch Return Ratios (ROE, ROCE)
A good multibagger maintains ROE and ROCE above 15 percent.
High return ratios mean the company uses money wisely.
These ratios should be steady or rising.
10. Think Long Term
Multibaggers take time to grow.
Focus on the business, not daily price moves.
Long-term thinking builds real wealth.
Rahul’s Tip:
Multibaggers are found through simple research, not hype. Look for strong fundamentals, good management, and fair value. Then hold with patience.
Conclusion:
Finding a multibagger is all about understanding the business. Choose companies that grow steadily, stay financially strong, and have a clear future. With patience and discipline, wealth will follow.
Markets are RIGGED?Most traders begin their journey believing that the market will test their strategies, their indicators, and their ability to forecast price movements.
But the truth is far more uncomfortable:
The market tests you.
Your beliefs.
Your fears.
Your discipline.
Your identity.
You don’t trade the markets —
you trade your psychology.
The chart is merely the mirror.
Every hesitation, every impulse entry, every oversized position, every revenge trade…
These are not market behaviors.
They are your behaviors showing up on the screen.
You get exposed as a person the moment you start trading.
Not publicly — but inwardly.
You see the parts of yourself you could ignore in normal life:
• Your impatience
• Your fear of missing out
• Your need to be right
• Your avoidance of uncertainty
• Your emotional triggers
• Your lack of preparation
• Your fantasies and biases
The market makes them visible. It forces you to confront them.
And that’s why mastering yourself is the real edge.
Not a new indicator.
Not a new setup.
Not a new piece of news flow.
The internal work — discipline, emotional clarity, self-control, and self-awareness — creates the conditions for consistent execution. Without this inner alignment, even the best strategy collapses under emotional pressure.
When you hold your breath during a trade, the chart isn’t the problem.
When you hesitate to press the buy button, the trend isn’t the problem.
When you panic-exit a position early, volatility isn’t the problem.
Your inner state is what shapes your trading decisions.
That’s why your outside life is inseparable from your trading life.
How you:
• manage stress
• respond to conflict
• handle uncertainty
• maintain discipline
• structure your daily routine
• treat yourself during setbacks
• set boundaries
— all of this shows up in your trading results.
If your life lacks structure, your trades will lack structure.
If you avoid discomfort, you’ll avoid executing good trades.
If you’re emotionally reactive outside the markets, you’ll be reactive inside them.
If you’re scattered mentally, your entries will be scattered too.
Your personal patterns become your trading patterns.
Trading doesn’t change you — it reveals you.
And that’s why traders who commit to self-mastery eventually rise above the noise.
They aren’t fighting the market anymore.
They’ve learned to stop fighting themselves.
The graphs become quieter.
The impulses weaken.
The noise fades.
Decisions become clearer, calmer, cleaner.
Because the trader has changed —
and the trading reflects that change.

Breakout Retest Perfect PictureHello TradingView community, friends, and fellow traders.
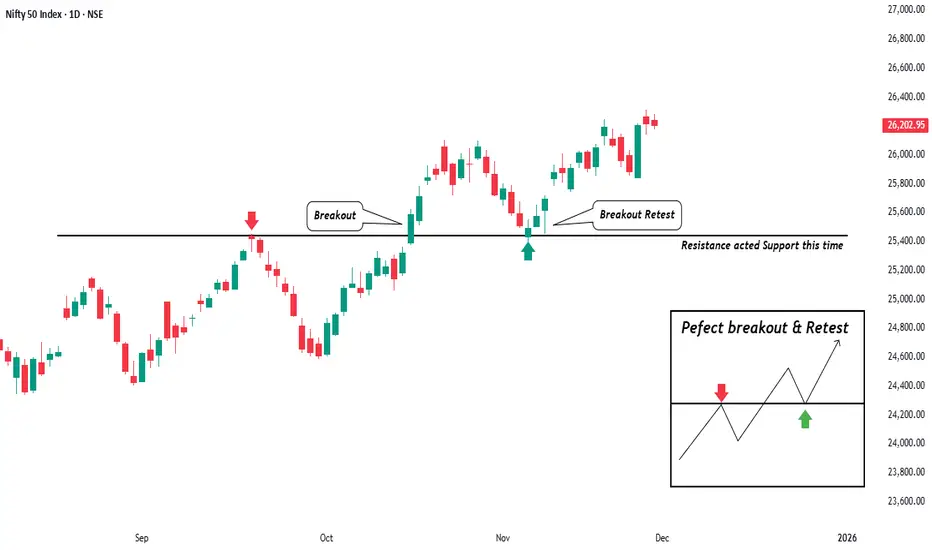
I hope everyone is doing well with patience and clarity. Sharing a fresh price action observation on Nifty that clearly shows one of the most important concepts every trader should understand how the market behaves after a breakout.
On this chart, price had been facing repeated rejection from the same area, showing that it was a strong resistance zone. Sellers were clearly active at that level and price struggled to move higher. When price finally broke above this level with strength, it was the first sign that buyers were starting to take control.
What makes this setup valuable is not just the breakout itself, but what happened next. Instead of continuing straight upward, price came back to test the same area from above. This is the moment where most traders get confused, and many exit early or panic. In reality, this retest is the market checking whether the breakout was genuine or not.
When the old resistance starts acting as a support, it confirms something very important the market has accepted a new price range. This shift is known as role reversal, where selling pressure is replaced by buying interest. It also shows that buyers are now willing to defend the same level that sellers once controlled.
This is why breakouts should not be chased blindly. A breakout without confirmation often leads to false signals, but a breakout followed by a successful retest builds trust in the structure. The retest gives traders a chance to see whether the level holds and whether the trend is likely to continue.
As long as price remains above this support zone, the bias stays positive and the trend favors buyers. If price starts closing below this level, it would indicate weakness and failure of structure. The chart always gives clarity we just need to read it without emotion.
The biggest lesson here is patience. Markets reward those who wait for confirmation, not those who rush for entries. Breakout shows intention, but retest shows strength.
I hope this idea helps you see structure more clearly and trade with more confidence. Always remember, price action is not random. It tells a story, and every level has meaning if you know how to read it.
Wishing you all clarity, discipline, and consistency in your trading journey.
Trade safe and stay focused.
Regards- Amit.
Part 10 Trade Like Institutions Option Trading in India (NSE)
In India, the National Stock Exchange (NSE) is the largest options market globally in terms of contracts traded.
Features of Indian Options:
Cash-settled for indices (NIFTY, FINNIFTY, BANKNIFTY)
Stock options are physically settled
Weekly expiries every Thursday (for index)
Monthly expiries for stocks
Index options are preferred because they:
Have high liquidity
Offer tight spreads
Enable sophisticated strategies

Part 9 Trading Master ClassRisks in Option Trading
1. High Losses for Option Sellers
Naked call sellers face unlimited loss potential.
2. Time Decay
An option loses value as it approaches expiry.
3. Complex Pricing
Options require understanding of volatility, Greeks, and probability.
4. Liquidity Problems
Illiquid options cause slippage and wide bid-ask spreads.
5. Emotional Trading
Fast-moving markets can cause panic among new traders.

Part 8 Trading Master ClassAdvantages of Option Trading
1. Limited Risk for Buyers
Buying options never risks more than the premium.
2. High Leverage
Small investment can control large quantity.
3. Flexibility
Hundreds of strategies exist.
4. Hedging Power
Investors can protect long-term portfolios.
5. Income Potential
Option writing gives fixed, predictable income.

Part 7 Trading Master Class Why Traders Use Options
1. Hedging
Investors use options to protect their portfolios from downside risk.
Example: Buying a put option acts like insurance.
2. Speculation
Options allow traders to take directional bets with limited capital.
3. Income Generation
Selling options (covered calls, cash-secured puts) generates regular income through premium collection.
4. Leverage
Options enable traders to control large positions with small capital.

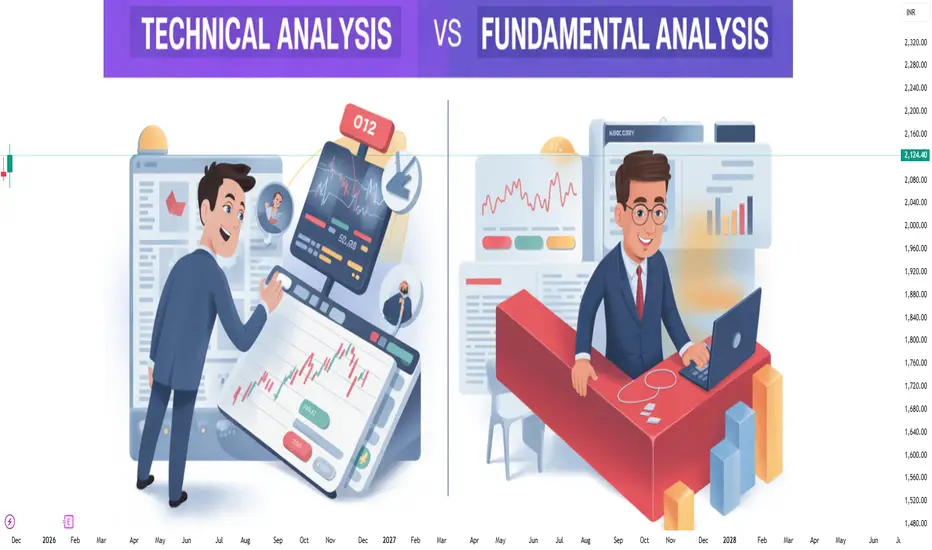
Technical Analysis vs Fundamental Analysis1. Introduction
Financial markets are influenced by a vast network of economic, psychological, and structural forces. To understand price movements, one must either study the intrinsic value of an asset or analyze its price behavior. This is where fundamental and technical analysis come into play.
Fundamental analysis evaluates securities by examining economic, financial, and qualitative factors. Its purpose is to estimate the true value (fair value) of a stock, commodity, or currency.
Technical analysis, on the other hand, focuses solely on market data—primarily price and volume—to forecast future price movements. It assumes that all known fundamentals are already reflected in price.
2. What Is Fundamental Analysis?
Fundamental analysis studies the underlying factors influencing a company or economy. It aims to determine whether an asset is overvalued, undervalued, or fairly valued.
Key Components of Fundamental Analysis
a) Financial Statements
Investors examine:
Balance sheet (assets, liabilities, equity)
Income statement (revenue, net profit)
Cash flow statement (cash inflow/outflow)
These help measure profitability, leverage, growth, liquidity, and operational efficiency.
b) Economic Indicators
Macro factors influence overall market conditions:
GDP growth
Inflation
Interest rates
Employment data
Fiscal and monetary policy
For example, rising interest rates often reduce stock market returns.
c) Industry Analysis
Analyzing:
Industry growth rate
Competition
Market share
Regulatory environment
A strong company in a weak industry may still underperform.
d) Qualitative Aspects
These include:
Management quality
Corporate governance
Brand value
Innovation and product pipeline
Customer loyalty
Such factors often drive long-term performance.
e) Valuation Models
Popular methods include:
Discounted Cash Flow (DCF)
Price-to-Earnings (P/E) ratio
Price-to-Book (P/B) ratio
EV/EBITDA
Dividend Discount Model (DDM)
These help estimate fair value compared to the market price.
3. What Is Technical Analysis?
Technical analysis predicts future price movements based on historical market data such as price, volume, and market sentiment. It is commonly used by traders rather than long-term investors.
Key Components of Technical Analysis
a) Price Charts
Different chart types help visualize market patterns:
Candlestick charts
Line charts
Bar charts
Heikin-Ashi
Candlestick patterns like Doji, Hammer, and Engulfing reveal market psychology.
b) Indicators and Oscillators
Traders use mathematical tools to identify trends, strength, and reversals:
Moving Averages (MA)
RSI (Relative Strength Index)
MACD
Bollinger Bands
Stochastic Oscillator
Volume indicators
Each provides signals on market entry and exit.
c) Chart Patterns
Patterns help anticipate future price movements:
Head and Shoulders
Double Top/Double Bottom
Triangles
Flags and Pennants
Cup and handle
These patterns often repeat due to consistent human behavior.
d) Trend Analysis
One of the most important principles:
Uptrend (higher highs, higher lows)
Downtrend (lower highs, lower lows)
Sideways trend (range-bound market)
Traders follow the trend to reduce risks.
e) Support and Resistance
Key price zones where buying/selling pressure increases:
Support: where price tends to bounce up
Resistance: where price tends to fall back
Breakouts and breakdowns are major trading signals.
4. Philosophy Behind Both Analyses
Fundamental Analysis Philosophy
Market price does not always reflect true value.
Over time, price will converge toward intrinsic value.
Best for long-term investors who want to buy undervalued assets.
Technical Analysis Philosophy
Price discounts everything (news, emotions, fundamentals).
Price moves in trends.
Market psychology causes patterns that repeat over time.
Best for traders focusing on short to medium time frames.
5. Time Horizon Differences
Fundamental Analysis
Long-term approach (months to years)
Used by investors, mutual funds, and institutional players
Suitable for wealth creation
Technical Analysis
Short-term to medium-term (minutes to weeks)
Used by day traders, swing traders, scalpers
Suitable for frequent trading
6. Advantages and Limitations
A) Fundamental Analysis – Pros
Helps identify long-term investment opportunities
Provides deep understanding of a company
Works well for building wealth
Useful for identifying high-quality businesses
Fundamental Analysis – Cons
Time-consuming and complex
Markets can remain irrational longer than expected
Not effective for short-term trading
Sudden news/events can invalidate analysis
B) Technical Analysis – Pros
Helps with precise entry and exit timing
Works in all markets (stocks, forex, crypto, commodities)
Quick and efficient
Useful even without deep company knowledge
Technical Analysis – Cons
False signals are common
Over-reliance can lead to overtrading
Requires discipline and psychological control
Patterns may fail during high volatility
7. Which One Should You Use?
For Long-term Investors
Fundamental analysis is superior because it focuses on:
business strength
financial health
long-term growth potential
It helps identify companies that compound wealth over time.
For Short-term Traders
Technical analysis works better due to:
market-timing capabilities
entry/exit precision
chart-based signals
Short-term price movement is mostly driven by psychology, liquidity, and volatility—technical tools capture this better.
8. Combining Both Approaches (Best Practice)
Many professionals use a hybrid approach, known as Techno-Fundamental Analysis.
Example Strategy:
Use fundamental analysis to identify strong companies.
Use technical analysis to find the right entry point.
This method gives investors both quality and proper timing.
9. Conclusion
Technical analysis and fundamental analysis are powerful tools, each serving different purposes in trading and investing. Fundamental analysis focuses on understanding value, financial health, and long-term prospects of assets. Technical analysis emphasizes price behavior, market psychology, and timing of trades.
An ideal market participant should understand both; investors rely more on fundamentals, while traders depend heavily on technical tools. Combining both approaches enhances decision-making and offers the best balance of knowledge and timing—crucial for consistent success in financial markets.
Short-Term vs Long-Term Trading1. What Is Short-Term Trading?
Short-term trading focuses on taking advantage of price movements over a few minutes, hours, or days. The trader’s goal is to profit from short bursts of volatility instead of waiting for long-term trends. Short-term trading includes styles like intraday trading, swing trading, scalp trading, and momentum trading.
Key Characteristics of Short-Term Trading
a) Time Horizon
Short-term trades typically last:
Intraday: minutes to hours
Swing trading: 2–15 days
Momentum trades: until trend exhaustion
The focus is on quick entries and exits.
b) Trading Frequency
Short-term traders execute multiple trades within a week or even within a day. This increases opportunity but also exposure to transaction costs.
c) Dependency on Technical Analysis
Short-term trading relies heavily on:
Candlestick patterns
Indicators like RSI, MACD, Moving Averages
Volume analysis
Chart patterns (flags, triangles, breakouts)
Fundamentals matter less because the time horizon is too short for fundamentals to play out meaningfully.
d) High Volatility, High Risk
Short-term moves are unpredictable. News, events, and market sentiment can cause sharp fluctuations. A trader must always have:
Strict stop-loss
Risk-per-trade limits
High emotional discipline
e) Capital Requirement
Short-term traders often use margin or leverage, which magnifies both returns and losses.
f) Psychological Stress
Watching charts for hours, handling rapid moves, and managing multiple positions can be mentally taxing.
Advantages of Short-Term Trading
Quick returns
Regular trading opportunities
Can profit in any market condition (up, down, sideways)
Requires less capital for margin-based strategies
Disadvantages of Short-Term Trading
High risk from volatility
Stressful and time-intensive
High brokerage and taxation costs
Probability of emotional mistakes is higher
2. What Is Long-Term Trading (Investing)?
Long-term trading—often called investing—focuses on holding positions for months, years, or decades. Instead of reacting to daily volatility, long-term traders focus on the broader economic and business growth cycles.
Key Characteristics of Long-Term Trading
a) Time Horizon
Investments typically last:
Short long-term: 6 months–2 years
Medium-term: 2–5 years
Long-term: 5–20+ years
This approach allows the investor to benefit from company growth, compounding, and market cycles.
b) Dependence on Fundamental Analysis
Long-term strategies depend on:
Financial statements (balance sheet, P&L, cash flow)
Company management quality
Sector growth
Economic cycles
Competitive advantages (moats)
Charts may be used for entry timing but fundamentals drive the decision.
c) Lower Trading Frequency
Investors may make only a handful of trades in a year, reducing cost and stress.
d) Lower Risk Through Compounding
Over time, markets tend to move upward due to economic growth. Long-term investing benefits from:
Compounding returns
Dividend reinvestment
Reduced volatility impact
e) Stable and Manageable Psychology
Investors don’t need to watch markets daily. Long-term patience and discipline are more important than speed.
Advantages of Long-Term Trading
Lower stress
Lower brokerage and tax costs
Lower chance of emotional errors
Wealth compounding over time
Better suited for salaried individuals or busy professionals
Disadvantages of Long-Term Trading
Slow returns
Requires patience
Market crashes can test conviction
Needs good research on fundamentals
3. Key Differences Between Short-Term and Long-Term Trading
Aspect Short-Term Trading Long-Term Trading
Time Horizon Minutes to weeks Years to decades
Analysis Mostly technical Mostly fundamental
Risk Level High due to volatility Lower due to long time frame
Capital Requirement Often less initially, but risky with leverage Usually requires more capital but safer
Frequency of Trades High Low
Tax Impact Higher (short-term capital gains tax) Lower (long-term capital gains tax)
Skills Needed Chart reading, speed, intraday discipline Business analysis, patience, strategic thinking
Psychological Pressure High Moderate to low
Return Pattern Frequent small profits (or losses) Slow, compounding returns
4. Which One Is Better?
There is no universal answer—it depends on the individual’s personality, risk appetite, and goals.
Short-Term Trading Is Better If You:
Enjoy analyzing charts
Can handle high stress
Want frequent trading opportunities
Can dedicate time daily
Have strict risk discipline
Accept that losses are part of the game
Short-term trading can generate quick profits but also quick losses.
Long-Term Trading Is Better If You:
Prefer stable growth
Don’t want to sit in front of charts
Believe in company fundamentals
Want to benefit from compounding
Are patient and disciplined
Want to build long-term wealth
For most people, long-term investing is safer and more rewarding.
5. Which Approach Do Professionals Use?
Many experienced market participants use a hybrid model:
Long-term portfolio for wealth creation
Short-term portfolio for opportunities during volatility
This allows them to enjoy stability while also taking advantage of short-term market movements.
6. Final Thoughts
Short-term and long-term trading represent two different philosophies. Short-term traders rely on speed, chart-reading skills, and rapid decision-making, accepting volatility as a regular challenge. Long-term investors rely on patience, fundamentals, and the power of compounding, focusing on the broader picture instead of daily price movements.
Both strategies can be profitable if executed correctly. The key is to choose the one that matches your personality, lifestyle, and financial objectives. A disciplined long-term investor can steadily build wealth, while a skilled short-term trader can generate quicker gains—but with higher risk.
Ultimately, the best traders and investors are those who understand themselves just as well as they understand the market.

Swing Trading in India1. What Is Swing Trading?
Swing trading is a strategy where traders aim to profit from price swings—upward or downward—over short to medium durations. Unlike day traders, swing traders don’t depend on rapid-fire trades. Instead, they wait for price setups, enter with a calculated plan, and exit when the target is achieved.
In India, typical swing trading time frames range from:
3 to 10 days for momentum stocks
10 to 20 days for trend-following trades
2 to 8 weeks for positional swing trades
Swing trading works well because markets rarely move in a straight line; they swing between support and resistance, giving multiple opportunities.
2. Why Swing Trading Is Popular in India
a) High Volatility in Stocks
Indian stocks—especially mid-caps and sectoral leaders—show strong short-term price movements. This creates opportunities for swing traders.
b) Lower Stress Compared to Intraday
Swing traders don’t need to watch charts constantly. They make decisions after market hours based on end-of-day charts.
c) Suitable for Working Professionals
Since trades last for days, a full-time job doesn’t stop you from swing trading.
d) Limited Market Noise
Instead of reacting to intraday fluctuations, swing traders focus on broader technical patterns.
e) Leverage With Futures and Options
Index futures, stock futures, and options unlock leveraged swing trades with defined risk.
3. Tools Required for Swing Trading
To succeed in swing trading in India, traders rely on three pillars:
a) Technical Analysis
The backbone of swing trading. Key tools include:
Support and resistance
Trendlines
Breakout and breakdown patterns
Moving averages (20-EMA, 50-SMA, 200-SMA)
RSI and MACD
Fibonacci retracement levels
Volume analysis
b) Risk Management Tools
Stop-loss
Position sizing
Risk-reward ratios (minimum 1:2)
c) Market Structure Awareness
Understanding market phases:
Uptrend
Downtrend
Consolidation
Reversal zones
4. Popular Swing Trading Strategies in India
1) Breakout Trading
This is one of the most reliable swing strategies. Traders enter when the price breaks above resistance with high volume.
Example setups:
Breakout from a consolidation zone
Breakout from a wedge or triangle pattern
New 52-week high with strong volume
2) Pullback Trading
Instead of chasing breakouts, traders wait for a pullback toward support.
Indicators used:
20-EMA or 50-SMA
Fibonacci 38.2% or 61.8%
RSI pullback to 40–50 before continuation
This strategy works well in trending markets such as IT, Pharma, and BFSI sectors.
3) Trendline Bounce Strategy
When a stock respects an upward trendline multiple times, swing traders enter near the trendline with a stop-loss just below it.
4) RSI Overbought/Oversold Strategy
An easy yet effective method:
RSI near 30 → possible bounce
RSI near 70 → possible correction
Works strongly with Nifty and large caps.
5) Moving Average Crossover Strategy
Swing traders often use:
Golden Cross (50-SMA crosses above 200-SMA)
20-EMA crossover for short-term momentum trade
Crossovers give directional cues for upcoming swings.
5. Best Stocks and Indexes for Swing Trading in India
Nifty 50 stocks
Highly liquid
Clean chart patterns
Predictable swings
Examples: Reliance, TCS, Infosys, HDFC Bank, ICICI Bank
Bank Nifty and Nifty Index
Index swings are relatively stable and follow global cues. Suitable for futures or options-based swing trading.
Mid-cap and Sector Leaders
Often show the strongest short-term movements.
Examples: Dixon Technologies, Deepak Nitrite, Persistent Systems, APL Apollo, Tata Elxsi.
Sectoral Trends
Swing traders track sector rotations such as:
PSU banks
FMCG
IT
Auto
Realty
If a sector strengthens, individual stocks show faster momentum.
6. Time Frames Used in Swing Trading
Swing traders typically use a multi-timeframe approach:
Higher Time Frame (Weekly)
Identifies long-term trend
Marks major support/resistance
Medium Time Frame (Daily Chart)
Primary decision-making chart
Finds entry setups
Lower Time Frame (1-hour or 4-hour)
Fine-tunes entries
Confirms breakout sustainability
This multi-level approach increases accuracy.
7. Risk Management in Swing Trading
Risk management is the key to long-term success.
a) Stop-Loss Placement
A common mistake is placing stop-loss too tight. Instead, place SL:
Below swing low in uptrend
Above swing high in downtrend
Below 20-EMA or trendline
b) Risk per Trade
Limit risk to 1%–2% of trading capital.
c) Risk-Reward Ratio
Minimum acceptable ratio: 1:2
Ideal: 1:3 or higher
d) Position Sizing Formula
Position size =
(Capital × Percentage Risk) / Stop-loss distance
e) Avoiding Overnight News Risk
Check:
Quarterly results dates
Government policy announcements
Global events like Fed decisions
8. Common Mistakes Indian Swing Traders Make
1) Overtrading
Not every day produces a swing opportunity.
2) Trading Illiquid Stocks
Avoid low-volume stocks; they give fake breakouts.
3) Ignoring Market Trends
Even strong stocks fall if the index is bearish.
4) No Exit Plan
The exit strategy is as important as the entry.
5) Holding Losing Trades
Emotional attachment destroys capital.
9. Advantages of Swing Trading
Requires less screen time
Good risk-reward trades
Works in both bullish and bearish conditions
Offers more stability than intraday
Allows trading in stocks, futures, and options
Helps build discipline and market understanding
10. Disadvantages and Challenges
Overnight risk
False breakouts in Indian markets
Requires patience
Higher margin requirement for futures
Not suitable for extremely volatile stocks without proper risk control
11. Best Practices for Swing Traders in India
Maintain a trading journal
Stick to limited strategies
Use alerts on TradingView or broker platforms
Focus on sectors gaining momentum
Enter only when risk-reward is favorable
Keep emotions in check
Protect capital at all costs
Conclusion
Swing trading in India is a powerful approach that blends technical analysis, market timing, and disciplined risk management. With the right strategies—breakouts, pullbacks, trendline bounces, and moving average setups—traders can consistently capture profitable price swings. The Indian market provides ample opportunities due to its volatility, liquidity, and sector-based momentum.
By mastering tools, refining entry/exit rules, and avoiding emotional decisions, anyone can become a successful swing trader. It suits beginners, working professionals, and experienced traders looking for a balanced trading style with manageable risk and attractive returns.
Option Chain Analysis1. Understanding the Structure of an Option Chain
An option chain typically has two halves:
Left side → Call Options (CE)
Right side → Put Options (PE)
Each row corresponds to a strike price, and each strike shows several key data points:
Common Columns in CE & PE:
OI (Open Interest) – Total active contracts that are not yet closed.
Change in OI – Shows whether new positions are being built (addition) or squared off (reduction).
Volume – Number of contracts traded during the day.
LTP (Last Traded Price) – Price of the option premium.
Bid/Ask Prices – Best current buy and sell prices.
Implied Volatility (IV) – Market expectation of volatility.
The strike price sits in the center of the table, dividing Call and Put data.
2. Why Option Chain Matters
Option chain analysis allows a trader to:
✓ Identify trend direction
Increasing call writing may suggest bearish sentiment, while heavy put writing may suggest bullish sentiment.
✓ Spot support and resistance
High Put OI indicates strong support.
High Call OI indicates strong resistance.
✓ Understand market liquidity
Higher OI and volume mean more active participation and better entry/exit execution.
✓ Track institutional activity
Big spikes in OI usually represent large participants (FII, proprietary desks).
✓ Predict short-term price movements
Based on the balance between CE and PE data.
3. Key Components of Option Chain Analysis
A. Open Interest (OI)
(Open Interest is the heart of option chain analysis.)
Rising OI + rising price → Long Build-Up
Rising OI + falling price → Short Build-Up
Falling OI + rising price → Short Covering
Falling OI + falling price → Long Unwinding
These combinations provide clues about ongoing market activity.
B. Change in Open Interest
This tells you what is happening today.
Example:
If Put OI is rising fast, traders expect the market to stay above that strike → support.
If Call OI is rising sharply, traders expect resistance at that strike.
C. Option Premium and LTP Movement
Premiums often rise due to:
Trend strength
Increased volatility (IV)
Time remaining to expiry
Premiums collapse due to:
Trend reversal
Drop in IV
Time decay (theta)
D. Implied Volatility (IV)
IV reflects expected movement.
High IV → high uncertainty → expensive options
Low IV → low uncertainty → cheaper options
IV also jumps ahead of major events such as RBI policy, budget, US Fed meetings, elections, etc.
4. Identifying Support & Resistance from Option Chain
This is one of the most practical uses of option chain.
A. Finding Support Levels
Support is identified by:
Highest Put OI
Sharp increase in Put OI
Put writers actively defending a strike
Put writers (sellers) are usually strong hands, so they provide floor/ support.
For example:
If 22,000 PE has the highest OI, then 22,000 becomes strong support.
B. Finding Resistance Levels
Resistance is identified by:
Highest Call OI
Big Call OI additions
CE writers defending a strike
If 22,300 CE has the highest OI, then 22,300 becomes strong resistance.
5. PCR (Put-Call Ratio) Analysis
PCR is a sentiment indicator extracted from the option chain:
PCR = Total Put OI / Total Call OI
Interpretation:
PCR > 1 → bullish sentiment (more puts written)
PCR < 1 → bearish sentiment (more calls written)
PCR around 0.8–1.2 → neutral market
PCR extremes:
Around 1.5–1.8 → overbought (possibility of downtrend soon)
Around 0.5 or lower → oversold (possibility of uptrend)
6. OI and Price Action Combination
Combining price action with OI gives the highest accuracy.
Bullish Signs
Increasing Put OI at lower strikes
Decreasing Call OI
Price closing above major CE writing zones
PCR rising
Bearish Signs
Increasing Call OI at higher strikes
Heavy CE writing above spot
Price closing below major PE supports
PCR declining
Sideways Signals
Both CE and PE addition at surrounding strikes
Narrow PCR near 1.0
Option premiums decaying fast
7. Option Chain Traps and Short Squeezes
Option chain also reveals squeeze situations:
Short Squeeze (Bullish Explosion)
Heavy Call OI begins to unwind
Price breaks above resistance
CE writers forced to exit → premiums rise sharply
Long Liquidation (Bearish Slide)
Heavy Put OI unwinds
Price breaks below support
PE premiums shoot up
These moves are usually fast and violent.
8. How to Use Option Chain for Intraday Trading
Intraday traders use:
A. Change in OI (minute-by-minute)
This reveals immediate momentum.
B. Straddle & Strangle Levels
High combined premium = expected movement range.
C. ATM (At-the-Money) Behavior
If ATM call OI rises → bearish
If ATM put OI rises → bullish
D. Premium Breakout Zones
Sharp change in CE or PE premium suggests a trending move starting.
9. Expiry Day Option Chain Analysis
Expiry days are different because:
Time decay is extreme
OI changes rapidly
Range-bound behavior is common
On expiry:
Highest CE + PE OI combination often predicts the max pain level (where sellers profit the most)
Prices tend to gravitate around this level
10. Max Pain Theory
Max Pain = Strike price where option buyers lose maximum money.
It is calculated from the option chain.
On expiry day, price often moves toward max pain.
11. Option Chain for Swing and Positional Trading
Positional traders use:
Total OI across all strikes
IV trends
Monthly expiry data
Support/resistance based on long-term OI
If Put OI is high for next month → bullish for swing trades.
If Call OI dominates → bearish.
12. Mistakes Traders Make in Option Chain Reading
Only checking OI without price action
Ignoring IV changes
Misinterpreting unwinding phases
Trading without considering broader market events
Following high OI blindly without confirming by price behavior
Option chain should be combined with technical analysis for best results.
13. Practical Example Summary (How a Trader Should Use the Chain)
Identify highest PE OI → support
Identify highest CE OI → resistance
Analyze Change in OI → fresh positions being created
Check PCR → market sentiment
Observe IV → volatility expectations
Track premium movement → strength of buyers or sellers
Combine with price action to confirm trend
Final Thoughts
Option Chain Analysis is a vital skill for traders in index and stock derivatives. It reveals the psychology of option writers, helps identify crucial levels, indicates short-term momentum, and offers insights into market direction. When used properly along with charting tools, it significantly enhances accuracy in intraday, swing, and expiry trading.
Strategy Optimization for Trading 1. Understanding Strategy Optimization
At its core, strategy optimization is about enhancing decision-making frameworks. A strategy—whether in business, finance, or operations—defines how resources are allocated, risks are managed, and objectives are achieved. Optimization involves testing, analyzing, and fine-tuning these strategies to improve performance. It is iterative, data-driven, and involves balancing multiple factors, such as cost, risk, efficiency, and profitability.
For businesses, this may mean optimizing marketing campaigns, supply chain operations, or pricing models. For financial traders, it could involve refining trading algorithms, portfolio allocation, or risk management rules.
2. Key Objectives of Strategy Optimization
The primary objectives of strategy optimization include:
Maximizing Efficiency: Using resources, time, and capital more effectively to achieve objectives with minimal waste.
Minimizing Risk: Identifying and mitigating potential threats that could undermine strategic goals.
Enhancing Returns: Improving financial or operational outcomes by optimizing processes, decisions, and execution.
Adapting to Market Dynamics: Ensuring strategies remain relevant in changing economic, technological, or competitive environments.
Evidence-Based Decisions: Replacing guesswork with insights derived from data analysis, testing, and modeling.
Optimization is not a one-time activity; it is a continuous process that evolves with internal performance metrics and external market conditions.
3. Steps in Strategy Optimization
Strategy optimization involves a structured approach that can be broken down into several steps:
Step 1: Define Objectives
Clearly define the goals of the strategy. Objectives should be SMART—Specific, Measurable, Achievable, Relevant, and Time-bound. For example, a financial trading strategy may aim to maximize annual returns while keeping drawdowns below 10%.
Step 2: Data Collection and Analysis
Gather historical and real-time data relevant to the strategy. For businesses, this could be sales data, customer behavior metrics, or operational performance data. For traders, market price movements, volatility patterns, and macroeconomic indicators are crucial. Analytical tools like statistical models, machine learning, and visualization help identify trends and insights.
Step 3: Develop and Test Scenarios
Model multiple scenarios to evaluate how different strategies perform under varying conditions. Simulation techniques, backtesting (for trading), or A/B testing (for marketing campaigns) are effective ways to understand potential outcomes. Scenario analysis helps identify strengths, weaknesses, and sensitivities in a strategy.
Step 4: Parameter Optimization
Every strategy has parameters that influence its performance. For instance, in trading, parameters could be moving average periods, risk thresholds, or stop-loss levels. Adjusting these parameters systematically using optimization techniques such as grid search, genetic algorithms, or machine learning can significantly improve results.
Step 5: Risk Assessment
Optimization should not come at the expense of risk exposure. Evaluate the potential downsides of each optimized strategy using stress testing, Monte Carlo simulations, or sensitivity analysis. Risk-adjusted performance measures, like the Sharpe ratio in finance, help compare strategies fairly.
Step 6: Implementation
Once an optimized strategy is identified, implement it in a controlled and measurable way. Ensure alignment with organizational goals, stakeholder expectations, and operational capabilities. In trading, this may involve deploying an automated algorithm; in business, rolling out a refined marketing plan or operational process.
Step 7: Monitoring and Feedback
Optimization is iterative. Continuously monitor performance using key performance indicators (KPIs) and feedback loops. Metrics such as ROI, customer acquisition cost, win/loss ratio, or operational efficiency provide insights into whether the strategy is performing as intended. Adjustments should be made based on empirical evidence rather than assumptions.
4. Techniques and Tools for Strategy Optimization
Modern strategy optimization relies heavily on quantitative and qualitative tools:
Quantitative Techniques
Statistical Analysis: Identifying correlations, trends, and anomalies in historical data.
Backtesting: Testing strategies against historical data to measure hypothetical performance.
Monte Carlo Simulation: Modeling the probability of different outcomes in uncertain environments.
Optimization Algorithms: Using algorithms such as gradient descent, genetic algorithms, or particle swarm optimization to find optimal parameters.
Machine Learning Models: Leveraging predictive analytics for pattern recognition, forecasting, and decision-making.
Qualitative Techniques
Scenario Planning: Evaluating how strategies respond to potential market or operational disruptions.
Expert Judgment: Incorporating insights from industry experts or experienced practitioners.
SWOT Analysis: Identifying strengths, weaknesses, opportunities, and threats to refine strategies.
Software Tools
Business Intelligence Platforms: Tableau, Power BI for data visualization and insights.
Statistical Packages: R, Python (Pandas, NumPy, Scikit-learn) for modeling and analytics.
Trading Platforms: MetaTrader, NinjaTrader, or QuantConnect for backtesting and algorithm optimization.
Project Management Tools: Jira, Trello, or Asana for implementing and tracking strategy changes.
5. Best Practices for Effective Optimization
Focus on Core Objectives: Avoid over-optimization, which can lead to unnecessary complexity and diminishing returns.
Balance Risk and Reward: Optimal strategies should maximize performance without exposing the organization to unacceptable risks.
Use Data Wisely: Ensure data quality and relevance. Decisions based on poor or irrelevant data can mislead optimization efforts.
Iterate Continuously: Markets and business environments evolve; regular review and adjustment are critical.
Maintain Flexibility: Build strategies that can adapt to changes rather than rigid, one-size-fits-all approaches.
Document Processes: Maintain clear documentation for reproducibility, transparency, and learning from past outcomes.
6. Common Challenges in Strategy Optimization
Overfitting: Optimizing a strategy too closely to past data can reduce its effectiveness in real-world scenarios.
Incomplete Data: Lack of comprehensive or high-quality data can lead to biased or unreliable optimization.
Changing Market Conditions: Economic shifts, technological disruptions, or competitive pressures can render an optimized strategy obsolete.
Complexity Management: Highly optimized strategies may become too complex to implement or maintain effectively.
Behavioral Biases: Decision-makers may favor certain strategies due to cognitive biases rather than objective performance metrics.
Addressing these challenges requires a combination of rigorous analysis, continuous monitoring, and flexibility in implementation.
7. Applications of Strategy Optimization
Strategy optimization is applied across multiple domains:
Business
Marketing campaign optimization to improve ROI.
Supply chain optimization for cost reduction and efficiency.
Pricing strategies to maximize profitability and market share.
Finance
Portfolio optimization to balance returns and risks.
Trading strategy refinement using algorithmic and quantitative techniques.
Risk management strategies to minimize drawdowns and losses.
Operations
Production planning and resource allocation.
Inventory management and logistics optimization.
Workforce scheduling and efficiency improvements.
Technology
Machine learning model tuning for better predictions.
Software development strategies to optimize release cycles and quality.
IT infrastructure allocation for cost-effective performance.
8. Conclusion
Strategy optimization is a crucial practice for any organization or individual seeking sustainable growth, profitability, and efficiency. By combining data-driven analysis, risk assessment, scenario planning, and continuous monitoring, optimized strategies can significantly improve outcomes. The process requires a balance between ambition and pragmatism, leveraging both quantitative tools and qualitative insights. Ultimately, organizations and traders who master strategy optimization are better positioned to adapt to changing environments, capitalize on opportunities, and achieve long-term success.
Market Rotations in the Indian Stock MarketIntroduction
Market rotation is a concept widely used by investors and traders to understand how different sectors perform at various stages of the economic cycle. It refers to the movement of capital from one sector or asset class to another, often driven by economic trends, interest rate changes, government policies, or global market dynamics. In the Indian context, understanding market rotations is crucial due to the market's sectoral diversity and the influence of both domestic and international factors.
The Indian stock market, represented mainly by indices like the Nifty 50 and BSE Sensex, consists of multiple sectors such as Banking, IT, Pharmaceuticals, FMCG, Energy, Metals, and Infrastructure. Each sector reacts differently to economic conditions, and rotations across these sectors present opportunities for investors to optimize returns and reduce risks.
1. Understanding Market Rotation
Market rotation is essentially about capital flow between sectors. Investors rotate funds based on valuation, growth potential, interest rates, and macroeconomic trends. For example, during economic expansion, cyclical sectors like Banking, Automobiles, and Capital Goods tend to outperform, while defensive sectors like FMCG and Pharmaceuticals are preferred during economic slowdowns.
In India, rotations are influenced by:
Domestic factors: GDP growth, inflation, RBI policy rates, fiscal policies, and political developments.
Global factors: Crude oil prices, global interest rates, foreign institutional investor (FII) flows, and geopolitical risks.
2. Types of Market Rotations
Sector Rotation:
Movement of funds between sectors based on macroeconomic trends. Example: Investors move from IT and Pharma (defensive) to Banking and Auto (cyclical) during economic expansion.
Style Rotation:
Rotation between investment styles such as growth stocks and value stocks, or between large-cap, mid-cap, and small-cap stocks.
Asset Class Rotation:
Movement between different asset classes, e.g., equities to bonds or gold, often triggered by interest rate changes or global uncertainty.
3. Importance of Market Rotations
Understanding market rotations is crucial for multiple reasons:
Maximizing Returns: By following rotation trends, investors can position themselves in sectors likely to outperform.
Risk Management: Rotation helps avoid overexposure to underperforming sectors.
Timing Investments: Helps investors decide when to exit a sector that has peaked and enter one with higher potential.
Portfolio Diversification: Enhances risk-adjusted returns by shifting between cyclical and defensive sectors according to market phases.
4. Economic Cycles and Sector Performance in India
Market rotations often mirror the economic cycle, which can be broadly divided into four phases:
Early Expansion:
Characterized by recovery from recession, rising industrial production, and corporate earnings growth.
Sectors to watch: Capital Goods, Metals, Infrastructure, Auto.
Example: Post-pandemic India (2021-22) saw significant rotation into capital-intensive sectors due to economic revival and government infrastructure push.
Late Expansion:
Economic growth continues, but inflationary pressures increase.
Sectors to watch: Banking, Finance, Consumer Discretionary.
Example: During periods of strong credit growth, NBFCs and private banks often outperform.
Early Contraction / Slowdown:
Economic growth slows; earnings decline; interest rates may rise to control inflation.
Sectors to watch: FMCG, Pharmaceuticals, Utilities.
Reason: Defensive sectors maintain stable cash flows even during slowdown.
Recession:
Economic contraction, high unemployment, low consumption.
Sectors to watch: Gold, FMCG, Pharma.
Reason: Investors move to safe-haven assets and defensive equities.
5. Key Indian Sectors and Their Rotation Patterns
Banking & Financials:
Highly sensitive to interest rate cycles and credit growth.
Outperform during economic expansion and low interest rates.
Rotation cue: RBI policy changes, credit demand, and NPA trends.
IT & Software Services:
Considered defensive due to global revenue streams and recurring contracts.
Perform steadily during slowdowns but may lag during domestic growth surges.
Pharmaceuticals & Healthcare:
Defensive sector; stable revenue even during recessions.
Gains rotation interest during global uncertainty or domestic slowdown.
FMCG & Consumer Staples:
Defensive; high demand regardless of economic cycles.
Attract capital during slowdown and high inflation periods.
Automobile & Capital Goods:
Cyclical; benefit from rising disposable income and industrial demand.
Rotation flows in during early and late expansions.
Energy & Metals:
Sensitive to commodity prices and global demand.
Rotate in when industrial growth accelerates and global commodity prices rise.
6. Drivers of Market Rotation in India
RBI Monetary Policy:
Interest rate hikes often lead to rotation into defensive sectors like FMCG and Pharma.
Rate cuts encourage capital flow into cyclical sectors like Banking and Auto.
Government Policies:
Infrastructure spending or PLI schemes can trigger rotation into Capital Goods, Metals, and Electronics sectors.
Global Events:
Oil price spikes, US Fed rate decisions, and geopolitical risks influence rotations between Energy, IT, and Gold.
Valuation & Earnings:
Overvalued sectors see outflows, while undervalued sectors attract capital.
Investors rotate based on relative performance and P/E ratios.
Foreign Institutional Investor (FII) Flows:
FIIs significantly impact Indian markets. Strong inflows can rotate sectors like Banking, IT, and Pharma, while outflows often trigger a move to safe-haven sectors.
7. Strategies for Investors
Identify Macro Trends:
Track GDP growth, inflation, interest rates, and government policies to anticipate sectoral performance.
Follow Institutional Activity:
Monitor FII and domestic institutional investor (DII) flows to spot potential rotations.
Technical & Fundamental Analysis:
Use charts and valuation metrics to identify sectors or stocks ready for rotation.
Diversification Across Sectors:
Maintain exposure to both cyclical and defensive sectors to reduce risk.
Timing and Discipline:
Avoid chasing momentum; enter sectors early in rotation trends and exit before they peak.
8. Practical Examples of Market Rotation in India
2014-2015: Expansion in infrastructure and capital goods due to government’s Make in India initiative; rotation from defensive sectors to cyclical sectors.
2020-2021: Post-COVID economic recovery saw rotation into IT, Pharma, and FMCG sectors initially, followed by Banking and Auto as domestic demand revived.
2022-2023: Rising interest rates triggered rotation from rate-sensitive Banking to defensive FMCG and Pharma sectors.
9. Challenges in Predicting Rotations
Market Sentiment: Emotional trading can distort rational rotations.
Global Correlations: International shocks (oil, interest rates, geopolitical risks) can abruptly change rotation patterns.
Lag in Economic Data: Market reacts faster than published economic indicators.
Sector Concentration Risks: Over-reliance on one sector can magnify losses if rotation timing is wrong.
10. Conclusion
Market rotation is a powerful concept for Indian investors and traders seeking to maximize returns while managing risk. By understanding economic cycles, sector-specific drivers, and investor behavior, one can anticipate where capital is likely to flow next. In India’s diverse and dynamic market, rotation between defensive and cyclical sectors, as well as across asset classes, provides ample opportunities for disciplined and informed investors.
Successful rotation strategies require macroeconomic awareness, monitoring of institutional flows, valuation analysis, and timing discipline. While no strategy is foolproof, integrating market rotation principles into investment decisions can significantly enhance portfolio performance over time.
