Maruti Suzuki : Flag pattern breakoutMaruti given a flag pattern BO in last trading session with good volume.
If sustained over 7130, Buy can be initiated and there are several hurdles like marked in the chart.
Sl to be maintained below 6970.
Support and Resistance

How to trade based on Zones?This is an example of how I mark my charts while taking trades.
Defensive trading strategies are very good for sideways markets. The indices around the world are sideways and not making any fresh highs or lows.
The principle that I have explained on the charts is ideal for protecting your capital and has a higher chance of succeeding. When the price moves to either of the extremes, you should look at taking a trade on the opposite side.
This means that once the price approaches the higher boundary, you should be looking at selling and when the price approaches the lower boundary, you should look at buying.
This does not mean that you blindly set that marked price as the entry point, but you should wait for an extreme to be created and then take a trade only after the confirmation of your bias. Trading such markets requires patience and entries should only be made on the boundaries. If you enter a trade in any direction in the middle of the zone, you are likely to get trapped. What I mean by trapped is that your stop loss will become larger and probabilities are starting to move against you.
Trade only with capital you are willing to lose and maintain proper money management.
Feel free to ask questions, if you have any! :)

DRREDDY | Straight Flag Pattern Formation | Don't miss it straight FLAG PATTERN it can break either way so be cautious before taking the trade and don't be caught yourself in fake breakout
DON'T forget to check out my previous idea on Drreddy , it worked really well on 4 hrs time frame
Follow & like & comment

Airtel - Swing - Analysis Hii Everyone, I back with another analysis of Bhartiairtel. I am expecting a up move in coming days for following reasons :-
1. Near strong weekly Support ( yellow bar).
2. Follows same inverted round bottom format twice.
3. Corrected very much and with a high pace, so a pull back is expected.
4. Risk to reward is good here.


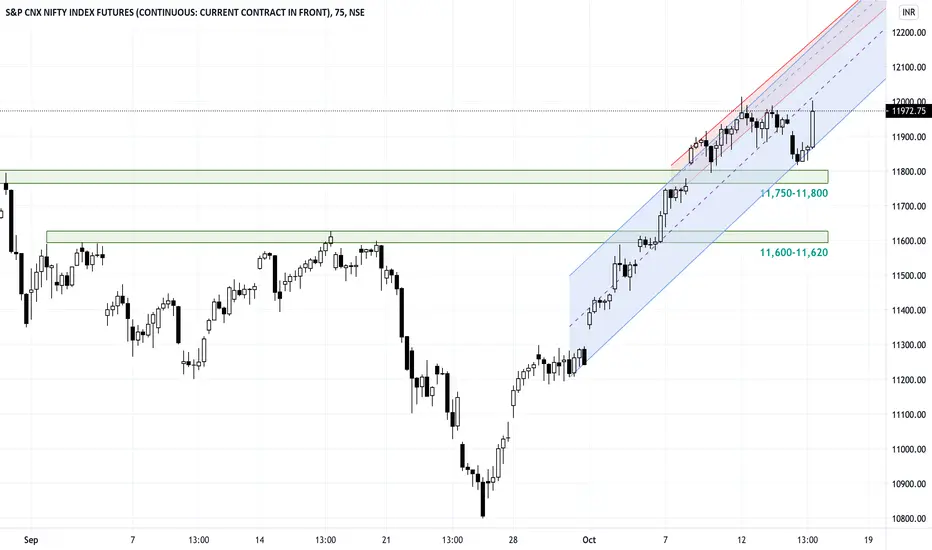
Nifty: Hot knife through Butter A complete “U” turn from the benchmark Nifty50 as it fell close to 2.5% in today’s session. No respect for the immediate support of (11,780-11,800) as the index cuts through and retraces gains of past six trading sessions. Thanks to this sharp sell-off one aspect is now confirmed - our rising channel has yet again proven itself as a strong source of resistance.
Considering the underlying momentum with which the index sold-off today further slide towards (11,570-11,620) is very much a possibility now. As I was saying yesterday - keep your seat belts fastened as we head for some volatility.
Trade Well. Trade Wise.

Nifty: Nowadays Bulls take the Elevator tooNifty behaved exactly the way it was anticipated. A short-term dip, enough to get bears interested and create positions. And then bounced back sharply from close to anticipated supports at (11,750-11,800). I have drawn two rising channels on this chart, which I sense will now provide immediate resistances. Going ahead, I feel the index will face resistances from multiple levels like (12,000-12,100) and further upwards at (12,200-12,250). Strategically this is not the best state to go aggressively long. And to initiate short positions you need to be patient to enter and impatient to exit … easier said than done.
On the downside, today’s low will be critical and only a break of this level will set in some selling impetus. I feel we are headed for some volatility now. Fasten your seat belts.
Trade Well. Trade Wise.
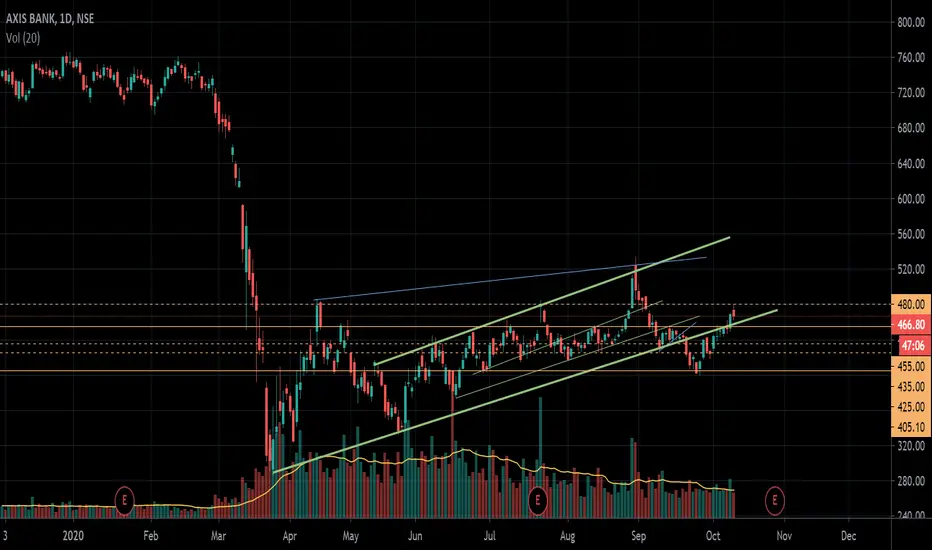
Some imp levels for AXIS bankChart shows Support and resistance levels. NSE:AXISBANK .
Comment about how and from where you get your financial knowledge.
BANNIFTY - UNDERSTANDING CHARTS ( 6th & 7th October 2020)Second chart from the series of taking a look at the week that was in BankNifty. This week was very bullish trend in the market.
This chart indicates the overall breakout of the BANKNIFTY from it's bearish trend.
The previous two trading sessions have been studied in the below chart.
October 6th Trading Session
BULLISH MOMENTUM IS CONTINUED FROM THE PREVIOUS SESSION.
MARKET OPEN GAP UP BUT PROFIT BOOKING SEEN IN FIRST CANDLE.
SIDEWAYS MARKETS UNTIL 2PM SHOWING CONSOLIDATION
2PM BREAKOUT WHICH SETTLES ABOVE PREVIOUS DAY RESISTANCE
October 7th Trading Session
SLIGHT GAP DOWN IN THE OPENING CANDLE. BTST TRADERS BOOKING PROFIT IN THE MARKET OPEN.
EVENTUALLY BUYERS WIN THE TUSSLE. BUYING VOLUME IS HIGH.
PRICE BREAKOUT OVER THE PREVIOUS DAY RESISTANCE.
BULLISH MOMENTUM IS SUSTAINED.
PREVIOUS DAY RESISTANCE TRENDLINE TAKES SUPPORT IN THE FOLLOWING TRADING SESSION
ENTIRE TRADING SESSION HAS BEEN ONE BIG CONSOLIDATION AS THE PRICE IS CLOSE TO THREE MONTH RESISTANCE.
NOT ENOUGH BUYING AT 2PM FOR BREAKOUT, SELLERS WON.

What is UPTREND in #priceaction trading?If the market is pulling towards upside direction with less magnitude towards downside direction we can call it as an uptrend.
Characteristics of an uptrend:
1) Higher High and higher low pattern in the swings
2) Less magnitude in secondary swings or downside swings in this case
Hope this helps:)
Nataraj Malavade
Author of Mastermind of Day Trading
Quant Trader | Author | Blogger

Learn RSI Part 1 : Basic of Relative Strength IndexHello Traders,
I am back with the new educational concept. You may have often heard the word "RSI"
We are going to study about RSI : "Relative Strength Index", which is the most used indicator.
RSI is the price following indicator and it provides important levels from 0 to 100.
The important levels of RSI are 40-60, 70-30 and 50
-------------------------------------------------------------------------------------
Why do we practice RSI?
There are a few reasons for using the most important indicator.
1.) It provides over bought & oversold levels.
If RSI goes above level 70, we can say it has "overbought" and if RSI goes bellow level 30 we can say it has "oversold"
Q.1 What is oversold & overbought?
A: These two terms are extreme level when the price reaches this level, reversal is possible
So shall we travel further? YES! Cool!
2) RSI gives us the direction of where the trend is going!
I have added level 50 as an important level.
So, if the price is below level 50, we can say that atmosphere is bearish and if price is above level 50 we can say that atmosphere is bullish.
In short, Bearish below level 50
Bullish below level 50
It is better to draw a horizontal line at level 50, to have a check on it easily!
We will continue the series it will cover the divergence and many more indicators.
---------------------------------------------------------------------
If you have any doubts, you can put them in the comment section below.

ADANIPORTS ANALYSIS200 DMA is a great simple strategy which provides good RR trades such as this one.
The idea here is simple. Markets tend to be range bound 80% of the time, which is called the contraction phase. The other 20% of the time the market is breaking out, called the expansion phase.
To win the game, it is important to understand the probabilities and play the probabilities.
For the price to breakout above key resistance levels and breakdown below key support levels, there has to be a catalyst that enables this to happen. The catalyst can be macro-economic news, good/poor earning reports, breakout of war, elections etc.
Such news comes about often but is still rather rare. Range bound trades enable a higher probability of success and lower risk as the stop loss that one can place is closer to the price. A breakout trade on the other hand will have a stop loss on the other extreme of the range, increasing the risk significantly.
Hammer pattern which has been formed on this chart is a good indication of a a fresh bearish move starting. It shows that the higher prices have been rejected yet again.
DM me if you have any questions and LIKE if you found this helpful! :)

Dow Corrective Wave B and C PendingDISCLAIMER:There is no guarantee of profits nor exceptions from losses.
Technical analysis provided on the chart is solely the personal views of my research.
You are advised to rely on your own judgments while taking any investing/Trading decisions.
Past performance is not an indicator of future returns. Investment/trading is subject to market risks.
Seek help of your financial advisors before investing/trading.
Just for educational Purpose

DAX Corrective Elliot Wave looks to be StartedDISCLAIMER:There is no guarantee of profits nor exceptions from losses.
Technical analysis provided on the chart is solely the personal views of my research.
You are advised to rely on your own judgments while taking any investing/Trading decisions.
Past performance is not an indicator of future returns. Investment/trading is subject to market risks.
Seek help of your financial advisors before investing/trading.
Just for educational Purpose

Reliance Correction and Market GeometryThis is called Market Geometry. Reliance in correction mode. B retraces 50% of A and usually A=C or C is bigger than A by 161.8%.
DISCLAIMER:There is no guarantee of profits or no exceptions from losses. The investment advice provided is solely the personal views of my research. You are advised to rely on your judgment while investing/Trading decisions. Past performance is not an indicator of future returns. Investment is subject to market risks. Seek help of your financial advisors before investing/trading.
--------------------------(((((LIKE)))))-------------------------------


Reason why Marico reversed suddenly ? Marico reversed big in the last trading session because the price reached the major support level ( major because this level plays from 2017 ) which is shown in the analysis. So the price wont reject too big without reason.
Start your analysis in bigger time frame to find this small small clues !!!

TWO PROFITABLE TRADE IN ONE DAY IN ONE SCRIPT1.THE DOJI CANDLE STRATEGY AND
2. THE FIBO STRATEGY
.
A BUY WAS GIVEN AT 12.17 AT 2002 IT WENT AND GAVE EASY 1 %
A SECOND BUY WAS GIVEN AFTER FIBO SUPPORT

Natural Gas intrady tradeThe current support for Natural gas is 162.7. If the candel breaks the 162.7 and open new candel below that then it may go down few points.
sell range (162.6-162) Note: only when the candel opens below 162.7
stoploss (164-165)
Target (160-159)
Note: The Target which i Given is based on pivot and previous support & Resistance
This is only for educational purpose only
(Tradeing is Probability)


HDFCLIFE taking trendline support HDFCLIFE taking trendline support on 1HR TF and near support zone.. can enter long if trendline breaks before breaking support zone.

Bank nifty 21-Sep to 25-SepBNF may trade in a zone of 22750 to 21900. Breaking the lower zone of 21900-21800 will lead to 21600-21500. Upper zone of 22750-22850 would be acting as resistance. Breaking 22500 and sustaining above will change things completely for a target of 22700, 22900 & 23000.

