HINDPETRO REPEATABLE PRICE ACTION FORMATION I always wait for this kind of price action formation because its very simple and also very common pattern in the formation of HH HL, There is a Trendline acting as a support, Now I need a break of counter trendline to take a trade.
Support and Resistance

NIFTY: What's NEXT? Spot & FUT important Level for 10/07/2018Modified Nifty Fut Levels plotted on Chart.
Crucial Levels to Watch: Mentioned "TFZ / HZ #2 -> 10915 - 10899", Optimum Level 10931.
Education Purpose Only.


5 year weekly chart - support and resistanceTrying to find strong support and resistance levels of Dalmia Sugar. If it goes below 52-50 we might see a more downtrend by if it crosses the support (intermediate) of 90-95 levels then it can go up.
Learning the support and resistance so thought to try it out on a cyclical stock

BANKNIFTY: At a Glance Weekly & Intra(26/06/18) FUT+ Weekly Spot...... Spot & Future Intraday, Future Weekly Levels
Plotted & Mentioned on chart.
Trade as per Specified level with description.
FUTURE Trader must take position with Hedge strategy.
Disclaimer: Information given here, Study/Education purpose only.
For taking trade decision Consult with your Financial Advisor.
If Useful Like & Share

Nifty Range Levels for 6th JuneNifty Range Levels for 6th June based on daily price action
Please use this chart in coordination with this earlier chart I posted which is based on a wider range of price action:

Nifty Ranges valid from 4th-8th JuneNifty Ranges valid from 4th-8th June. It is a wide range so trade carefully.
I have displayed 4 hour candles in the chart so the entire range is visible and yet the candle movement too can be seen on a day to day basis.
Also the Ichimoku Kinko Hyo should guide viewers about the bearish/bullish price action in the 4th-8th June trading week and accordingly set SL and targets based on the range levels.
As the week progresses you may have to press the button and adjust the zoom levels of this chart to clearly view the price action.

High Probability Ranges - Valid from 30th April - 4th May 2018
These are the results of some range calculations I have been using regularly for some months. These Fibonacci based ranges work for any candle duration.
The present calculation is based on price action of the week April 23rd-27th 2018. Valid from April 30th-4th May 2018

VIJAYA BANK- COMPOSITE OPERATOR'S HEAVENThis is a case study, which is a part of my learning experience for future records
No investment...
not an investing/trading recommendation
details of the small accumualtion and distribution and further time line to b updated below and continued as a study
For reference, this is 1994 edition of Jim Forte's "anatomy of trading range"
static1.squarespace.com
static1.squarespace.com
For redistribution in specific , i love these wonderful blog posts of Bruce Fraser
stockcharts.com
stockcharts.com
stockcharts.com

Ultratech cement- the big becoming biggerthe markup target has been derived from this point and figure chart..
This is a classic case of stepping stone reaccumualtion
there is one prior reaccumualtion which needs a special study as a case
will be updating below
Disclaimer.. Not invested, Not an investing / trading recommendation

INDUSIND BANK Wyckoff Reaccumulation - An lovely case to studyNSE:INDUSINDBK BSE:INDUSINDBK
the markup will require time to build up, the Bank nifty index over all showing a lot weaknness at resistance...
So this might be an excellent posiiton to accumulated and add, taking advantage of the short term market weakness ..
the markup target was derived from this Point and Figure chart ...
for reference on wyckoff schematics this famous text by Jim Forte "anatomy of a trading range " can be used..
static1.squarespace.com
Disclaimer.. not invested, not an investing/trading recommendation

HAVELLS support. Gonna go up!As there is a support noticed for HAVELLS as given in the chart, possibly going up and possible target would be ~630 - 640.
CMP 621.85
This is just for my reference!

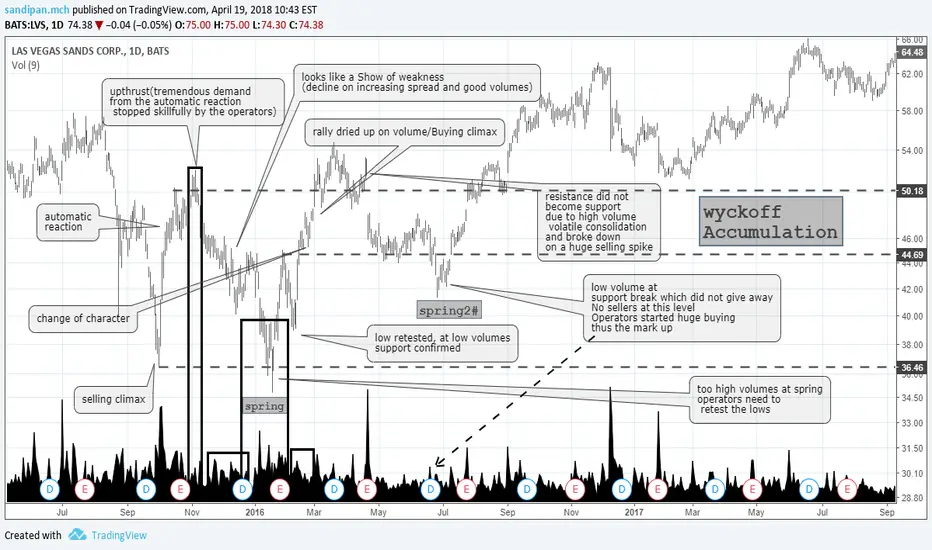
lEARNING WYCKOFF METHODS-Case examplesSubsequent time line of event will be updated below
Disclaimer- not n investing/trading recommendation
ACCUMULATION VS REDISTRIBUTION DILEMMA NSE:JINDALSAW BSE:JINDALSAW
Disclaimer... Invested, not an investing/trading recommendation
My thinking process has been described and plans following

IDEA cellular , levels for april.need to watch result of airtel on 24 . and also track that on daily basis to trade this stock ..!

doji it may now take support around 138 i am analysing the price action in the range it has formed now. series of pinbars at the bottom of the range of 130 and then 14% gain in two days followed by two days price running around that price forming pin bars and then third day collapse like building to the bottom and 4 days of price recovery at the bottom and again 14 % of s gain, if someone would have played this range, omnne could have made 45% of money in two weeks, isn,t interesting play?
i feel the play starts from 138 to next range of 157. if you are intellingent or know tactics to buy at the lower range and play for the next range then you can make money. on weekly chart it has moved away from the trendline so praobably to catch up with the weekly trendline the play will be on for the next range, this play may not be as swift as the one you have seen. watch out for the price action, i will update my observations

NIFTY's View Nifty has formed Broadening Formations : Right-Angled and Descending . After touching the lower line 3rd time it was moving up gave an impression to touch the other side of pattern but again it has reversed and continued in the prevailing down direction. Statistically this partial rise mostly predicts the direction of the breakout which is down in this case, however demand may emerge in price zone of 10145 - 10095. If that fails to provide support we may witness free fall till 9700 as there is no significant support in this zone.

WAITING FOR USD/CAD BREAKOUT (BULLISH OR BEARISH)SHORT TIME MAKE GOOD PROFIT PLEASE KEEP AND WATCH...
Disclaimer:
The information contained in this presentation is solely for educational purposes. Does do not constitute investment advice. I may or I may not take the trade.
The risk of trading in securities markets can be substantial. You should carefully consider if engaging in such activity is suitable for your own financial situation.
I am not responsible for any liabilities arising from the result of your market involvement or individual trade activities.

How to trade Range/Channel One of the pattern that occurs very often is the range. One can trade it easily this formation using only price action without any help from indicators or other studies. Whenever the price breaks out of the range in either direction we can look for entry into the trade. There are 3 ways to enter marked in the chart.
1. Enter on the breakout.
2, Enter on the pull back to the breakout level.
3. Enter after the pull back or retest of the breakout level is over.
We need to keep in mind the fact that breakout attempts to fail quite often so entering on breakout of the level has its own risks. Entry at pull Back after successful breakout is better but it does not happen always. One can also enter on break of swing pivots.
Please practice and post your charts as comment. Practice only would train your eyes to recognize it.


MRF - round bottom is time for long?MRF formed Round bottom. The current trend in ascending channel. So expecting a breakout from the resistance at 69830. Once it broke it is resistance it will be good for long.
Height of cup 8269
Neckline 69830
buy above 70500
Target 1 78099
CBSL 69825

AMARAJA long based on S & R Amamaraja now has a resistance at 200 EMA. It made a round bottom at Daily Time Frame
Will Raja will conquer the resistance?.
Once breaks it resistance we can initiate a long.
Buy above 812
Target 1 : 821
Target 2 : 847
Target 3 : 904
CBSL (Strict) : 800

Hero Moto: Weeky, Facing resistance near D zone of AB=CD patternNSE:HEROMOTOCO Weekly Chart: Hero just tested the 'D' level of AB=CD pattern (= 4100 zone) & facing resistance. Stock likely to test 0.618 of Fibo = 3236 level (Marked with white arrow). Bias remains bearish, But not safe to short as Risk Reward Ratio is not good here.
