Indigo Is in the verge of breaking my Quant Box.In daily and 30 min chart, Indigo has shown a consolidation of COI . Which clears, if it breaks either side and stands then it might give a multi-range target.
Please check the chart where I have provided a short-term multi-range target. Another side of the wall of the Quant box will be the Stop Loss.
The traders can plan their trade with derivative products also as per their risk.
Standard Disclaimer: Please consultant your financial advisor before investing. This report is for training purpose
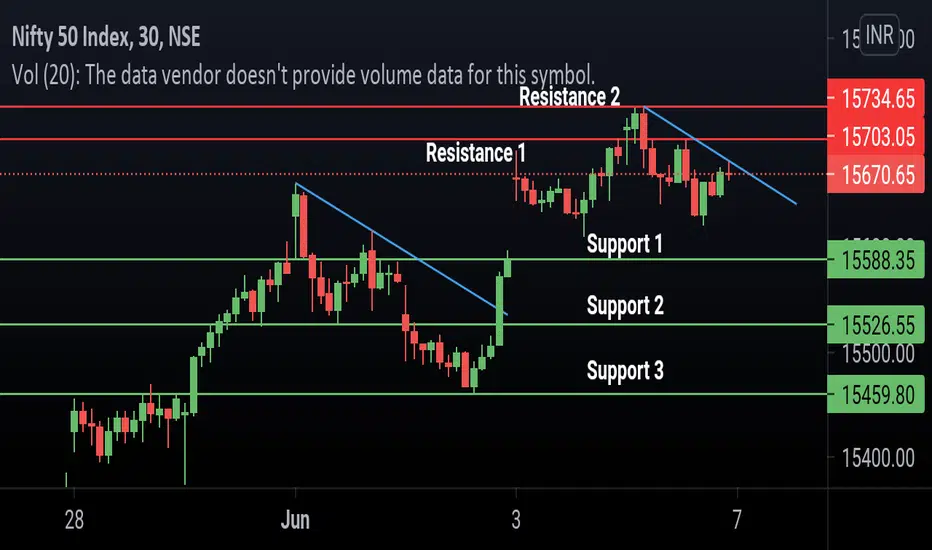
Support and Resistance


Power Grid Corp is in UptrendPower Grid can make an all time high in coming few weeks, watch this stock.

** WEEK ANALYSIS AND AN ASSINGMENT TO YOU TRADERS **In the video , i have analyzed our own Setup for the week from Mon 07.06.21 to Fri 11.06.21.
How was out Setup ?
What trades we took ?
All has been answered.
In the end i have given you a task to do. Please leave behind your answer in the Comment.

IRB INFRASTRUCTUREOpening Price 124.95 on 9th June 2021
If 129.4 Broken then 134 can be seen in an intraday trade.
Stop Loss - 125
This study is for only educational purpose. Make your own decision for taking a trade

HOW TO BUY STOCKS USING MOVING AVERAGEMoving average is the most common indicator in technical analysis also be the most important indicator, as it serves as the foundation of countless others.
1) What is a moving average?
Moving average (MA) is a simple technical analysis tool that smooths out price data by creating a constantly updated average price. The average is taken over a specific period of time like 10, 20, or 50 days, or any time period as suitable. The indicator is known as a ‘moving’ average, since its value keeps changing as the data keeps changing over time. I have used a band of 20 DMA.
Here’s an example. Say the closing prices of ITC for the last 5 trading days are:
Closing prices
Day 1: Rs. 215
Day 2: Rs. 220
Day 3: Rs. 222
Day 4: Rs. 226
Day 5: Rs. 239
In this case, the moving average of ITC for a 5-day period is calculated like this.
= (Day 1 price + Day 2 price + Day 3 price + Day 4 price + Day 5 price ) ÷ 5 days
= (Rs. 215 + Rs. 220 + Rs. 222 + Rs. 226 + Rs. 239) ÷ 5 days
= Rs. 224.
When used appropriately, they provide easy insight into a trend’s direction, its magnitude, support and resistance. Works magically, for those who depend on support and resistance strategies to generate entry points. However, for those who prefer to trade price reversals, using moving average crossover strategies is perfectly viable as well.
2) How to buy stocks using moving average? (I use a band of 20 DMA as my strategy)
a) By identifying support and resistance as shown in the chart: A moving average can also act as support or resistance. In an uptrend, an average may act as a support level, as shown in the chart. This is because the average acts like a floor (support), so the price bounces up off of it. In a downtrend, a moving average may act as resistance; like a ceiling, the price hits the level and then starts to drop again.
b) By identifying the trend as shown in the chart: Look at the direction of the moving average to get an idea of which way the price is moving. If it is angled up, the price is moving up, angled down, and the price is moving down, if moving sideways, and the trend is likely in a range.
Disclaimer I'm not an expert, i'm still learning. Sharing knowledge will enrich me with more knowledge. This strategy works well for me it may or may not work for you. I tried to explain in a layman's point of view. I reserve the right to be wrong.

triangle pattern breakout in IBULHSGFINThis is a weekly chart of IBULHSGFIN as we can see it gave a good triangle pattern breakout and this stock turning bullish. It sustains 246 levels then the next level is 360.


Creating Lines with ShortcutsCreating lines on a chart is one of the most fundamental methods of charting when performing technical analysis . Being able to create these effectively and quickly is a very useful skill to have.
Horizontal, Vertical and Cross lines can all be found on the drawings panel to the left of the chart in the subgroup “Trend Line Tools”. These tools can be added by selecting them from the subgroup and then placing them on the chart.
However, a more efficient method to creating these lines is to utilize the hotkey functions:
Horizontal Line Shortcut:
- Alt+H (PC), or Option+H (MAC)
Vertical Line Hotkey:
- Alt+V (PC), or Option+V (MAC)
Cross Line Hotkey:
- Alt+C (PC), or Option+C (MAC)
Becoming more efficient in your ability to draw lines on your chart will allow for quicker identification of areas of support/resistance and times on your chart.
Be sure to visit our help center to learn more about these tools!
More information on the Horizontal Line tool:
www.tradingview.com
More information on the Vertical Line tool:
www.tradingview.com
More information on the Cross Line tool:
www.tradingview.com

Titan Channel break outTitan consolidated and now trying to move further up side...Consider it for short term

Parallel Channel- A great tool for Identifying Trends
A parallel channel which can also be termed as a price channel is a tool to identify a share’s price in bounded parallel lines. It can be horizontal, ascending or descending. It’s a great tool for those traders who believe or trades with the idea of Price action.
A parallel channel can be formed when the price of a security is restricted by supply and demand and can be upward, downward or sideways trending. It shows the trend on which the security might be headed towards or on the verge of breaking it to reverse its direction. It can occur on various time frames and can be created on various instruments like stock, mutual funds, ETFs etc.
The two parallel lines act just like the Resistance and Support. The upper line acts like the Resistance and the lower line acts like Support. A lower trendline is when the price pivots higher, and an upper trendline when the price pivots lower. The steepness of the parallel lines decides the direction of the price it moves.
Ascending channel will be bounded by positive lines indicating that the price is trending higher with each closing of the bar. Likewise, a breakdown of the lower line means that price has moved significantly and now it will see some profit booking and makes a good opportunity for profit booking.
Descending channel indicates that price is trending lower with each bar it is forming. Whereas a breakout of the upper channel conveys that the trend has changed and now the price will move upwards.
As in this example of Axis Bank Daily chart, you could see a Descending Parallel channel which did retrace to its lower price channel and that makes it a good entry point after which it broke the upper channel with good volume confirming its upwards rally.

Lecture-4 Support and resistance, how to analyze.This is the fourth video of the topic basics of the stock market. The video deals with the support and resistance level in stock market price action.
#supportandresistance #basicsofstockmarket


FINDING POTENTIAL SUPPORTMETROPOLIS COMPLETED 5 IMPULSIVE WAVE ON MINOR DEGREE FOLLOWING WHICH IT IS CORRECTING RIGHT NOW.POINT IS WHERE IT WILL END AS STOCK IS IN CLEAR UPTREND AND GETTING LONG IS IDEAL TRADE ON THIS STOCK TO TAKE AS WAVE 3 OF INTERMEDIATE WILL BE STIPPER AND RAPID.
PRICE ZONE OF 2227-2211 CAN ACT AS GOOD SUPPORT REASON'S ARE AS FOLLOWS
1)PREVIOUS MULTIPLE HIGH'S WHICH ACTED AS RASISTANCE CAN NOW ACT AS SUPPORT WHICH COMES NEAR THE MENTIONED PRICE ON CLOSING BASIS.
2)50% RETRACEMENT OF ENTIRE SWING COMES@2227(WAVE 1),WHICH IS WHERE GENERALLY WAVE 2 CORRECTION END.
3)TODAY'S HIGH WHICH BRIEFLY CROSS 62% RETRACEMENT OF WAVE A@2509,REVERSED MEANING WE ARE DONE WITH WAVE B AND WAVE C PROJECTION OF 123.6% WAVE A FROM TODAY'S HIGH COMES @ 2211.
ONE SHOULD LOOK FOR A BULLISH CANDLE IF PRICE COMES BETWEEN 2227-2211 ZONE.IF WE ALSO GET GOOD VOLUMES ALONG WITH BULLISH CANDLE IN THIS ZONE THAN THAT WOULD BE ADDITIONAL CONFIRMATION.

ICICI BANK at support zoneIn prices earlier resistance becomes a support.
Note: Price will not exactly take suport and resistance so zones form. It this chart Price take support at the zone.
My personal view is that ,stock is in an uptrend so at this point of time we should watch it carefully and wait for weekly close ,it will decide whether it get set for up or down move.


Stair Steps Pattern | ULTRACEMCO 🎯The stair steps pattern overview
The stair steps pattern forms along with the trend .It shows an uptrend where the price rises and falls abruptly. The graph reminds the stairs, thus a name of the pattern
In the uptrend, you may notice long consecutive bullish candles. Then, the price adjustment takes place and the cycle starts all over again. The price correction areas create new levels of resistance which soon will be broken again so the uptrend continues.
Best of luck!

IRON FLY STRATEGY FOR NIFTY 10 MAR EXPIRYIron Fly is a non directional strategy that works very well in a sideways market. I was of the view that the market would be sideways for the reasons mentioned in the video. This worked very well for the weekly expiry and it is used very often in confusing markets such as this.
This was one of my first attempts at vocally explaining strategies so I may not have been as clear in the details.
Let me know if you have any questions about this strategy in the comments. Please LIKE if you would want to see more content like this. :)
