ICICIBANK – Bullish Setup (Short-Term)ICICIBANK – Bullish Setup (Short-Term)
ICICIBANK is showing strength and holding above key support.
Price action suggests a continuation move on the upside.
📈 Outlook: Bullish
🎯 Target: 1386 (short-term)
🛑 SL: Below recent swing low
Momentum looks positive; expecting price to move higher in the c

The best trades require research, then commitment.
Get started for free$0 forever, no credit card needed

Scott "Kidd" PoteetThe unlikely astronaut

Where the world does markets
Join 100 million traders and investors taking the future into their own hands.

ACC | On the Verge of a Breakdown? | Daily Chart | Bearish Bias
📉 Summary
ACC has been compressing into a descending structure, forming Lower Highs since 24 April 2025, while holding Equal Lows near ₹1770 since 03 March 2025.
Repeated tests (4+ times) of the same support zone have reduced its strength, hinting at a potential breakdown setup.
Price action sugge

Angel One on the Edge: Long-Term Chart Points to 4800+The monthly chart of Angel One shows a well-defined broadening wedge pattern, where price has been repeatedly oscillating between a rising support line and a widening resistance zone. The structure has been forming for almost two years, indicating a long consolidation phase after a strong uptrend. C

HIND ZINC:At the verge of a Huge breakoutHIND ZINC:Trading at 545
Trading above all its Moving averages even in weekly chart with 10 DEMA Golden Cross over.
Formed a rounding bottom in weekly chart also.
Combination of the above suggests a move towards 600+(For educational purpose only)

Hdfc life Longattached chart is of hdfc life where the stock is trying to absorb the supply from the last 1 month around 770 levels. The stock is likely to move towards 800 levels in the coming session. We can attempt this one with the stop loss around 754 and entry around 770 levels.

Glenmark Pharma shows a strong uptrend with periodic correctionsGlenmark Pharma has been moving in a clear weekly uptrend where each strong rise has been followed by a period of consolidation before the next move. This sequence appears three times on the chart, marked as rally and correction phases.
After the most recent rise, price has entered a narrow downwar

VST Tillers"Here’s a quick breakdown of a beautiful daily setup on VST Tillers.
After a strong 75% move earlier, the stock spent months forming a tight re-accumulation base.
Low volatility… higher lows… and price is surfing the 8 and 21 EMAs perfectly.
Last few days?
Super tight candles… almost no volatility

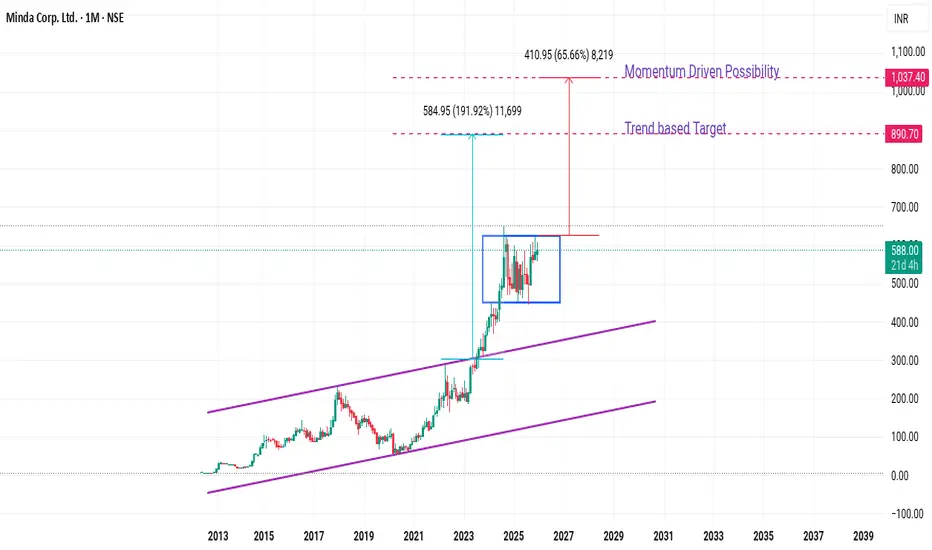
Minda Corp: A Technical Breakout Story with Strong FundamentalsThe chart reveals a compelling multi-year growth trajectory. From 2013 to 2023, Minda traded within a well-defined upward channel, building a strong foundation between ₹100-400 levels. The real excitement began in 2023 when the stock broke out of a decade-long accumulation pattern.
The most signifi
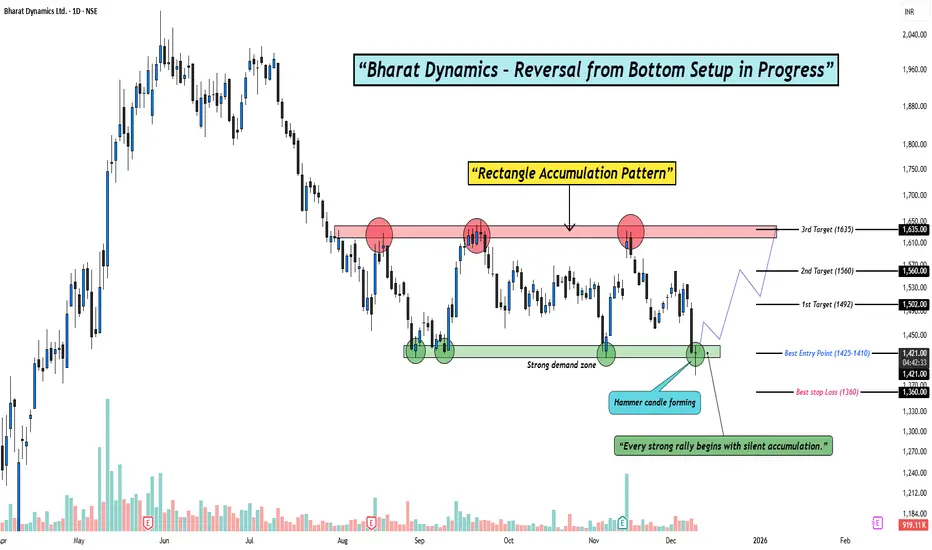
Smart Money Accumulating BDL — Are You Watching This Setup?Hello Traders!
Today’s analysis is on Bharat Dynamics Ltd. (BDL) where a clear Reversal from Bottom Setup is developing. After weeks of sideways consolidation, the stock has formed a clean Rectangle Accumulation Pattern right above a strong demand zone. The latest Hammer candle appearing insid
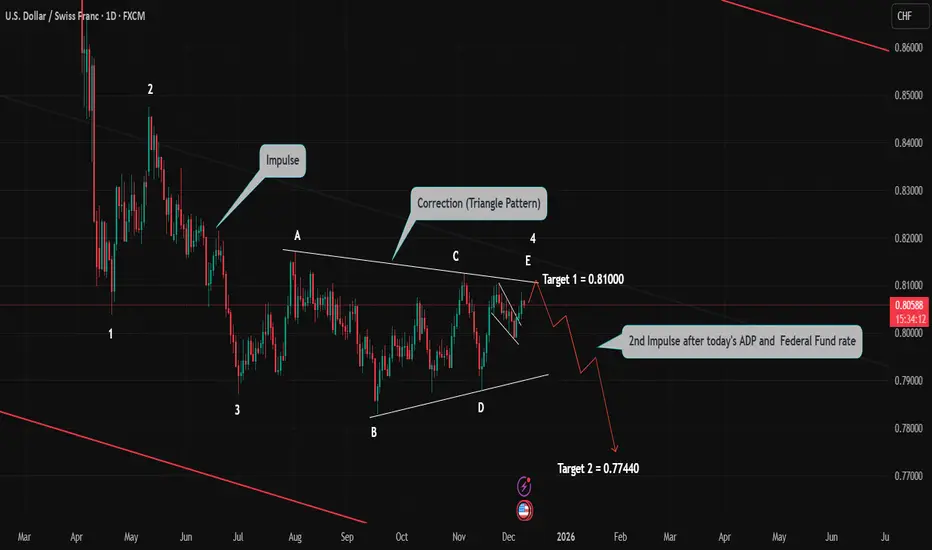
USD/CHF in Daily time frameBy Wave Analysis, Initial move to little upside for the target1 mentioned in the chart. Once the "E" wave of Triangle pattern completed, then strong impulse of downside to Target 2 is expected.
Technically the pattern is ready for big move, but fundamentally ADP and Federal fund's rate will decide
See all editors' picks ideas
Volume Gaps & Imbalances (Zeiierman)█ Overview
Volume Gaps & Imbalances (Zeiierman) is an advanced market-structure and order-flow visualizer that maps where the market traded, where it did not, and how buyer-vs-seller pressure accumulated across the entire price range.
The core of the indicator is a price-by-price volume prof

Match Finder [theUltimator5]Match Finder is the dating app of indicators. It takes your current ticker and finds the most compatible match over a recent time period. The match may not be Mr. right, but it is Mr. right now. It doesn't forecast future connection, but it tells you current compatibility for today.
Jokes aside,

Trend Line Methods (TLM)Trend Line Methods (TLM)
Overview
Trend Line Methods (TLM) is a visual study designed to help traders explore trend structure using two complementary, auto-drawn trend channels. The script focuses on how price interacts with rising or falling boundaries over time. It does not generate trade sign

Breakouts & Pullbacks [Trendoscope®]🎲 Breakouts & Pullbacks - All-Time High Breakout Analyzer
Probability-Based Post-Breakout Behavior Statistics | Real-Time Pullback & Runup Tracker
A professional-grade Pine Script v6 indicator designed specifically for analyzing the historical and real-time behavior of price after strong All-Ti

Count█ OVERVIEW
A library of functions for counting the number of times (frequency) that elements occur in an array or matrix.
█ USAGE
Import the Count library.
import joebaus/count/1 as c
Create an array or matrix that is a `float`, `int`, `string`, or `bool` type to count elements from, t

Holographic Market Microstructure | AlphaNattHolographic Market Microstructure | AlphaNatt
A multidimensional, holographically-rendered framework designed to expose the invisible forces shaping every candle — liquidity voids, smart money footprints, order flow imbalances, and structural evolution — in real time.
---
📘 Overview
The Hol

PriceFormatLibrary for automatically converting price values to formatted strings
matching the same format that TradingView uses to display open/high/low/close prices on the chart.
█ OVERVIEW
This library is intended for Pine Coders who are authors of scripts that display numbers onto a user's charts. T

LogNormalLibrary "LogNormal"
A collection of functions used to model skewed distributions as log-normal.
Prices are commonly modeled using log-normal distributions (ie. Black-Scholes) because they exhibit multiplicative changes with long tails; skewed exponential growth and high variance. This approach i

Range Oscillator (Zeiierman)█ Overview
Range Oscillator (Zeiierman) is a dynamic market oscillator designed to visualize how far the price is trading relative to its equilibrium range. Instead of relying on traditional overbought/oversold thresholds, it uses adaptive range detection and heatmap coloring to reveal where pri

Volume Surprise [LuxAlgo]The Volume Surprise tool displays the trading volume alongside the expected volume at that time, allowing users to spot unexpected trading activity on the chart easily.
The tool includes an extrapolation of the estimated volume for future periods, allowing forecasting future trading activity.
🔶 U

See all indicators and strategies
Community trends
Bajaj Finance: Impulse Complete, Correction in ControlBajaj Finance completed a clean five-wave impulsive advance , topping out near ₹1,102.5 , followed by a clear loss of momentum. Since that peak, price action has shifted from trend to overlap , signaling a corrective phase rather than continuation.
Structurally, the decline is unfolding withi

IDBI Bank an opportunity to play disinvestment by Government IDBI Bank – Multi-Timeframe Technical View blended with disinvestment opportunity.
IDBI Bank is trading near ₹99.8, testing a crucial long-term resistance zone around ₹100, visible on monthly and weekly charts. On the monthly timeframe, the stock has formed a strong rounded bottom from the ₹35–40 z

Big Cycle Big Move (HINDZINC)Friends, W. D. Gann theory involves many important concepts, such as the correction that occurs after a stock reaches its all-time high. If this correction is at least 50%, it can create a good buying zone. This pattern has been observed in many stocks before( Bharat Dynamics Ltd / Angel One Ltd etc

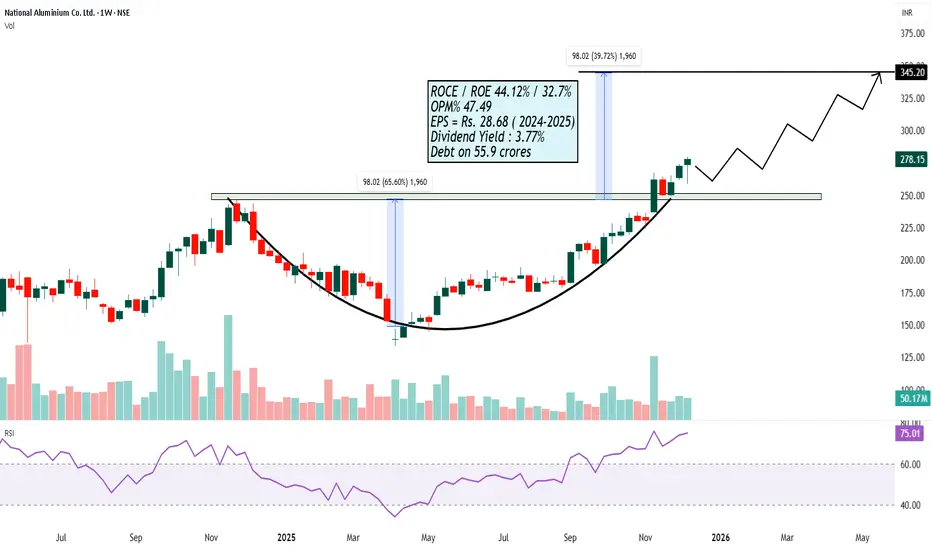
NATIONALUM | Weekly Chart | Positional ViewOn the weekly timeframe, NATIONALUM is showing a clear trend reversal structure after a prolonged corrective phase.
The price has formed a rounded bottom pattern, indicating gradual accumulation and a shift in market sentiment from bearish to bullish. Such structures generally reflect smart money p
Seeing vs Believing: Multi-Pattern Structure vs Single-Line BOOn the left, the weekly chart is mapped as a full A+ type setup, where multiple structural elements work together instead of relying on a single, convenient line.
-A red counter trendline marks a series of lower-high rejection points, visually defining the “least liquidity” supply line that price h

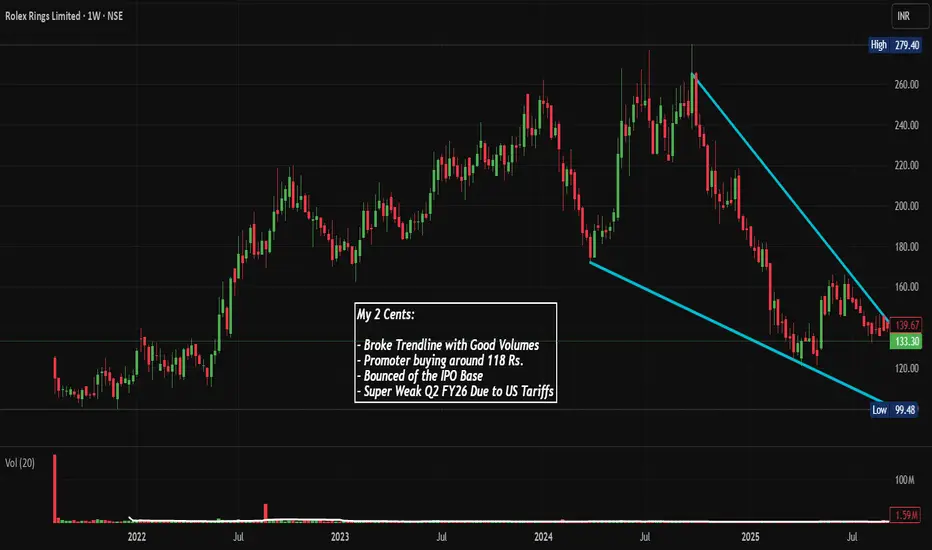
ROLEXRINGS: Trendline BO & IPO Base Bounce, Chart of the WeekFrom IPO Highs to back to IPO Base: Can Rolex Rings Break the Downtrend After 64% Crash?
After Promoter Buying and Decent Mangment Commentary Post Q2 FY26 Amid US Tariff, Let's Decode in This Week's "Chart of the Week"
As per the Latest SEBI Mandate, this isn't a Trading/Investment RECOMMENDATION
Minda Corp: Structure Over PredictionMinda Corp has spent a long time facing rejections at higher levels, which is clearly visible on the left side of the chart. Those rallies failed because price could not sustain above structure.
The recent phase shows a change in behaviour. Instead of sharp rejections, price is now holding above ke

HINDALCO – Weekly Chart | Long-Term Bull Market IntactHindalco continues to trade within a structural long-term bull market on the weekly timeframe.
The advance from the 2020 low unfolded as a clear impulsive sequence, with an early leading diagonal followed by a strong trend phase. The recent decline appears corrective in nature and has respected key

GILLETE BAT 0.8 revGILLETE BAT 0.8 rev on order block which make more pull up, consolidate and order block cover happen by that 0.8 zoon

Sandur Maganese - Bullish Flag PatternSandur Maganese is into mining sector and is heading for a 70%+ returns on account of following:
1. It is making a bullish flag pattern which is a continuation pattern, on breakout it is heading for a big run.
2. See how during consolidation phase the volumes have dried down and have started gain

See all stocks ideas
No scheduled reports
Today
W
WAKEFITWakefit Innovations Limited
Exchange
BSE
Offer price
2.06 - 2.17
USD
Today
R
RDELRIDDHI DISPLAY EQUIPMENTS LIMITED
Exchange
BSE
Offer price
1.06 - 1.12
USD
Today
C
CORONACorona Remedies Limited
Exchange
BSE
Offer price
11.20 - 11.80
USD
Today
ANIMCorona Remedies Limited
Exchange
BSE
Offer price
11.20 - 11.80
USD
Today
P
PRODOCSProdocs Solutions Limited
Exchange
BSE
Offer price
1.46 - 1.53
USD
Today
AKNProdocs Solutions Limited
Exchange
BSE
Offer price
1.46 - 1.53
USD
Dec 17
5
544555Park Medi World Limited
Exchange
BSE
Offer price
1.71 - 1.80
USD
Dec 17
K
KVTOYSK V TOYS INDIA LIMITED
Exchange
BSE
Offer price
2.52 - 2.66
USD
Dec 17
5
544520Shipwaves Online Limited
Exchange
BSE
Offer price
0.140
USD
Dec 17
2
2539Nephrocare Health Services Limited
Exchange
BSE
Offer price
4.93 - 5.18
USD
See more events
Community trends
BTCUSD preparing for fallBTCUSD daily RSI could not cross 50 mark and going downwards, while its 4H rSI has started going below daily RSI, it indicates a fall is close.
Expecting a fall below its earlier support and in range of 70-76k
BTC/USD 1 Day Time Frame Live intraday BTC/USD price (1‑day timeframe): ~$90,368 USD (with a high near ~$92,705 and low near ~$89,560 today) — updated in real‑time.
Real‑time exchange aggregator sites also show similar live ranges:
• BTC ranges roughly $89,500 – $92,700 (24h low/high) on major exchanges.
• Live price data

XAUUSD GOLD Analysis on Weekly#XAUUSD UPDATEDE
Current price - 4299
Buy Limited - 4280-4270
If price stay above 4252 then next target ,4330,4350 and 4380 and below that 4220
Plan;If price break 4280-4270 area,and stay above 4280,we will place buy order in gold with target of 4330,4350 and 4380 & stop loss should be placed at

itcoin (BTC/USD) Daily Chart: Downtrend Pressure with Early Stab
Trend: BTC is still trading below a clear descending trendline, confirming a broader bearish structure since the mid-year highs. Lower highs and lower lows remain intact.
Price Action: Current price is around $90,160, consolidating after a sharp sell-off in November. This looks like a pause or ba

$BTC: Technical Breakdown (High-Probability Bearish Setup)CRYPTOCAP:BTC : Technical Breakdown (High-Probability Bearish Setup)
Market Structure Shift
Bitcoin has Already lost $107000 major bullish support and is sustaining below it, confirming a bearish market phase.
The Head & Shoulders distribution pattern is fully validated.
Head & Shoulders Measureme

BITCOIN 1H TIME FRAME In btc , there's is a breakdown. It looks good to short on pullback. What is your view?

BTC Bullish or Bearish
1 Hour Scenario:
Price is consolidating inside a symmetrical triangle (yellow trendlines). BTC is sitting near $89,300, just above the lower ascending support. EMA 100 (~$90,500) is acting as resistance. Volume is dropping, indicating a potential breakdown soon.
1 Day scenario:
BTC is struggling

XRP/USD in weekly time frameXRP/USD is in Correction phase in weekly time frame. Lot of liquidity needs to be hunted, before the next impulse. Once liquidity hunting done, strong impulse with an mentioned target in the chart is expected.

Doge monthlyDoge monthly looks like it's in trouble, and there are no meme buyers, are we going to see 0.0007

Bitcoin - Elliott Wave Analysis - weekly TFHallo crypto traders bitcoin completed Expanding leading diagonal pattern in grand super cycle degree now in correction phase so wait for long fib ret 61.8% level then big move starts (wave 3)

See all crypto ideas
XAUUSD H4 Medium Term Rising Channel and Key Liquidity ZonesXAUUSD H4 – Medium-Term Rising Channel and Key Liquidity Zones
Gold reacted sharply after touching the trendline, with the primary focus next week on buying pullbacks in line with the dominant trend
PRIORITY SCENARIO – MAIN STRATEGY
Trend-following buy strategy on a corrective move into key suppo

Elliott Wave Analysis XAUUSD – Week 3 of December 2025
1. Momentum
Weekly (W1):
Weekly momentum is approaching the overbought zone. There is a high probability that in the coming week, W1 momentum will enter the overbought area and start showing signs of a bearish reversal.
Daily (D1):
D1 momentum is currently in the overbought zone and preparing

XAUUSD Wave 5 Completed, Entering an ABC Correction CycleXAUUSD – Wave 5 Completed, Entering an ABC Correction Cycle
Weekly Plan Summary
Gold has completed Wave 5 with a very strong impulsive move and is now entering an ABC corrective phase to complete the Elliott Wave structure.
For the coming week, the primary strategy is to look for SELL opportunities

XAUUSD H4 Lana Weekly AnalysisXAUUSD (H4) – Lana’s Weekly Outlook: Waiting for pullbacks to Fib 0.618 & 0.50 within major liquidity zones 💛
Higher-Timeframe Trend (D1)
Gold is revisiting the previous all-time high (ATH), but volume strength has not yet been convincing enough to confirm a strong breakout.
Primary Tracking Timef

Crude buy neae 5150 sell near 5425 both work done desc is hereParameter Data Data
Asset Name Crude Oil WTI Futures (MCX)
Price Movement 🟥 Minor Bearish/Rangebound (₹5,179 / -1.2% from Prev. Close)
Current Trade 🟨 WAIT/RANGE TRADE (Sell near R1, Buy near S1)
SMC Structure 🟨 Neutral/Consolidation (Price compressing within a tight range)
Trap/Liquidity Zones 🟥 Su

Gold Strengthening as Bullish Structure FormsOANDA:XAUUSD is beginning to present a noticeably stronger bullish tone as the underlying price structure shifts upward.
The most recent market interaction is particularly noteworthy as an early recovery phase has emerged, bearish momentum has weakened, and a series of low-volume candles highligh

Chumtrades XAUUSD Trading PlanMarket Context
During Friday’s session, after the previous range breakout, the market saw strong profit-taking pressure from buyers.
Large capital exits triggered a sharp sell-off of ~96 prices, while the 426X base zone supported price very well.
Overall structure remains bullish.
👉 Session Expecta

Gold Trading Strategy for 15th December 2025Gold Trading Plan – Intraday & Scalping
🟡 GOLD (XAU/USD) – Intraday Trading Plan 💰
📈 BUY SETUP (Bullish Scenario)
🟢 Condition:
Buy above the HIGH of the 1‑Hour candle
Candle must CLOSE above 4326
🎯 Targets:
Target 1: 4338 💵
Target 2: 4349 💵
Target 3: 4360 💵
🛑 Stop Loss (Suggested):
Below the 1‑Hour

Gold Analysis & Trading Strategy | Next Week Outlook✅ Daily Chart (D1) Trend Analysis
Overall Structure:
Gold remains in a high-level consolidation within an uptrend. Daily lows continue to rise, and the medium-term bullish structure remains intact. After a series of strong advances, increased volume and long upper shadows have appeared at higher lev

Weekly Forecast: XAUUSD May Continue Upward Towards 4,500XAU/USD is showing positive signs, with the price potentially rising from around 4,295. The market could experience a temporary pullback to 4,180, but if the upward trend remains intact, the price might continue rising towards 4,500.
The current market movement suggests a bullish outlook, with cons

See all futures ideas
AUD/CAD Bullish in Daily time frameTechnically : AUD/CAD is technically ready for bullish move. As the wave 1( impulse) followed by wave 2 (Correction), Wave 3 (impulse), followed by wave 4(Correction). Wave 5 Start will be determined by Fundamental connection.
Fundamental Data : CAD CPI will be published tomorrow. Based on the re

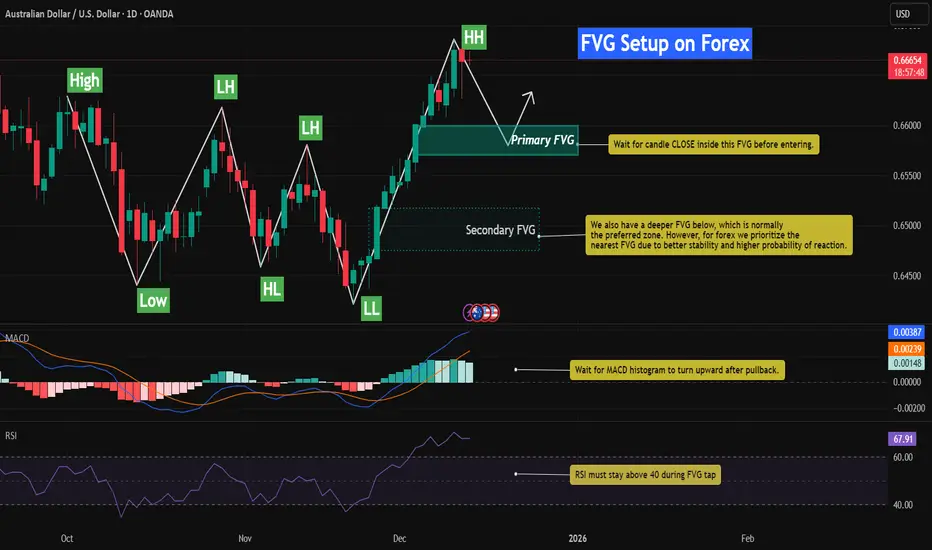
Bullish FVG Retracement With RSI & MACD📈 AUDUSD – Bullish FVG Retracement With RSI & MACD Momentum Confluence
This chart highlights a well-defined bullish structure on AUDUSD, characterized by a sequence of Higher Lows (HL) followed by a clean Higher High (HH). The latest impulsive leg upward created multiple Fair Value Gaps (FVGs), ea
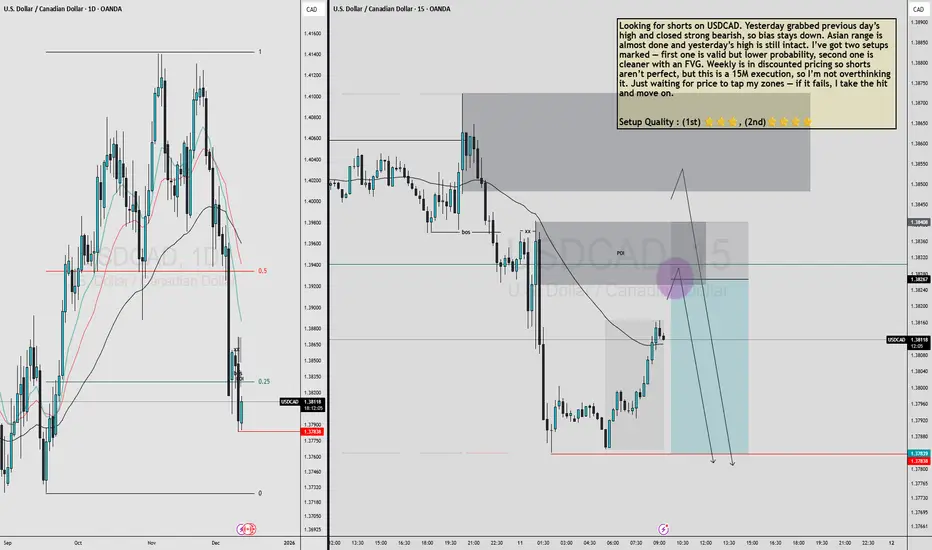
USDCAD MULTI TIMEFRAME ANALYSIS Looking for shorts on USDCAD. Yesterday grabbed previous day’s high and closed strong bearish, so bias stays down. Asian range is almost done and yesterday’s high is still intact. I’ve got two setups marked — first one is valid but lower probability, second one is cleaner with an FVG. Weekly is in d
USDJPY LONGprice came to retest the daily demand area and gave a ltf confirmation on 15.
study the reaction at marked levels

NZDUSD Short | 15m | Structural Breakdown After ExhaustionNZDUSD showed a clear loss of momentum after an extended upside leg. Price consolidated near the highs with diminishing impulsiveness, forming a distribution-style structure. The break back below the micro-range support confirmed weakness.
The short entry is based on:
• Rejection from the intraday

Eur cad trade A good resistance in EurCad if this resistance break and up move continue the good trade we will capture focus on level and patiencly wait for level breakthrough

usdjpy shortA major currency pair in forex that shows how many Japanese yen are needed to buy one US dollar. Traders watch it for interest-rate differences, risk sentiment, and Bank of Japan vs. Federal Reserve policy. It’s known for strong trends and volatility, especially around economic data release

USDINR Wave 5 Update | Elliott Wave Analysis | 8 Dec 2025🧠 Wave Structure
USDINR is currently progressing inside a clean Elliott Wave 5 advance.
Price remains strongly supported inside a rising parallel channel and continues respecting the trend structure.
Wave progression so far:
Wave 1 – Completed near ₹88.80
Wave 2 – Corrective low near ₹87.60
Wave 3

EURUSD_Analysis_15m_8_Dec15m swing is bullish
15m Internal is Bearish (But may be taken its Pullback)
If Internal high is in control -- then we may see sell opportunity
If swing Low is in control -- then we may buy opportunity

NZDUSDAs you can see, price made a strong impulse to the upside, leaving an inefficient leg behind and creating a clean demand zone below, which also includes the 0.56000 candle.
I’m expecting a pullback lower into that area before looking for potential buys.
Let’s see how price develops.

See all forex ideas
| - | - | - | - | - | - | - | - | ||
| - | - | - | - | - | - | - | - | ||
| - | - | - | - | - | - | - | - | ||
| - | - | - | - | - | - | - | - | ||
| - | - | - | - | - | - | - | - | ||
| - | - | - | - | - | - | - | - | ||
| - | - | - | - | - | - | - | - | ||
| - | - | - | - | - | - | - | - | ||
| - | - | - | - | - | - | - | - |
Trade directly on Supercharts through our supported, fully-verified, and user-reviewed brokers.


