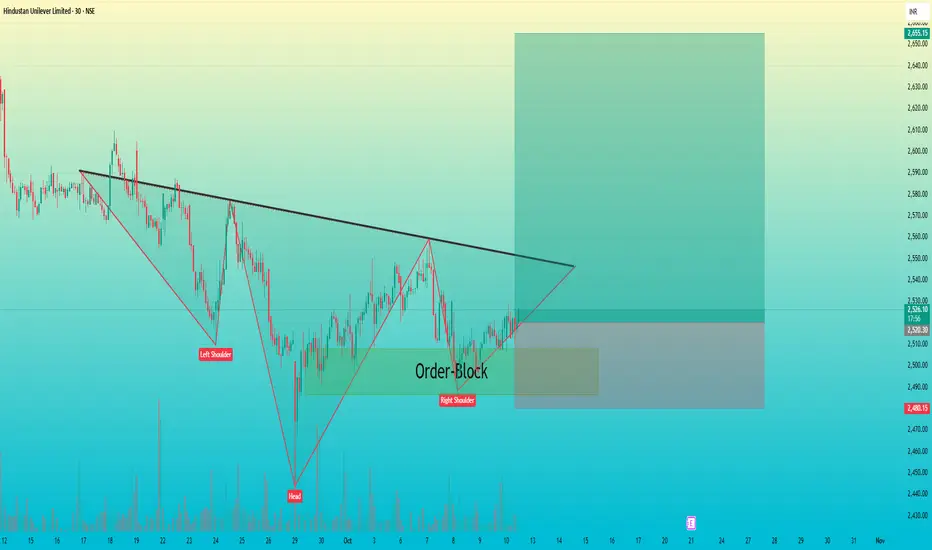
HINDUNILVR : Inverse Head & Shoulders + Order-Block setup Technical Analysis: Hindustan Unilever Ltd
Timeframe: 30-Minute
Pattern: Inverse Head & Shoulders with Order Block Confluence
Pattern Insight
The market has created a clear inverse head and shoulders structure —
showing potential trend reversal from a short-term downtrend to an uptrend.
The

The best trades require research, then commitment.
Get started for free$0 forever, no credit card needed

Scott "Kidd" PoteetThe unlikely astronaut

Where the world does markets
Join 100 million traders and investors taking the future into their own hands.
Major indices
USDCHF - TREND REVERSAL CONFIRMEDSymbol - USDCHF
USDCHF is confirming a reversal of its prior downtrend and appears poised to transition into a distribution phase, supported by strength in the US Dollar Index.
The dollar is currently breaking through resistance and may continue its bullish correction within the broader long-term d

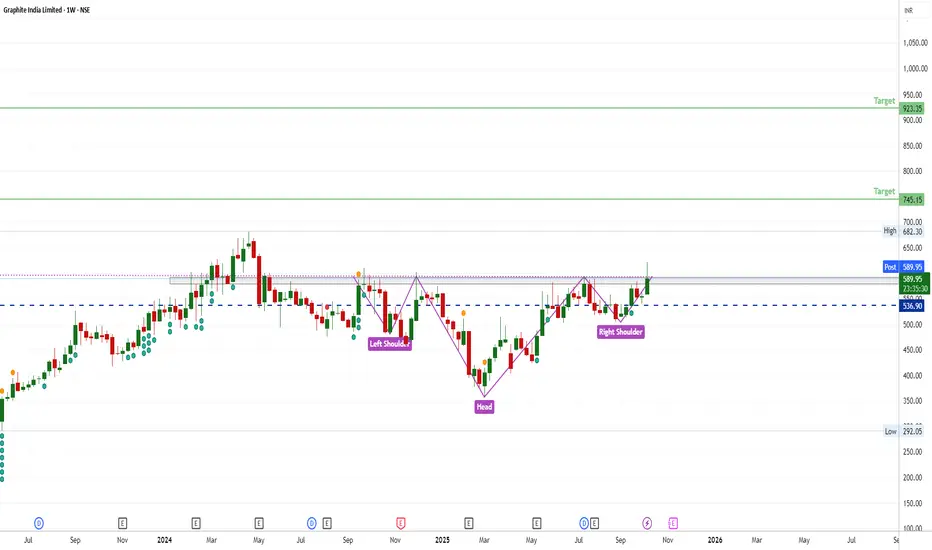
Long time Breakout Head and Shoulder🧩 Pattern Overview
Left Shoulder: Formed when price fell from around ₹620 to ₹500, then bounced back.
Head: A deeper decline down to around ₹420 before recovering — marking the lowest point of the pattern.
Right Shoulder: A smaller dip to around ₹500 before price rose again.
Neckline: The resist
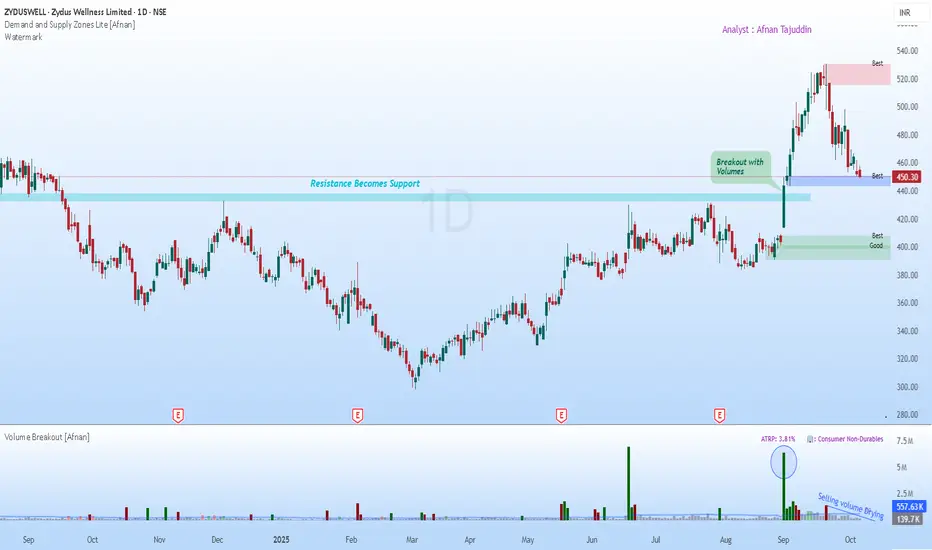
Powerful Setup & Art of the Pullback: Supply & Demand Concept📊 Supply & Demand View 📊
When you look closely, supply and demand zones are essentially the fingerprints of institutional activity. Big players rarely dump or buy entire positions in one shot—they stagger their trades, leaving behind identifiable imbalances on the charts. Every time price revisits
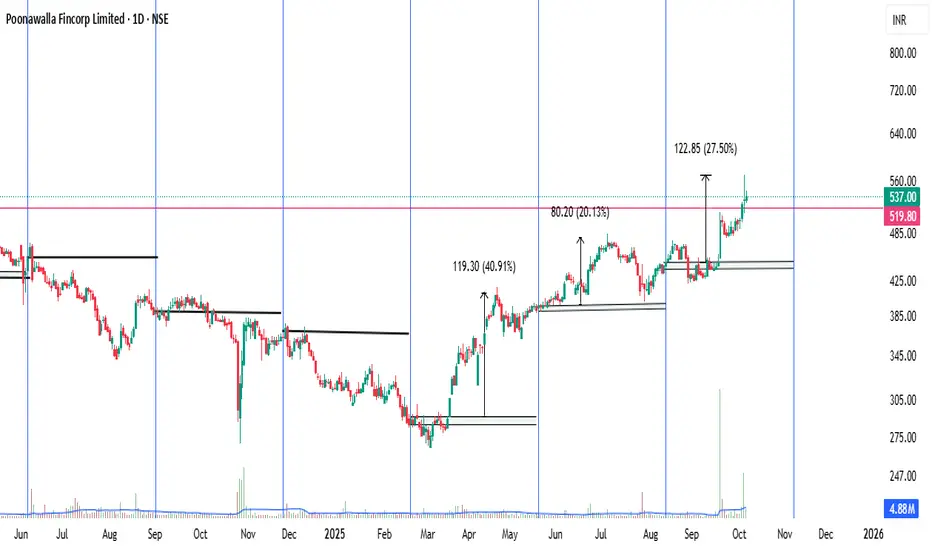
Poonawalla Fincorp (POONAWALLA)Poonawalla Fincorp Limited (NSE: POONAWALLA), a non-banking financial company (NBFC) under the Cyrus Poonawalla Group, focuses on consumer and MSME lending, including personal loans, vehicle finance, and supply chain financing. As of October 7, 2025, the stock trades around ₹565, up ~8% in the last
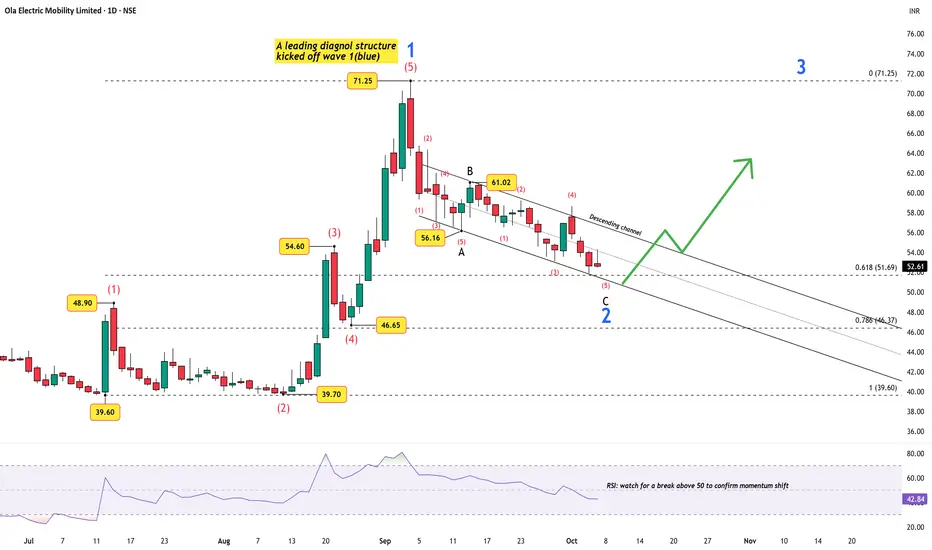
Charging Up for Wave 3 — Ola’s Motor Just Got Certified!The electric vehicle (EV) space in India is heating up again — and Ola Electric seems to be quietly positioning itself for the next leg of growth. The company’s recent government certification for its in-house ferrite motor marks an important milestone: a domestically designed motor that avoids co
ETHUSD: Where Price Could Go?4h tf
ETHUSD has bounced back strongly from around $3,826 after completing an A-B-C wave pattern. Right now, the price is testing resistance near $4,756. It could drop a little to around $4,440 before moving higher again. If the uptrend continues, the next target levels are $4,955, $5,300, and $5,5

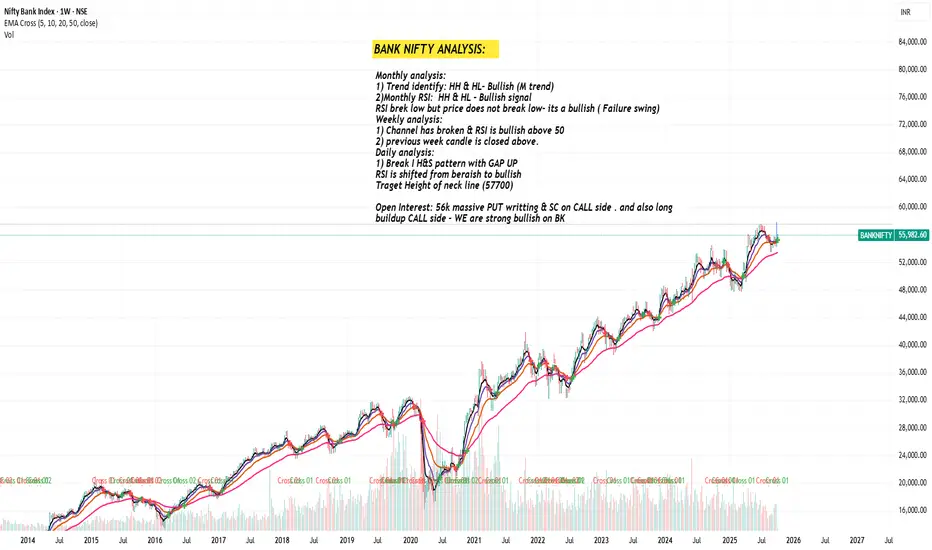
BANK NIFTY ANALYSIS: Strong BullishMonthly analysis:
1) Trend identify: HH & HL- Bullish (M trend)
2)Monthly RSI: HH & HL - Bullish signal
RSI brek low but price does not break low- its a bullish ( Failure swing)
Weekly analysis:
1) Channel has broken & RSI is bullish above 50
2) previous week candle is closed above.
Daily analysi
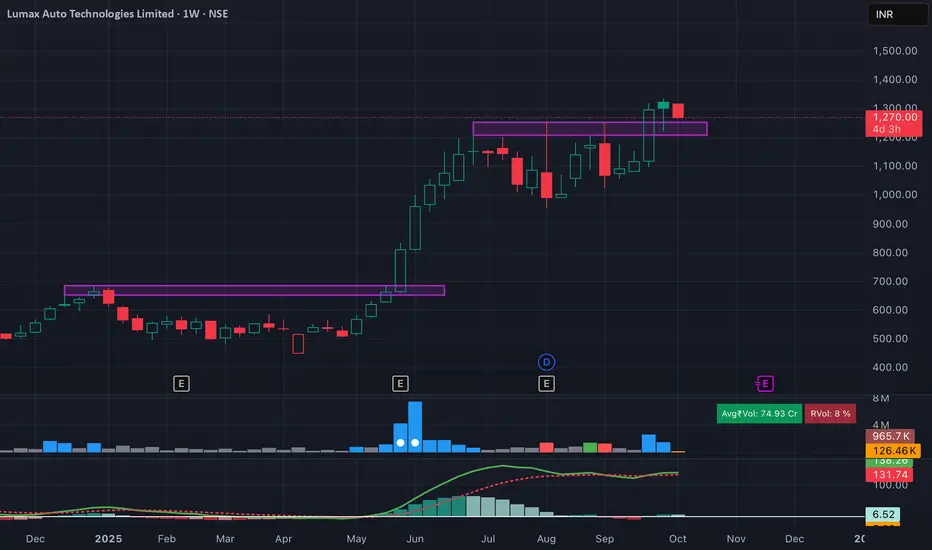
Lumax Auto Technologies – Fresh Breakout & Retest OpportunityLumax Auto Technologies has given a clean breakout above the 1,200–1,230 resistance zone and is now retesting the breakout on the weekly chart. Structure remains strong with higher highs and higher lows — showing continuation of the uptrend.
MACD is stabilizing after a healthy correction, suggesting
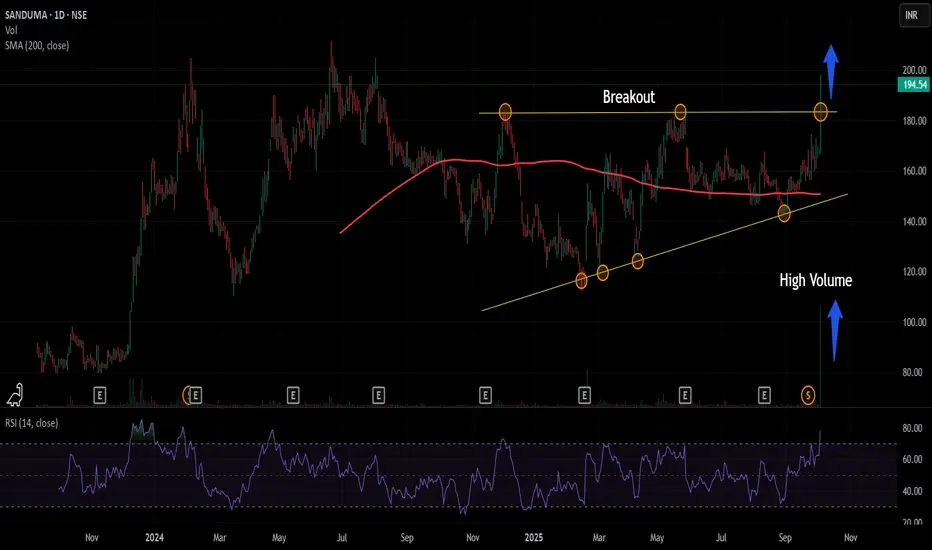
Sandur Manganese & Iron Ores Ltd : Breakout Sandur Manganese & Iron Ores Ltd is in consolidation since last one year. On Friday 3rd of Oct the stock moved up 15% with huge uptick in the volume.
The RSI reading above 70 also suggest there is momentum in the move.
Sector : Metal, outperforming to Nifty 50 benchmark
Looking at the price ch
See all editors' picks ideas
Dynamic Equity Allocation Model"Cash is Trash"? Not Always. Here's Why Science Beats Guesswork.
Every retail trader knows the frustration: you draw support and resistance lines, you spot patterns, you follow market gurus on social media—and still, when the next bear market hits, your portfolio bleeds red. Meanwhile, institution

First Passage Time - Distribution AnalysisThe First Passage Time (FPT) Distribution Analysis indicator is a sophisticated probabilistic tool that answers one of the most critical questions in trading: "How long will it take for price to reach my target, and what are the odds of getting there first?"
Unlike traditional technical indicators

PongExperience PONG! The classic arcade game, now on your charts!
With this indicator, you can finally achieve your lifelong dream of beating the Markets. . . at PONG!
Pong is jam-packed with features! Such as:
2 Paddles
A moving dot
Floating numbers
The idea of a net
This indicator is solel

Options Max Pain Calculator [BackQuant]Options Max Pain Calculator
A visualization tool that models option expiry dynamics by calculating "max pain" levels, displaying synthetic open interest curves, gamma exposure profiles, and pin-risk zones to help identify where market makers have the least payout exposure.
What is Max Pain?
Max

Volume Profile 3D (Zeiierman)█ Overview
Volume Profile 3D (Zeiierman) is a next-generation volume profile that renders market participation as a 3D-style profile directly on your chart. Instead of flat histograms, you get a depth-aware profile with parallax, gradient transparency, and bull/bear separation, so you can see w

RiskMetrics█ OVERVIEW
This library is a tool for Pine programmers that provides functions for calculating risk-adjusted performance metrics on periodic price returns. The calculations used by this library's functions closely mirror those the Broker Emulator uses to calculate strategy performance metrics (

Simple Decesion Matrix Classification Algorithm [SS]Hello everyone,
It has been a while since I posted an indicator, so thought I would share this project I did for fun.
This indicator is an attempt to develop a pseudo Random Forest classification decision matrix model for Pinescript.
This is not a full, robust Random Forest model by any stretch o

Tick CVD [Kioseff Trading]Hello!
This script "Tick CVD" employs live tick data to calculate CVD and volume delta! No tick chart required.
Features
Live price ticks are recorded
CVD calculated using live ticks
Delta calculated using live ticks
Tick-based HMA, WMA, EMA, or SMA for CVD and price
Key tick levels (S

analytics_tablesLibrary "analytics_tables"
📝 Description
This library provides the implementation of several performance-related statistics and metrics, presented in the form of tables.
The metrics shown in the afforementioned tables where developed during the past years of my in-depth analalysis of various str

Adaptive Trend Classification: Moving Averages [InvestorUnknown]Adaptive Trend Classification: Moving Averages
Overview
The Adaptive Trend Classification (ATC) Moving Averages indicator is a robust and adaptable investing tool designed to provide dynamic signals based on various types of moving averages and their lengths. This indicator incorporates multipl

See all indicators and strategies
Community trends
HINDUNILVR : Inverse Head & Shoulders + Order-Block setup Technical Analysis: Hindustan Unilever Ltd
Timeframe: 30-Minute
Pattern: Inverse Head & Shoulders with Order Block Confluence
Pattern Insight
The market has created a clear inverse head and shoulders structure —
showing potential trend reversal from a short-term downtrend to an uptrend.
The

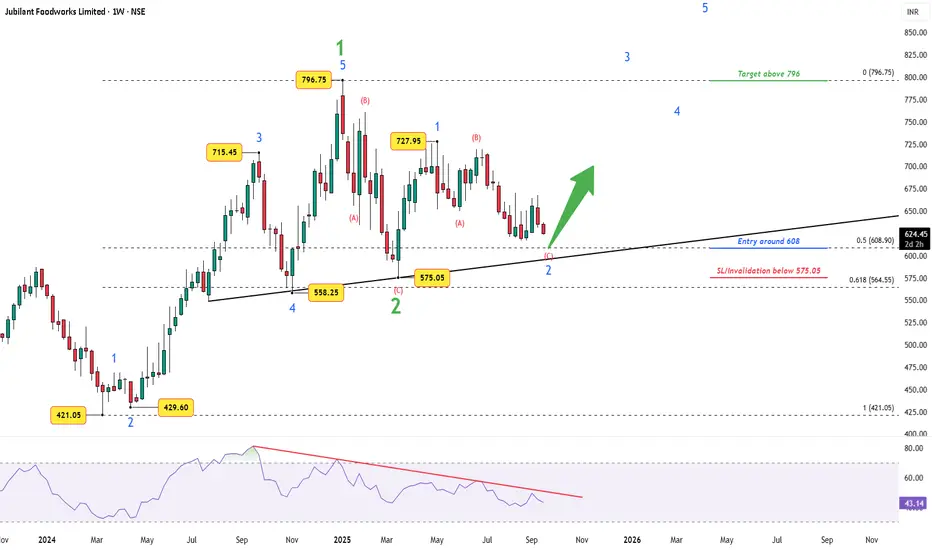
Jubilant Foodworks: Wave 2 Near End?After peaking at ₹796.75, Jubilant Foodworks entered a corrective A–B–C decline, completing Wave 2 near ₹575 — right at the 0.618 retracement of Wave 1. Price has since held above this key support, suggesting the corrective phase may be complete.
The setup is now simple:
Entry Zone: Around ₹608
Don’t Miss This Rare MCX Setup Breakout + Retest= Big Move AheadHello Traders!
Today’s analysis is on MCX Ltd., where we just spotted a powerful Descending Triangle Breakout . After weeks of consolidation, the price has finally broken the falling resistance and even retested the breakout zone. This setup often leads to a strong trending move.
Why this setup i

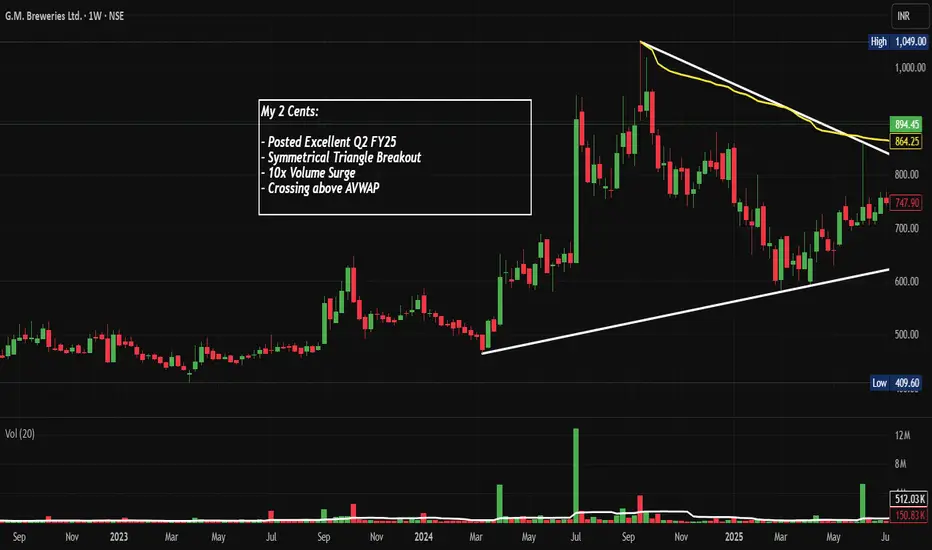
GMBREW: Broke Out Post Q2 FY26 with 10x Vol, Chart of the WeekA Small-Cap Brewery Stock NSE:GMBREW Broke Out With 10x Volume and Posted 61% Profit Growth in Q2 FY26. Let's Analyse in the "Chart of the Week"
As per the Latest SEBI Mandate, this isn't a Trading/Investment RECOMMENDATION nor for Educational Purposes; it is just for Informational purposes only
Long time Breakout Head and Shoulder🧩 Pattern Overview
Left Shoulder: Formed when price fell from around ₹620 to ₹500, then bounced back.
Head: A deeper decline down to around ₹420 before recovering — marking the lowest point of the pattern.
Right Shoulder: A smaller dip to around ₹500 before price rose again.
Neckline: The resist
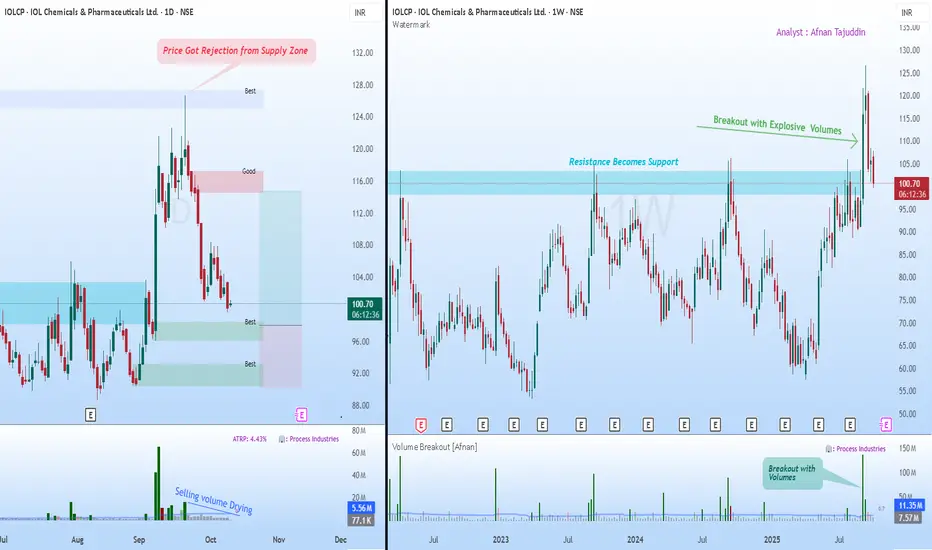
Supply & Demand Setup in IOLCP Could Signal Next Big Move📊 Supply & Demand View 📊
If you’ve been watching IOL Chemicals lately, you’ve probably noticed how cleanly it’s been respecting those key supply and demand structures. These zones aren’t random—they’re the visible fingerprints of institutions building or offloading positions in stages. When price
BSEAfter a good fall now BSE is showing some strength. It has given a breakout of a falling trendline on the daily time frame. One can look to enter here or at dips till 2280.
Stop loss 2180
Target- 2450, 2500, 2550,
Disclaimer- This is just for educational purposes.
Follow for more such learning an

ANGELONE - LONGThe resistance zone at the top marks a level near 4,000 INR where the price has struggled to rise above and often reverses whenever it nears this point. The support zone at the bottom is around 2,000 INR, where the price generally stops falling and tends to bounce back up. This range between support

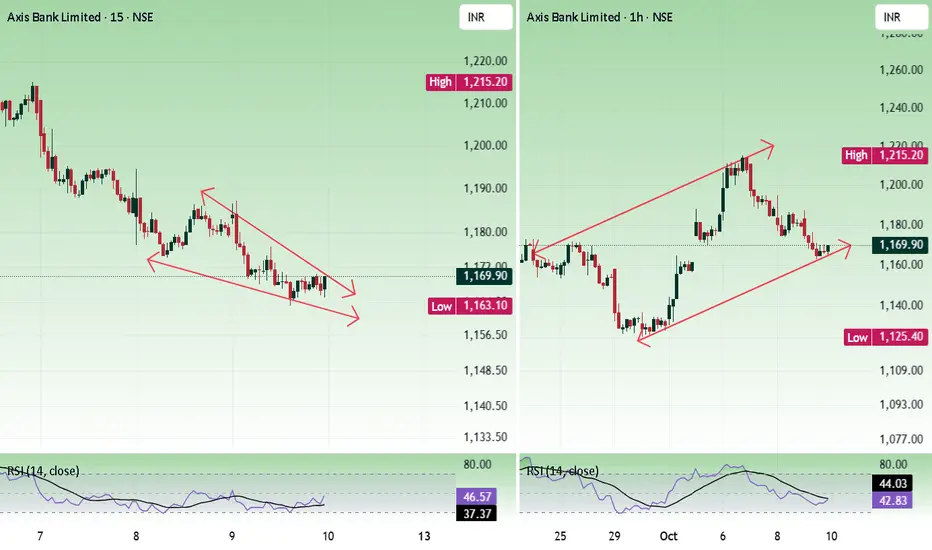
Axis bankPrice faced resistance at the 1200 - 1220 zone and falling. In higher time, the price is moving inside an ascending triangle. In a lower time frame, a falling wedge has formed. Both are bullish patterns. Holding 1160 is important for bulls.
Buying is risky if the price dont have volume strength.
Buy
See all stocks ideas
Today
DMARTAvenue Supermarts Ltd.
Actual
—
Estimate
11.28
INR
Oct 13
HCLTECHHCL Technologies Limited
Actual
—
Estimate
15.66
INR
Oct 13
JTLINDJTL Industries Limited
Actual
—
Estimate
—
Oct 13
AVANTELAvantel Limited
Actual
—
Estimate
—
Oct 13
ANANDRATHIAnand Rathi Wealth Ltd.
Actual
—
Estimate
—
Oct 13
KRSNAAKrsnaa Diagnostics Limited
Actual
—
Estimate
7.20
INR
Oct 14
TECHMTech Mahindra Limited
Actual
—
Estimate
14.35
INR
Oct 14
IREDAIndian Renewable Energy Development Agency Ltd.
Actual
—
Estimate
1.70
INR
See more events
Community trends
LTCUSDT - BULL TRAP IN MAKING?Symbol - LTCUSDT
CMP - 130.00
LTCUSDT is currently forming a distribution pattern following a period of local consolidation. The price is testing the resistance zone and exhibiting signs of a false breakout. However, it is important to note that the broader cryptocurrency market remains in a corre

Bitcoin – Rising Higher, But the Real Battle Is Yet to Begin!Bitcoin continues to trade inside a rising structure , respecting both its long-term support and resistance channels. The trend remains healthy as long as price holds above the 116,000–116,500 support zone , which has been tested multiple times with strong buying reactions.
Currently, BTC is appr

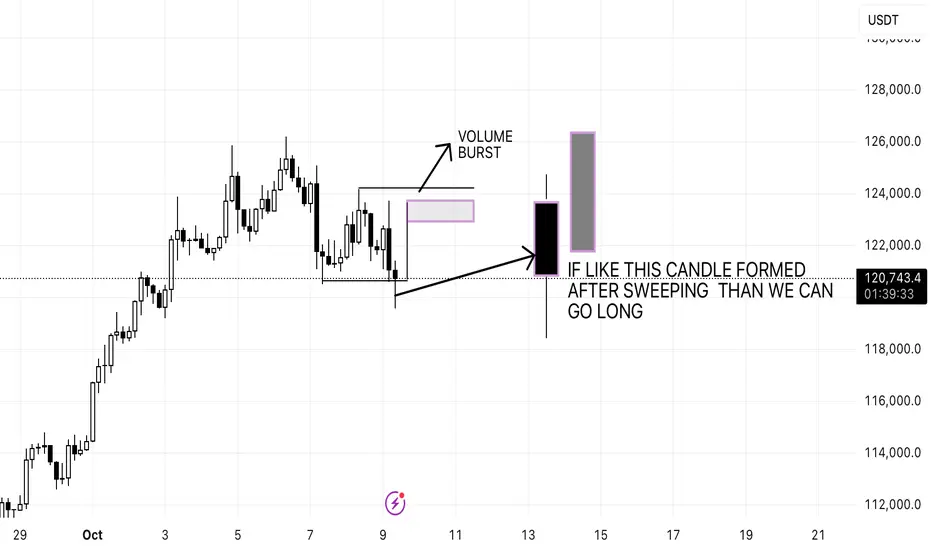
LONG BTC AFTER SWEEPING OR AFTER EFFECTOnce the candle closed above the black line and make a hanging man with a marubuzu candle than we can achieve the marked target or our previous analysis will continue
SOL | Network Strength Meets Market MomentumSolana (SOLUSDT) continues to show resilience as both technical and fundamental factors align for potential upside. On the technical side, the market has completed a controlled correction phase, suggesting liquidity buildup below recent lows. The structure remains bullish, with increasing volume and

BTCUSD and ETHUSD BTCUSD and ETHUSD could not break the hurdle and formed nearly a triple top pattern. Some reversal has been seen. Maybe could fall some more. One should consider co-relating it with the trend of Gold and find entry opportunities in Crypto (just as a hedge in my view).

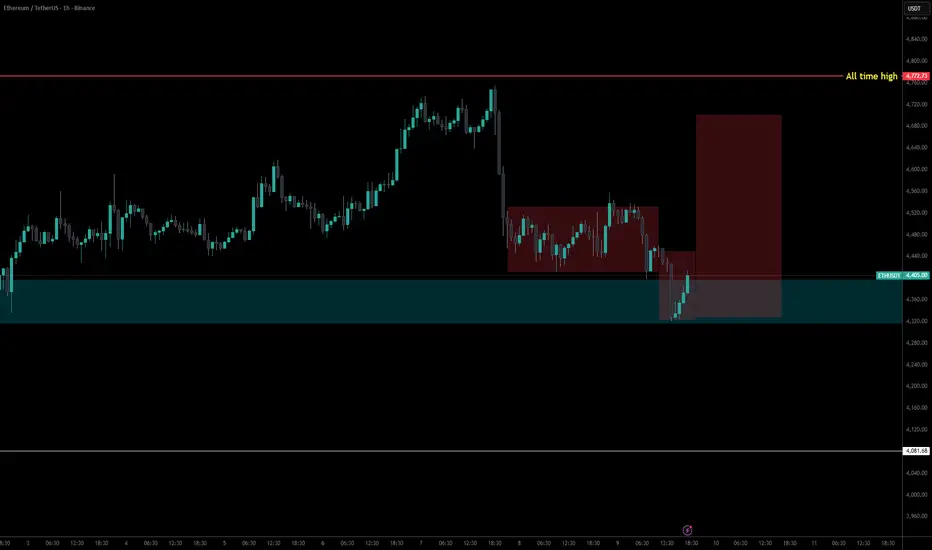
Ethereum 1H - LongEthereum 1H long, looks like an AMD (accumulation manipulation Distribution) set-up to me.
ETHUSD: Reversal Expected Near 4100The bullish outlook remains unchanged. We are expecting the price to reverse near 4100 . The sharp move on wave a, a small correction for wave b, indicates a sharp decline and rapid rise in the upcoming days.
Previous research:
Stay Tuned!
@money_dictators
Thanks :)

[SeoVereign] BITCOIN BEARISH Outlook – October 05, 2025Hello everyone.
I hope you are all having a peaceful day.
Today, I am writing to share my Bitcoin short position view as of October 5th.
The first basis is the 1.902 CRAB pattern. In a traditional Crab pattern, the 1.618 extension of the XA leg is regarded as the main PRZ (Potential Reversal Zone)

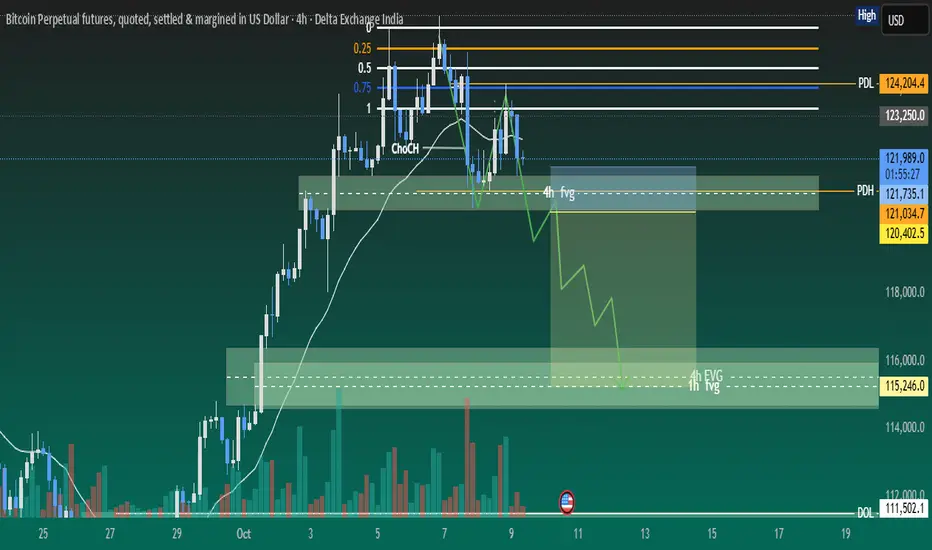
BTC is developing ~4R down side tradeBTC has done MSS on 4h time frame and showing rejection at 4H FVG after displacement. We can see a good downside trade once below FVG is mitigated and changed to iFVG. We need to wait for price getting into right zones.
1. Currently price is moving inside 4H FVG after displacement and showing rejec
BTC SELLBTC SELL ,
I was already watching price action for a selling. Now that I've found a pattern, I'll trade from here like this

See all crypto ideas
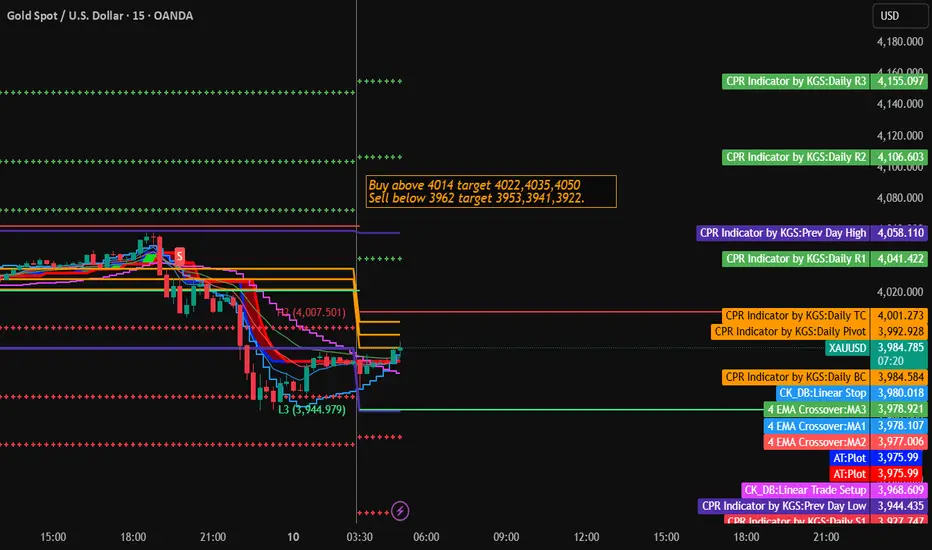
Gold Trading Strategy for 10th October 2025💰 GOLD (XAU/USD) Trading Setup
⏰ Timeframe: 1 Hour & 15 Minutes
🟢 Buy Setup
💹 Entry: Buy above the high of the 1-hour candle — once it closes above $4014
🎯 Targets:
🎯 Target 1: $4022
🎯 Target 2: $4035
🎯 Target 3: $4050
🛡️ Stop Loss: Below $4005 (adjust with risk tolerance)
📈 Trade Logic:
If the ho
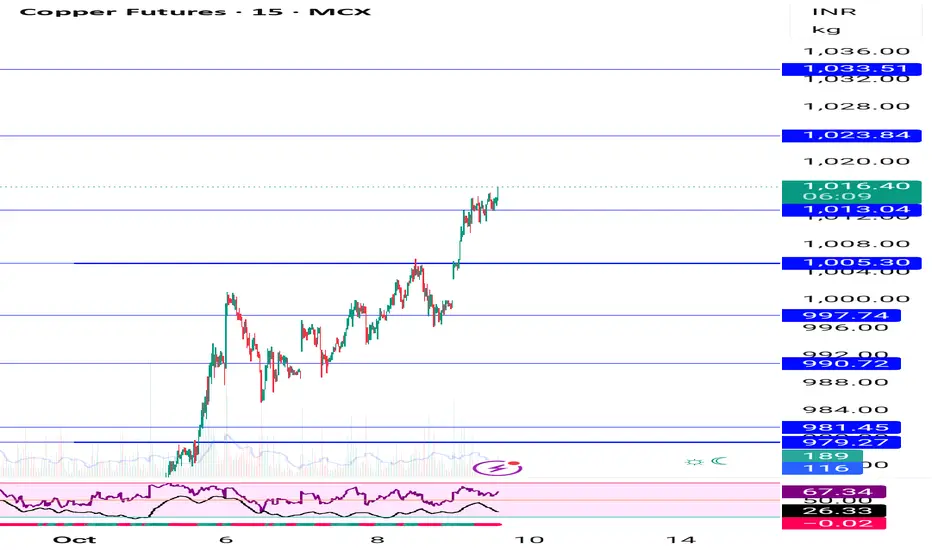
Copper holding buy trade from 999 upside levels on chart Copper holding buy trade from 999 before market closing, earlier yesterday book 10 points profit also
Updated levels given on chart
How My Harmonic pattern projection Indicator work is explained below :
Recent High or Low :
D-0% is our recent low or high
Profit booking zone ( Early / Risky
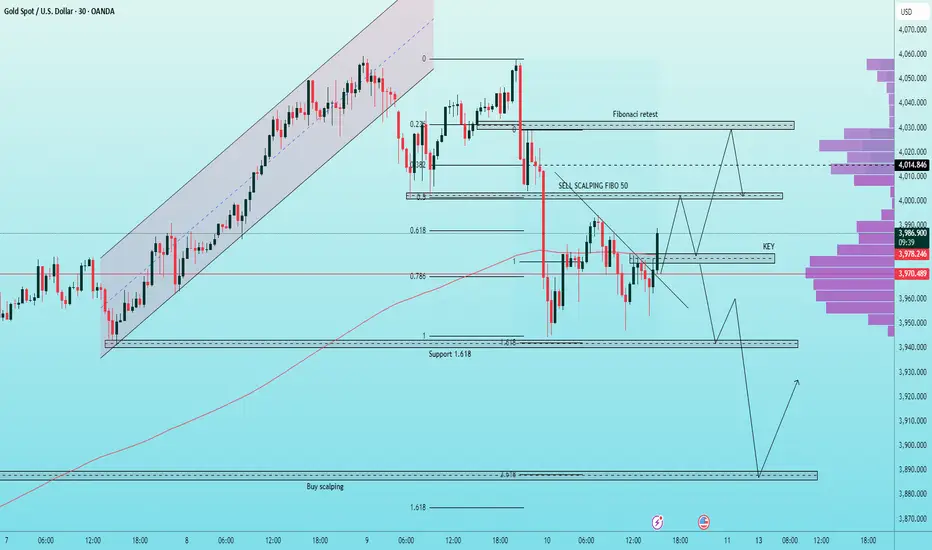
GOLD: ACCUMULATION POST SELL-OFF,Weekend Short-term Trading PLANGOLD: ACCUMULATION POST SELL-OFF, Weekend Short-term Trading Plan
Hello traders 👋
The Gold market witnessed a strong and clear Sell-off yesterday, especially with the decisive break of the $4000 zone – a confirmation area for a new corrective trend, or at least a long-term downtrend cycle.
Current
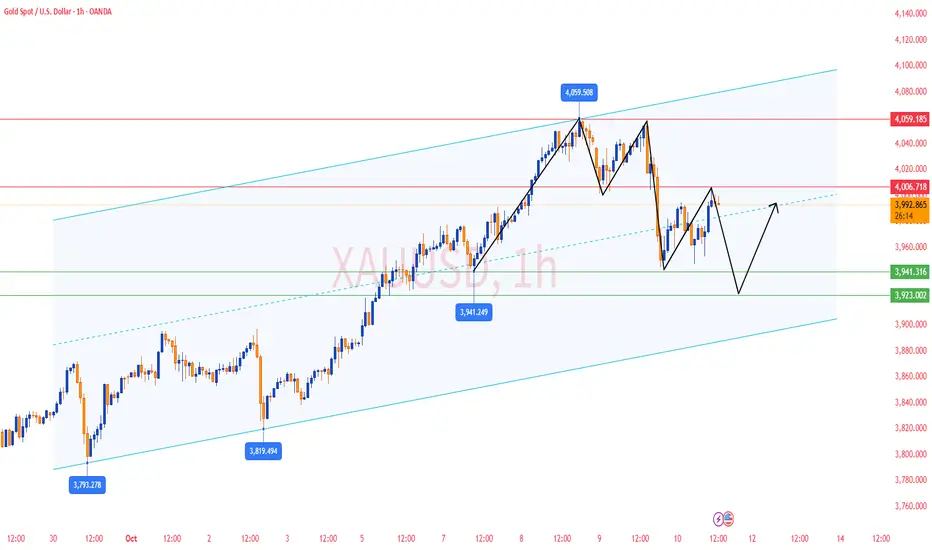
GOLD (XAUUSD) 1H CHART ANALYSIS – BEARISH SETUP AHEADGOLD (XAUUSD) 1H CHART ANALYSIS – BEARISH SETUP AHEAD
🔍 Technical Overview
Current Price: Around $4,036 – $4,040
Trendline: A key uptrend line (blue) has been broken, signaling weakening bullish momentum.
Resistance Zone: Between $4,058 – $4,062, marked by red arrows 🚫
Support Zone: Near $3,93

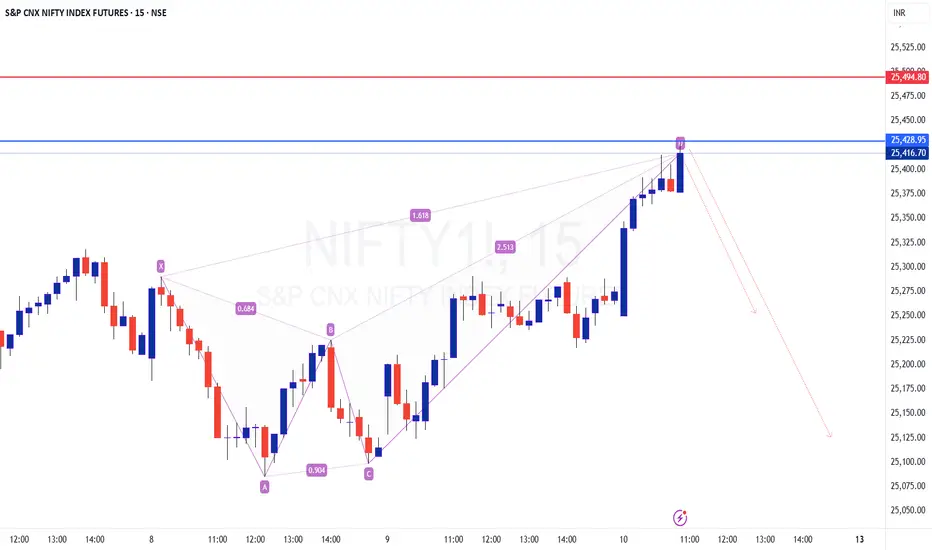
Nifty Future - Harmonic CRAB at the PRZ
TF: 15 minutes
CMP: 25420
The Harmonic Crab pattern is in play and is now at the resistance/PRZ zone of 25400-420
Please be informed that, more often than not, price action at the PRZ is frequently extended beyond the 1.618 fib level (since this pattern itself is known as Extension pattern).
Fir
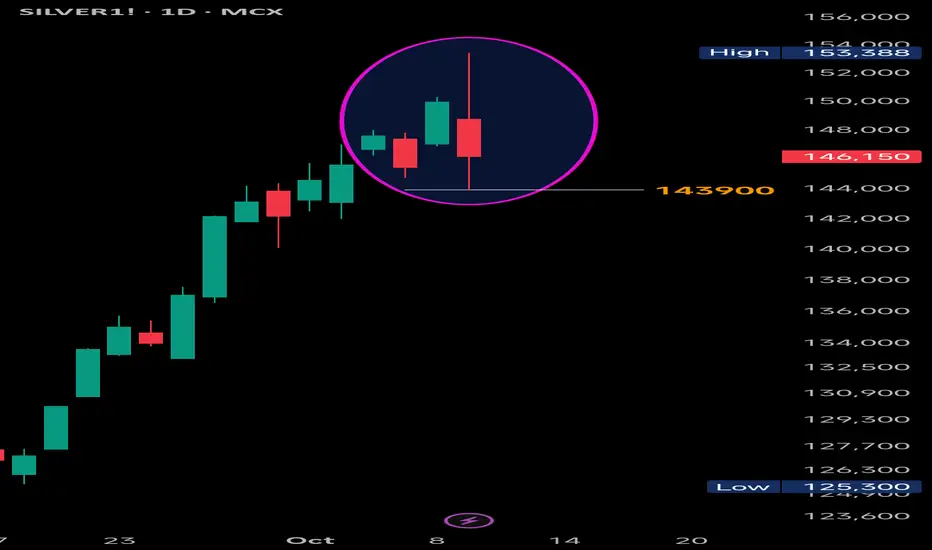
Silver Reversed from 1,50,000Silver reversed from the psychological hurdle of 1,50,000 level as expected and posted on 6th Oct,2025.

Silver: Bearish Engulfing – Is the Top In?#Silver View:
Just like Gold, Silver has formed a strong Bearish Engulfing pattern on the daily chart, potentially signaling a temporary top in the current trend. While it’s still early to confirm a full reversal, the price action suggests caution for bulls.
✅ Confirmation:
A daily close b
Elliott Wave Analysis – XAUUSD (10/10/2025)
________________________________________
🔹 1. Momentum
In the October 9th plan, based on H1 momentum and wave structure, I anticipated a strong bearish move, which indeed occurred during yesterday’s late session.
D1 Momentum:
Currently turning downward, meaning the main trend in the coming sessions

Gold Analysis and Trading Strategy | October 10✅ 4-Hour Chart Analysis
Gold is currently hovering around the MA5 and MA10 (near 3990), with short-term direction still undecided. The MA20 (around 4004) has shifted from support to resistance, indicating that short-term bullish strength is limited.
The Bollinger Bands are narrowing, showing reduce
XAUUSD GOLD BULLISH NOW 4028📈 XAU/USD (Gold) Trade Alert ✨
Gold (XAU/USD) is showing strong bullish momentum, presenting an excellent buy opportunity at the entry point of 4028. The support level at 4001 provides a solid foundation for this upward move, indicating potential strength in price action. Our target point is set at

See all futures ideas
USDCHF - TREND REVERSAL CONFIRMEDSymbol - USDCHF
USDCHF is confirming a reversal of its prior downtrend and appears poised to transition into a distribution phase, supported by strength in the US Dollar Index.
The dollar is currently breaking through resistance and may continue its bullish correction within the broader long-term d
GBPJPY SELL TRADE ANALYSIS📊 TRADE SNAPSHOT (GBPJPY 15M)
Pair: GBPJPY
Position: SELL
Entry Price: 203.274
Current Price: 202.474
Stop Loss (Trailing): 203.474 → trailing 20 pips behind price
Take Profit Target (Projected): around 202.374 / 202.300 zone (London Low)
💰 PIP CALCULATION
203.274 − 202.474 = 0.800
👉 That’s

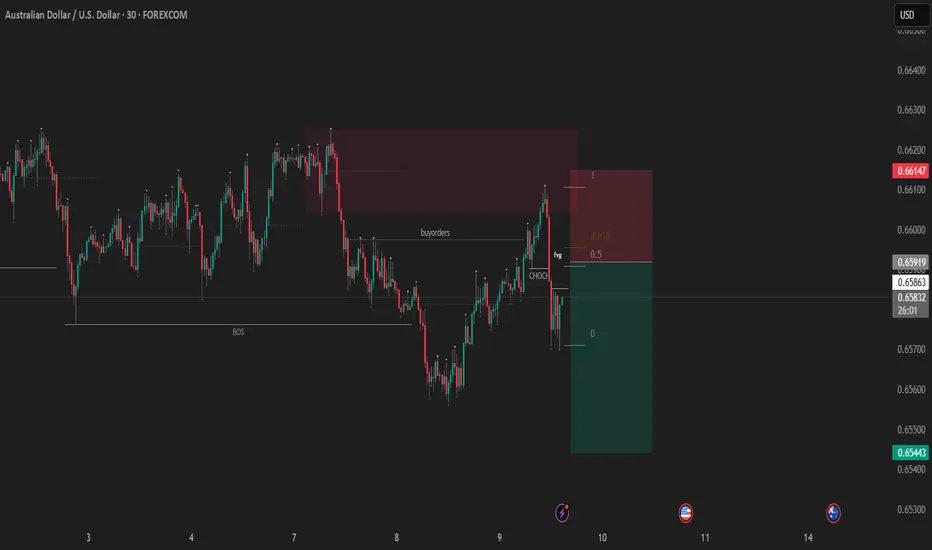
look for a short in AUDUSD, after price gave a structure shift price retraced to premium of recent break of structure(downside), from there price cleared out some buyside liquidity and gave a structure shift in lowertime frames therefore i placed a pending short limit order, at the premium of new lower time frame structure.
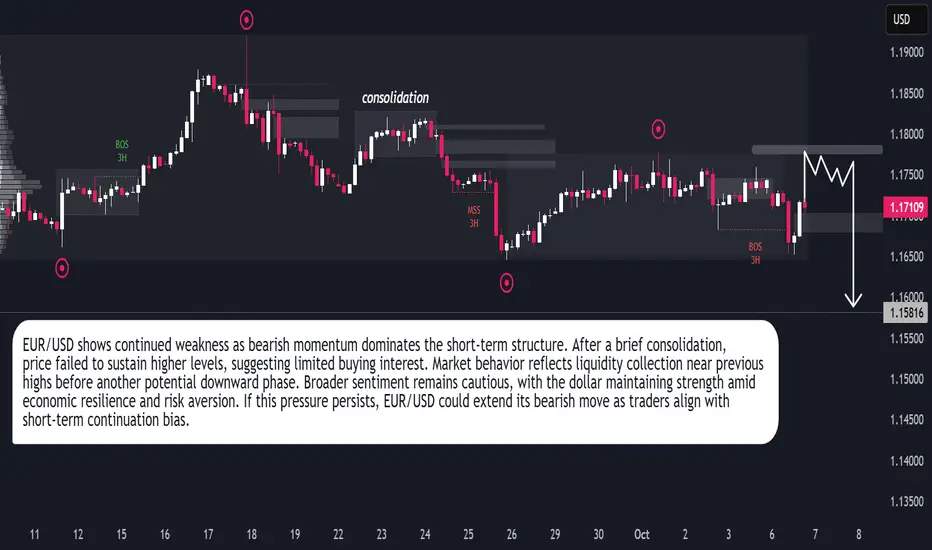
EUR/USD – Bearish Continuation in MotionEUR/USD continues to display a bearish market structure, reflecting persistent downside pressure as the euro struggles to maintain stability against the U.S. dollar. Recent price action shows a period of consolidation followed by a liquidity grab near short-term highs, indicating that buyers are los
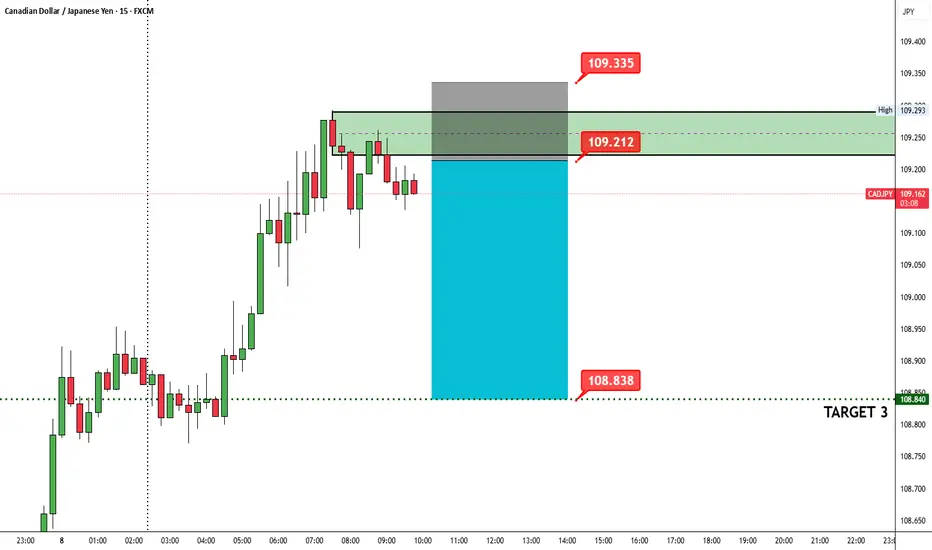
CADJPY | Intraday Short Setup – Smart Money Play in ActionAfter a strong bullish impulse, CADJPY has entered a critical supply zone where price previously showed signs of exhaustion. On the 15-minute chart, the pair formed a clear liquidity grab above the previous highs and then started showing rejection candles — an early sign of potential bearish momentu
Buy Trade - USD/CHFGreetings to everyone!
You can place a buy trade on USD/CHF and check out my chart for the ideal entry, stop-loss & target placement.
Remember :-
* Move your SL to breakeven once the trade reaches 1:1 R.
* Aim for a minimum reward of 1:1.5 R.
* Don't risk more than 3% of your total margin.

USDCAD MULTI TIME FRAME ANALYSISHello traders , here is the full multi time frame analysis for this pair, let me know in the comment section below if you have any questions , the entry will be taken only if all rules of the strategies will be satisfied. wait for more price action to develop before taking any position. I suggest yo

CHF/JPY Builds Momentum for Next Wave HigherThe CHF/JPY 1-hour chart shows a completed wave (1) near the 191.17 level, confirming a strong bullish impulse after a previous decline. The pair is now entering a wave (2) corrective phase, which is likely to retrace toward the 188.7–189.0 support zone before resuming the next upward move. This

AUDUSD 15M IDEAFOREXCOM:AUDUSD
Hello traders , here is the full multi time frame analysis for this pair, let me know in the comment section below if you have any questions, the entry will be taken only if all rules of the strategies will be satisfied. wait for more Smart Money to develop before taking any po

See all forex ideas
| - | - | - | - | - | - | - | - | ||
| - | - | - | - | - | - | - | - | ||
| - | - | - | - | - | - | - | - | ||
| - | - | - | - | - | - | - | - | ||
| - | - | - | - | - | - | - | - | ||
| - | - | - | - | - | - | - | - | ||
| - | - | - | - | - | - | - | - | ||
| - | - | - | - | - | - | - | - | ||
| - | - | - | - | - | - | - | - |
Trade directly on the supercharts through our supported, fully-verified and user-reviewed brokers.


