State Bank Weekly Price Action Analysis for Jan 2026Analysis date: 20-Dec-2025
State Bank closed at 980 levels but the volume is pretty low. This is not a good sign of bullishness. Chances are, sellers could be waiting for price to come in 990 range. They may take the price down to 970 levels as shown on the charts.
Bulls trade with caution.
Bullish
Your 2025 space mission is here
Suit up and get ready to explore every highlight of your trading galaxy.


#JKTYRE - Cup & Handle / IHNS BO in DTFScript: JKTYRE
Key highlights: 💡⚡
📈 Cup & Handle / IHNS BO in DTF
📈 Volume spike seen during Breakout
📈 MACD Bounce
📈 RS Line making 52WH
✅Boost and follow to never miss a new idea! ✅
⚠️ Important: Always Exit the trade before any Event.
⚠️ Important: Always maintain your Risk:Reward Ratio as 1

EURUSD-Short-15MThe trade was initiated based on a high-probability setup identified through a confluence of technical factors.
Higher Timeframe (HTF) Analysis: Price action on a higher timeframe (15 MIn) demonstrated a perfect retracement into a previously identified order block (OB). This order block represente

HEROMOTOCO - Rejection From Strong Resistance, Momentum Cooling💹 Hero MotoCorp Ltd (NSE: HEROMOTOCO)
Sector: Automobiles | CMP: 5817
View: Bearish — Rejection From Strong Resistance, Momentum Cooling
HEROMOTOCO has recently faced a sharp rejection from its upper resistance zone near the 6100–6200 region after a strong prior rally, indicating supply emergence

BANKNIFTY at a Make-or-Break ZoneNIFTYBANK is currently trading at a critical confluence zone where a downward-sloping resistance trendline is meeting a well-defined rising support area on the 1-hour timeframe. This price compression indicates indecision and typically precedes a sharp directional move. The index has repeatedly resp

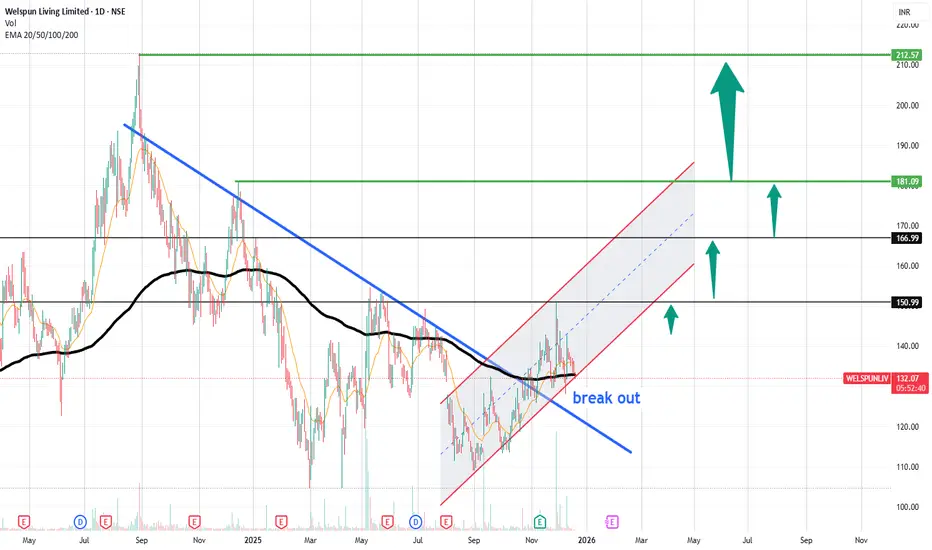
WELSPUNLIV | Trend Reversal with Strong VolumeWelspun Living Ltd. (NSE: WELSPUNLIV) is showing signs of a significant trend reversal as it breaks out of a downward channel, supported by a surge in volume. After multiple attempts to move higher, the price action has finally broken above the crucial resistance at ₹132.90, signaling the potential
Nifty 50 Analysis for Short and Long TermIn the video, few points that are discussed are :
Nifty 50 is sustaining on long term chart.
Nifty 50 is sideways to bearish on short term chart.
Check the past chart and control your emotions in short term up and down moves.

CEAT LTD: Demand Is Quietly Winning This BattleThis chart tells a very classic supply–demand story where emotions and patience are clearly separated. On the surface, recent price action may look weak or confusing, but when you zoom out and read it through the lens of demand–supply and price action, the bigger picture becomes very clear.
🔥 High

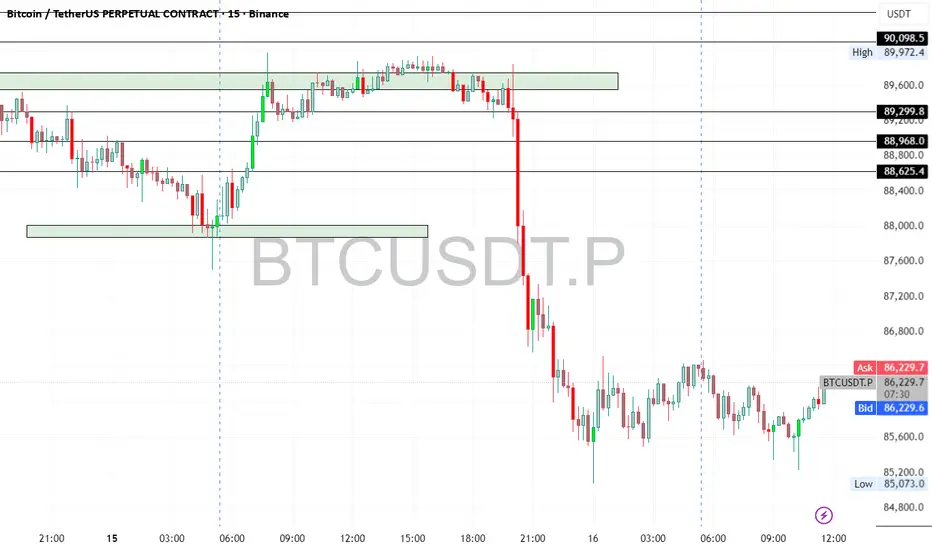
Bitcoin UpdateBTC is down ~2% today but has recovered from the lows and is holding above key support at $86,180 — showing strong respect for the trendline.
Key Levels:
🟢 Support: $86,180 → if this breaks, next major support is $75,000
🔵 Resistance: ~$92,000
🟩 Major Resistance: ~$100,000
Positioning:
I remain lo
RR Kabel Ltd | Volume Area High Breakout Setup RR Kabel is currently trading above the Volume Area High, indicating strong acceptance at higher levels. Price is hovering near a key resistance zone and showing signs of a potential breakout with volume expansion.
Technical View:
Acceptance above VAH → bullish bias
Strong base formation afte

See all editors' picks ideas
Multi-Ticker Anchored CandlesMulti-Ticker Anchored Candles (MTAC) is a simple tool for overlaying up to 3 tickers onto the same chart. This is achieved by interpreting each symbol's OHLC data as percentages, then plotting their candle points relative to the main chart's open. This allows for a simple comparison of tickers to tr

Vdubus Divergence Wave Pattern Generator V1The Vdubus Divergence Wave Theory
10 years in the making & now finally thanks to AI I have attempted to put my Trading strategy & logic into a visual representation of how I analyse and project market using Core price action & MacD. Enjoy :)
A Proprietary Structural & Momentum Confluence System

Per Bak Self-Organized CriticalityTL;DR: This indicator measures market fragility. It measures the system's vulnerability to cascade failures and phase transitions. I've added four independent stress vectors: tail risk, volatility regime, credit stress, and positioning extremes. This allows us to quantify how susceptible markets are

Volatility Risk PremiumTHE INSURANCE PREMIUM OF THE STOCK MARKET
Every day, millions of investors face a fundamental question that has puzzled economists for decades: how much should protection against market crashes cost? The answer lies in a phenomenon called the Volatility Risk Premium, and understanding it may fundam

Volume Gaps & Imbalances (Zeiierman)█ Overview
Volume Gaps & Imbalances (Zeiierman) is an advanced market-structure and order-flow visualizer that maps where the market traded, where it did not, and how buyer-vs-seller pressure accumulated across the entire price range.
The core of the indicator is a price-by-price volume prof

Match Finder [theUltimator5]Match Finder is the dating app of indicators. It takes your current ticker and finds the most compatible match over a recent time period. The match may not be Mr. right, but it is Mr. right now. It doesn't forecast future connection, but it tells you current compatibility for today.
Jokes aside,

Trend Line Methods (TLM)Trend Line Methods (TLM)
Overview
Trend Line Methods (TLM) is a visual study designed to help traders explore trend structure using two complementary, auto-drawn trend channels. The script focuses on how price interacts with rising or falling boundaries over time. It does not generate trade sign

Breakouts & Pullbacks [Trendoscope®]🎲 Breakouts & Pullbacks - All-Time High Breakout Analyzer
Probability-Based Post-Breakout Behavior Statistics | Real-Time Pullback & Runup Tracker
A professional-grade Pine Script v6 indicator designed specifically for analyzing the historical and real-time behavior of price after strong All-Ti

Count█ OVERVIEW
A library of functions for counting the number of times (frequency) that elements occur in an array or matrix.
█ USAGE
Import the Count library.
import joebaus/count/1 as c
Create an array or matrix that is a `float`, `int`, `string`, or `bool` type to count elements from, t

Holographic Market Microstructure | AlphaNattHolographic Market Microstructure | AlphaNatt
A multidimensional, holographically-rendered framework designed to expose the invisible forces shaping every candle — liquidity voids, smart money footprints, order flow imbalances, and structural evolution — in real time.
---
📘 Overview
The Hol

See all indicators and strategies
Community trends
APL APOLLO – Cup & HandleAPL Apollo spent several months correcting after a strong up-move and gradually formed a rounded base. This phase reflects distribution getting absorbed and weak hands exiting, not aggressive selling.
Price then retraced back toward the prior resistance zone around 1820–1830, which acted as the rim

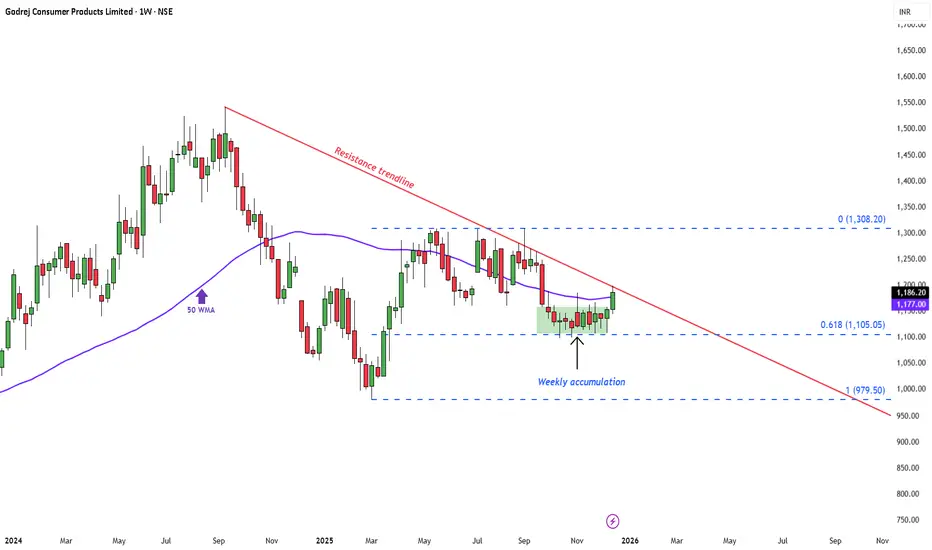
Godrej Consumer Products: Weekly Accumulation Showing StrengthAfter weeks of quiet accumulation near the 0.618 retracement (~₹1,105) , the stock has now delivered a weekly close above the 50-week moving average — a constructive sign of improving sentiment.
The move also puts price right at the descending resistance trendline , where follow-through buying
State Bank Weekly Price Action Analysis for Jan 2026Analysis date: 20-Dec-2025
State Bank closed at 980 levels but the volume is pretty low. This is not a good sign of bullishness. Chances are, sellers could be waiting for price to come in 990 range. They may take the price down to 970 levels as shown on the charts.
Bulls trade with caution.
Bullish
RAIN: Turnaround Fundamental Play,Trendline BO,Chart of the WeekNSE:RAIN When Carbon Giants Face the Perfect Storm of Bearish Signals and Sectoral Headwinds NSE:RAIN showing signs of Fundamental Turnaround. Let's understand this week's "chart of the week"
As per the Latest SEBI Mandate, this isn't a Trading/Investment RECOMMENDATION nor for Educational Purp

StarThe price faced resistance at the 1020 zone, fall down and took support at the 850 zone. This created a narrow range which resulted in a symmetrical triangle pattern. The breakout can happen in any direction.
Buy above the 900 - 910 zone with the stop loss of 885 for the targets 925, 940, 954, 972,

Delhivery Cmp 406 Tripple bottomDelhivery Cmp 406 dated 19-12-2025
1. Tripple bottom
2. Price reversed from Support
3. RSI reversed
Buy @ cmp SL 394 target 410-415-420-425
430-435-440
It is just a view, please trade at your own risk.

BTST To Swing OpportunityWaaree Energies
Smart Move near closing time
CMP 4065
SL CLB 3090
Tgt 3240 & Beyond
⚠️ Note: Stick to levels, follow discipline & use TSL (Trailing Stop Loss) once target starts approaching.
Let’s stay hopeful that the move continues as per our expectations! 📈
💡 Liked the idea?
Then don’t forg

#JKTYRE - Cup & Handle / IHNS BO in DTFScript: JKTYRE
Key highlights: 💡⚡
📈 Cup & Handle / IHNS BO in DTF
📈 Volume spike seen during Breakout
📈 MACD Bounce
📈 RS Line making 52WH
✅Boost and follow to never miss a new idea! ✅
⚠️ Important: Always Exit the trade before any Event.
⚠️ Important: Always maintain your Risk:Reward Ratio as 1
When will JSWINFRA pick up strength and make new highs56000 cr's company with consistent quarterly results and YOY growth. Looking at the chart pattern, it suggests, it will make bottom somewhere around 250 -260 zone and looks good for higher targets (400+).

Infosys (W): Bullish - Coiling Pre-BreakoutTimeframe: Weekly | Scale: Logarithmic
The stock is in the final stages of a consolidation pattern, trading just below a multi-year resistance zone. The setup is a classic "absorption" phase , where buyers are soaking up supply before an imminent breakout, fueled by sector tailwinds.
🚀 1. The F

See all stocks ideas
No scheduled reports
Tomorrow
2
2651Neptune Logitek Ltd.
Exchange
BSE
Offer price
1.402
USD
Dec 23
N
NVFYKSH International Ltd.
Exchange
BSE
Offer price
4.02 - 4.23
USD
Dec 24
5
544512Marc Technocrats Limited
Exchange
NSE
Offer price
0.98 - 1.03
USD
Dec 24
H
HYPE3Global Ocean Logistics India Ltd.
Exchange
BSE
Offer price
0.81 - 0.86
USD
Dec 30
5
544562Gujarat Kidney & Super Speciality Ltd.
Exchange
NSE
Offer price
—
Dec 30
MAEDachepalli Publishers Limited
Exchange
BSE
Offer price
—
Dec 30
N
NFLDSundrex Oil Co. Ltd.
Exchange
NSE
Offer price
0.90 - 0.96
USD
Dec 31
5
544500Bai-Kakaji Polymers Ltd.
Exchange
BSE
Offer price
1.96 - 2.06
USD
Dec 31
6
601088Admach Systems Ltd.
Exchange
BSE
Offer price
2.49 - 2.63
USD
Dec 31
5
544599Apollo Techno Industries Ltd.
Exchange
BSE
Offer price
1.35 - 1.43
USD
See more events
Community trends
VIKM//@version=5
indicator("Intraday VWAP EMA Signal - Hindi", overlay=true)
// EMA
ema20 = ta.ema(close, 20)
ema50 = ta.ema(close, 50)
// VWAP
vwapValue = ta.vwap(close)
// Plot EMA & VWAP
plot(ema20, title="20 EMA", color=color.green, linewidth=2)
plot(ema50, title="50 EMA", color=color.red, linewi

Zoom Out: Bitcoin’s 14-Year Structural Expansion Explained!Hey Everyone, let's analyse long term structural view on Bitcoin as it is once again sitting inside the same structural expansion channel it has respected for more than 14 years.
Zooming out removes the noise, what looks random on lower timeframes reveals a very consistent long-term pattern.
Mos

BTCUSD WEEKLY ANALYSISAll support and resistance in the weekly and monthly time frames have been tested from 126000 to 76000.
A reaction of the weekly and monthly supply zones results in an explosive red candle in both time frames.
as per my opinion, the very next demand zone in the weekly time frame range is 74000 t

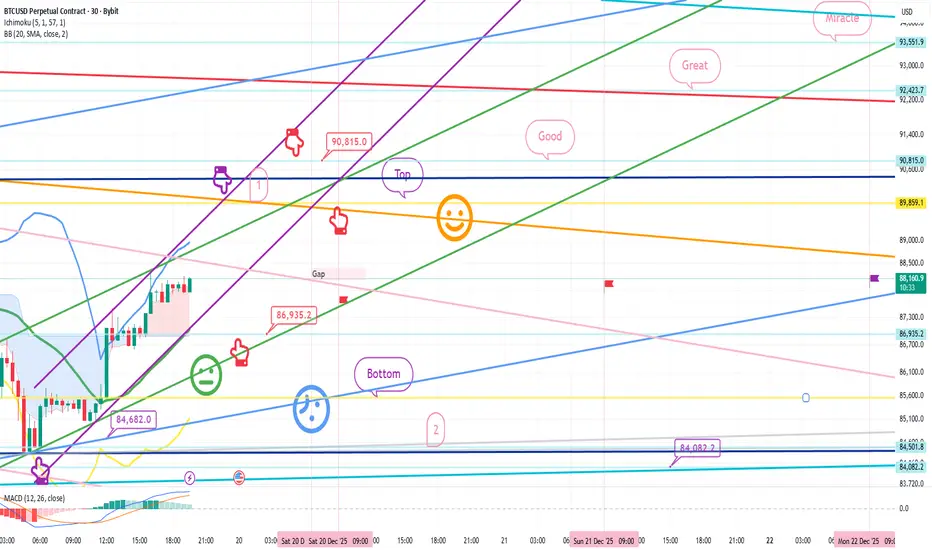
Bitcoin Bybit chart analysis December 19
Hello
It's a Bitcoin Guide.
If you "follow"
You can receive real-time movement paths and comment notifications on major sections.
If my analysis was helpful,
Please click the booster button at the bottom.
This is a Bitcoin 30-minute chart.
Shortly, at 10:30 AM and 12:00 PM, the Nasdaq indicato
Ethereum in an Ascending Channel | A Mid-Term Correction Before?Ethereum (ETH) is still trading within a long-term ascending channel, maintaining its overall bullish structure. However, at the current stage, the price appears to be undergoing a medium-term correction.
From a technical perspective, this corrective move may extend toward the $2,200 support zone,

Weekly Analysis of BTC with Buy/Sell scenarios...We analyzed three weeks back that BTC would be in range for some time before taking any further move, And BTC is following same analysis and trapped within a small range since then. BTC prediction of last week also worked perfectly well and market kept in consolidation mode itself. BTC is still in c

#bitcoin @bitcoin hiccups#bitcoin
@bitcoin
After a high, seems sobering down, with a few hiccups, before deciding it's next move. Is sloping down too 85600.

Bull Run at a Critical PointThe last hope for bull continuation on the weekly chart lies in the $86K–$74K demand zone.
✅ A strong weekly rejection from this level is mandatory
✅ Followed by a daily close above $107,400
❌ If $107.4K is not reclaimed, this move is just a relief rally in a bearish trend, with more downside ahea


Final leg to the downside before see one last run to end cycleMarkets rarely witness deep crashes during an active bull run, yet history shows that major corrections often occur before the final and most impulsive leg of the cycle. Bitcoin’s 2021 bull market offers a clear example. On 12 April 2021, Bitcoin topped near $64,000, followed by a sharp 55% decline.

See all crypto ideas
Gold After Liquidity Grab: Short side intraday move, R you readyHello Everyone, let's analyse Gold as this once again tested a major resistance zone, but instead of giving a clean breakout, price briefly moved above the level and then quickly reversed. This move was not strength, it was a liquidity grab.
In simple words, smart money pushed price above resistanc

XAUUSD H4 – Medium-Term Outlook for the Coming WeekGold remains within a broad rising channel, but recent price action shows clear rejection at the upper trendline. For the week ahead, the focus is on a potential technical pullback, while keeping an alternative bullish scenario if the market fully accepts higher prices.
PRIORITY SCENARIO – MAIN SCE

XAUUSD (D1) – Weekly OutlookLana focuses on buying discounted zones, preparing for a possible ABC correction 💛
Quick summary
Higher timeframe (Daily): The main uptrend remains intact and structurally strong
Elliott Wave: Gold likely completed Wave 5, with a potential ABC corrective phase ahead to complete the cycle
Liquidi

Copper Upmove will continue buy on dip 1155-1170, final 1500++ Parameter Data
Asset Name Copper (HG) MCX Dec 2025 Futures
Price Movement 🟩 Bullish Trend / Intraday Sideways (LTP: ₹1,114.20 | +0.22%)
Current Trade 🟨 BUY ON DIPS (Targeting ₹1,125 near-term)
SMC Structure 🟩 Bullish Markup Phase (Market in a parabolic wave 5)
Trap/Liquidity Zones 🟥 Supply Zone: ₹1,

NATURAL GAS BEARISH TRADE
According to RSI and channel on weekly time frame perfect entry to bearish natural gas trade
Second trade is based on trendline brake
We see channel on weekly time frame and find exact entry in 2 HR time frame

XAUUSD | Awaiting Reaction at OB + Fibo to Confirm Next Move◆ Market Context (M30)
The price is maintaining an uptrend with a supporting trendline. After a strong push creating a short-term peak, the market enters a pullback to rebalance. The current decline has not broken the upward structure.
◆ SMC & Price Action
• The rapid decline creates an OB + Fibo S

Gold shows bullish near 4355 bearish close indicates reversal.Gold is currently showing strong bullish momentum, with the price moving up to 4355. However, the market closing with bearish pressure indicates a potential reversal. The 4355 level is an important resistance point, and traders might consider entering a sell trade here. Setting a stop loss at 4374 w

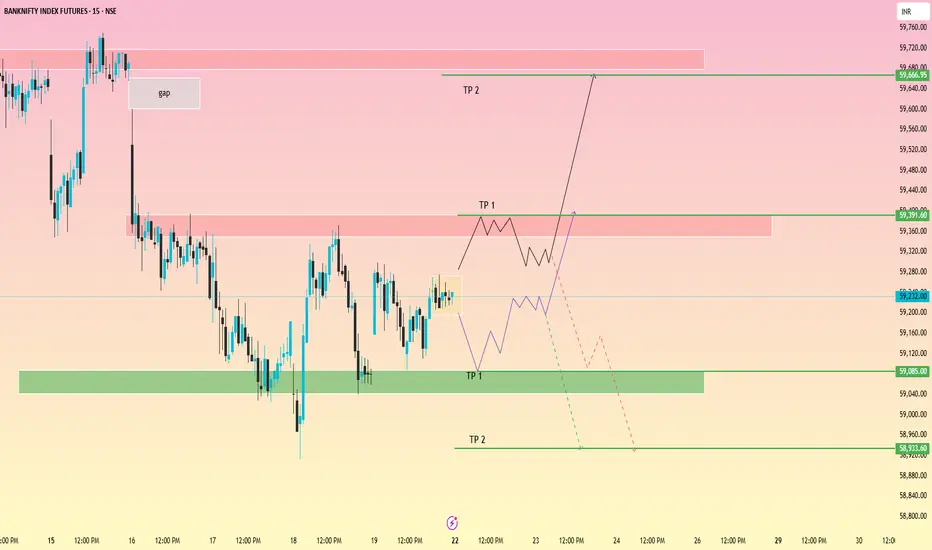
short covering ?bank nifty future chart
possibility 1 =
in BN short covering can happen beacuse ( retailers made heavy short positons & fii & pro in long ) so if 59400 break out then short covering can come.
possibilty 2=
if gap down happen / sudden down move , then if market did not move above pdc bef
Weekly analysis of XAUUS/Gold with buy and sell scenarios...Last week gold moved in a range, as we analyzed and closed below the high of previous week. Weekly candle is indecision candle and now price is near to all time high level. Coming week, we may see a range bound market crating both buy and sell side scenario till price break all time high with volume

Elliott Wave Analysis – XAUUSD Week 4 of December
1. Momentum Overview
Weekly (W1)
Weekly momentum is currently preparing to reverse to the downside. If a confirmation candle appears next week, a weekly bearish trend is likely to be established. This would indicate the beginning of a multi-week corrective phase.
Daily (D1)
Daily momentum has alr

See all futures ideas
Triangle Compression Zone🔎 Overview
The Triangle Compression Zone highlights a phase where price transitions from directional movement into consolidation. After an initial trend, price begins to contract between converging support and resistance lines, signaling reduced volatility and temporary market balance.
-------

CHFJPY – Bias-Driven HFT Buy OpportunityThis my first Idea I share in public. Bias-driven HFT buy on CHFJPY, aligned with the higher-timeframe Monthly bullish structure. Price is holding above key support and reacting from a discount zone. Entry is taken in line with structure continuation, with SL below the current daily candle and targe

EUR/USD Decision PhaseEUR/USD Decision Phase
Recent candles indicate a slowdown in upside follow-through, implying that short-term positioning may be crowded. This pause does not immediately invalidate the broader constructive tone but introduces the risk of a corrective rotation as liquidity is rebalanced. The projecte

EURUSD-Short-15MThe trade was initiated based on a high-probability setup identified through a confluence of technical factors.
Higher Timeframe (HTF) Analysis: Price action on a higher timeframe (15 MIn) demonstrated a perfect retracement into a previously identified order block (OB). This order block represente
EURUSD Monthly View – Trendline Breakout Sustained, Weekly Flag EURUSD has already broken above the key trendline and sustained, confirming bullish momentum. On the monthly chart, the pair is testing the previous high — a clean breakout and sustained close above this level could trigger fresh long opportunities and mark the start of a new uptrend.
On the weekly

USDJPY – Potential for a Volatile End to the WeekIt’s the last full trading week of the year before the Christmas break but that doesn’t necessarily mean that FX markets will be quiet. The calendar is still packed full of important risk events, and when combined with the possibility for decreasing levels of liquidity into Friday’s close it could

AUDCHF
Massive AOI in daily TF.
impulsive brake and come to retest the previous structure.
1. in daily TF:- After long time finaly brake the consodetion.
Become bearish to bullish.
2. in 4h TF:- Come for retesting the AOI or previous structore.
Wating for (CHOCH) change of carectore.

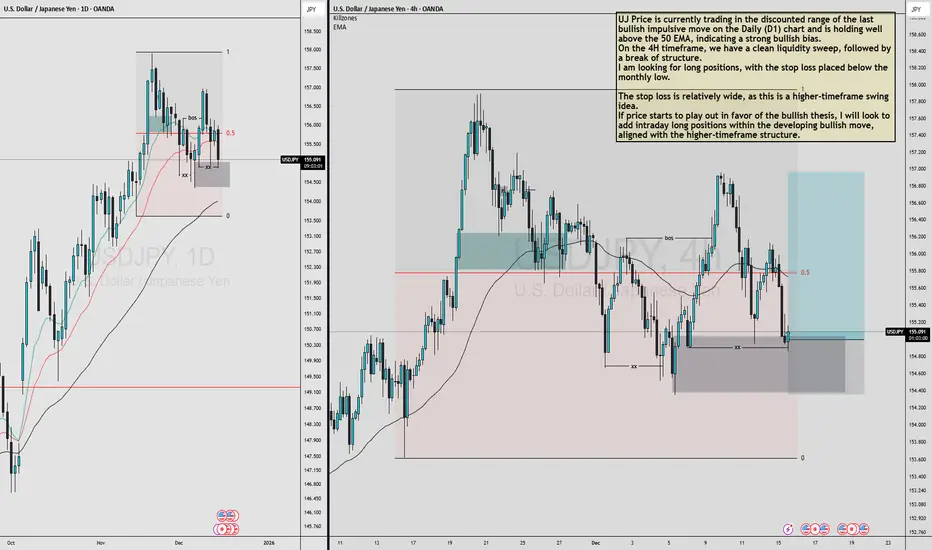
USDJPY MULTI TIMEFRAME ANALYSIS UJ Price is currently trading in the discounted range of the last bullish impulsive move on the Daily (D1) chart and is holding well above the 50 EMA, indicating a strong bullish bias.
On the 4H timeframe, we have a clean liquidity sweep, followed by a break of structure.
I am looking for long posit
AUD/CAD Bullish in Daily time frameTechnically : AUD/CAD is technically ready for bullish move. As the wave 1( impulse) followed by wave 2 (Correction), Wave 3 (impulse), followed by wave 4(Correction). Wave 5 Start will be determined by Fundamental connection.
Fundamental Data : CAD CPI will be published tomorrow. Based on the re

USDJPY LONGprice came to retest the daily demand area and gave a ltf confirmation on 15.
study the reaction at marked levels

See all forex ideas
| - | - | - | - | - | - | - | - | ||
| - | - | - | - | - | - | - | - | ||
| - | - | - | - | - | - | - | - | ||
| - | - | - | - | - | - | - | - | ||
| - | - | - | - | - | - | - | - | ||
| - | - | - | - | - | - | - | - | ||
| - | - | - | - | - | - | - | - | ||
| - | - | - | - | - | - | - | - | ||
| - | - | - | - | - | - | - | - |
Trade directly on Supercharts through our supported, fully-verified, and user-reviewed brokers.


