KAZIA THERAPEUTICS LTD SPONSORED ADRKZIA made double bottom with divergence with good volume and breakout at $4.45 with first target of $22.5, if and second target of $41.7 and with can expect strong resistance at $41.7 and reverse might happen. If KZIA did breakout at this level we can expect rally till $79.
Analysis is made on week

Cyber Monday
The greatest deal of the year is in its final orbit.Secure this offer before it's gone.

Crude is ready for CRAZY upsideCurrently Crude is at 58/59
Crude is making Diametric pattern on a weekly timeframe, Where we can see crude has made 2 complex pattern which is (ABCDE-XYZ-ABCDE)
This is the last wave of Diametric pattern, so if Crude gives breakout around 72 which is very liekly
we can see 91/92 levels in comi

BANK OF BARODA @290Not a SEBI registered, just sharing idea. BOB on the verge of breakout from rounding bottom formation. Before breakout consolidating near range. If breakout happen then it blast like federal bank or canara bank.

ICICIBANK - Inverted Head & Shoulder suggests 1450ICICI Bank has completed a clean Inverted Head and Shoulders pattern on the 4H chart, signalling a possible trend reversal after the recent downtrend. The left shoulder formed near 1360 , the head at 1317 , and the right shoulder at 1354 . All three points reflect stronger structure and consisten

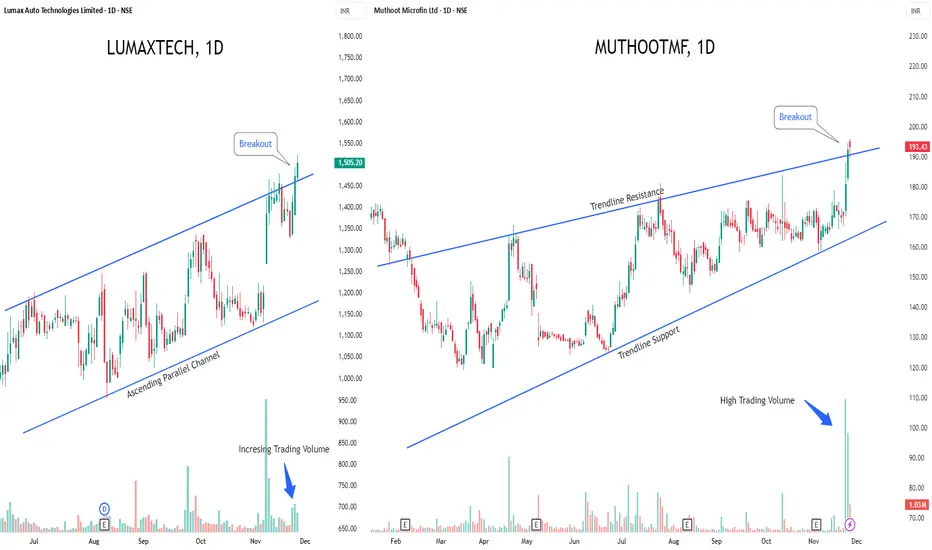
LUMAXTECH & MUTHOOTMF - Breakout Stocks to Watch This Week!1️⃣ Lumax Auto Technologies NSE:LUMAXTECH — Fresh Breakout Alert
Lumax is riding a strong uptrend and has cleanly broken above the upper boundary of its ascending parallel channel.
If this breakout sustains, the stock could see a sharp upside rally ahead.
Rising volumes are confirming strong
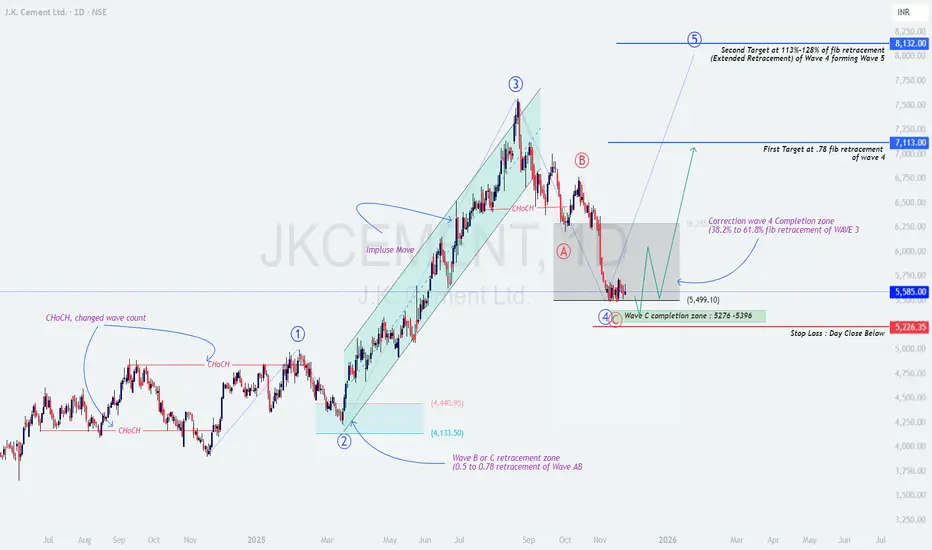
JKCEMENT at Demand Zone – Is Wave 5 About to Start?⚡ JK CEMENT – Wave 4 Correction Completing | Wave 5 Blast Loading?
🧠 Overall Market Structure
JK Cement is showing a textbook Elliott Wave progression, and price has now entered the crucial Wave 4 → Wave C completion zone (₹5276–₹5396).
This zone aligns with 38.2% to 61.8% retracement of Wave 3
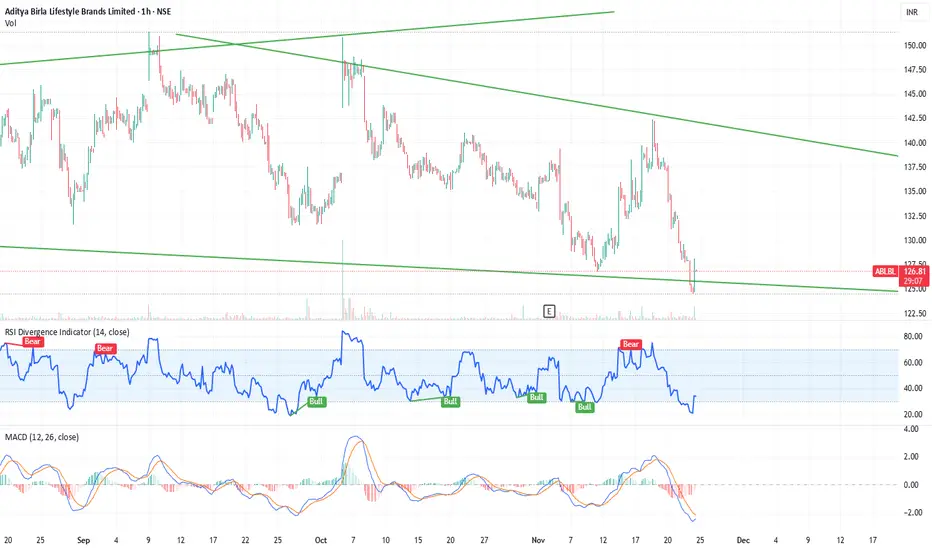
Falling Wedge Pattern (Bullish Setup) | Re-Opportunityit did give an opportunity last week, then fell, and is again at an opportunity zone now.
RSI Analysis
Your RSI shows:
RSI near 37–38
This is close to oversold, which is usually where reversals happen
Earlier, RSI bounced from similar levels
➡️ Supports a bounce possibility.
MACD Analysis
MACD is
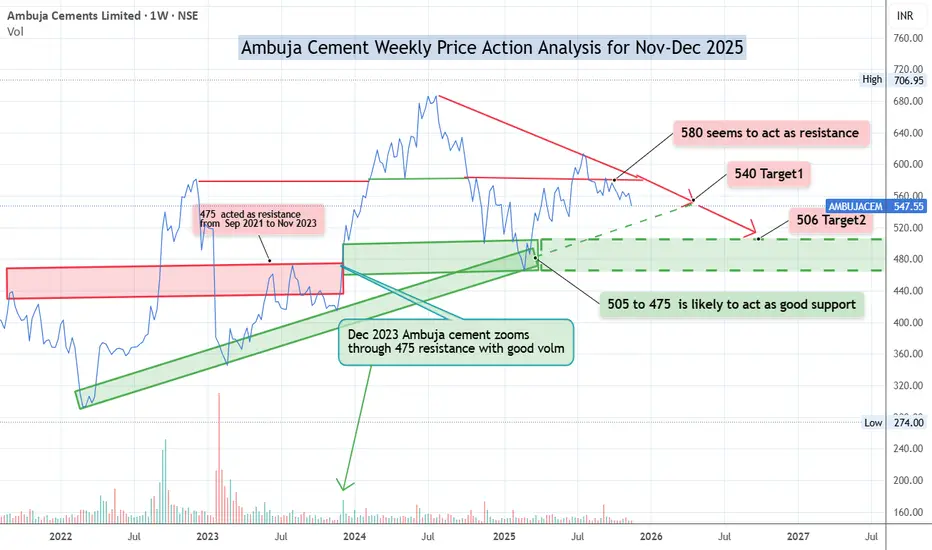
Ambuja Cement Weekly Price Action Analysis for Nov-Dec 2025On Weekly chart Ambuja Cement has closed at 547 on 20-Nov-25
Recent price action indicates the stock is struggling to go past 575-580 area.
It is likely to continue going down till its support major region of 505-475.
One can sell/short sell whenever the stock comes near 570 region. Keeping SL of 5
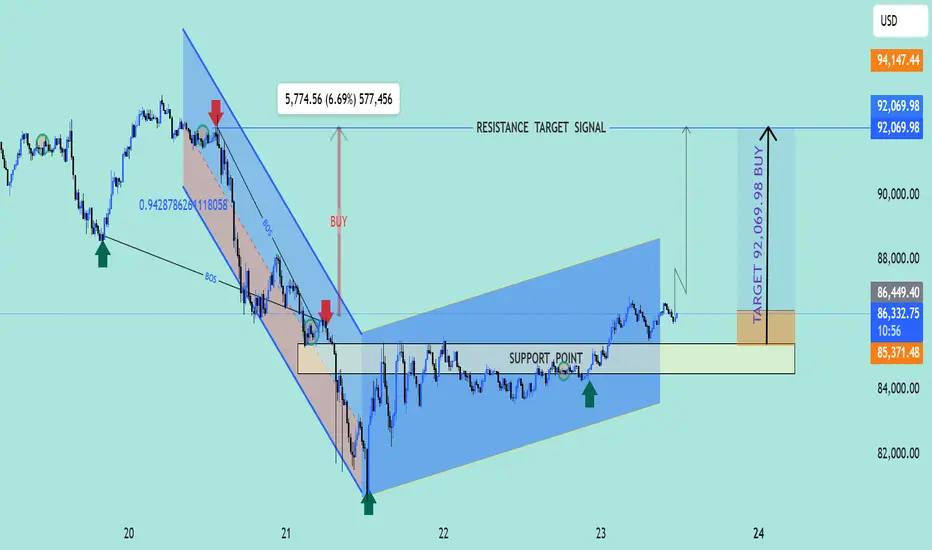
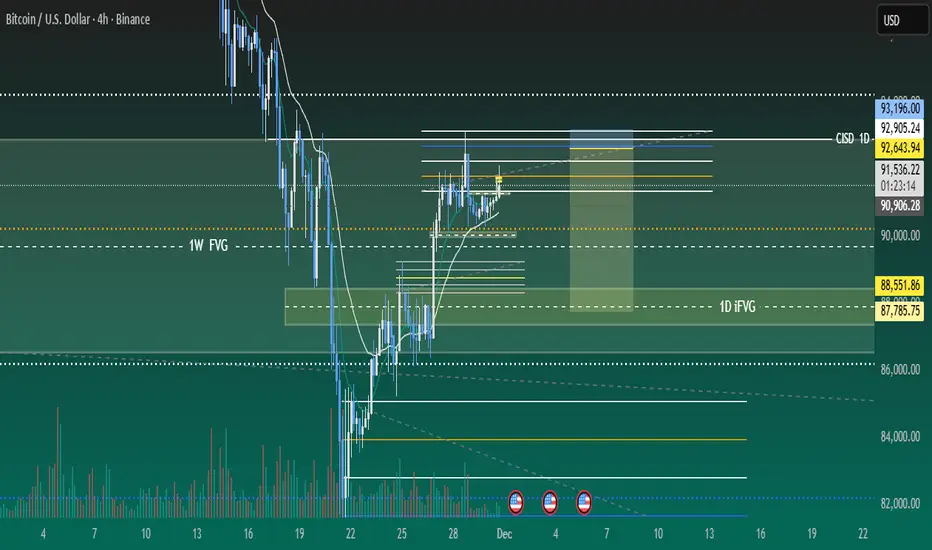
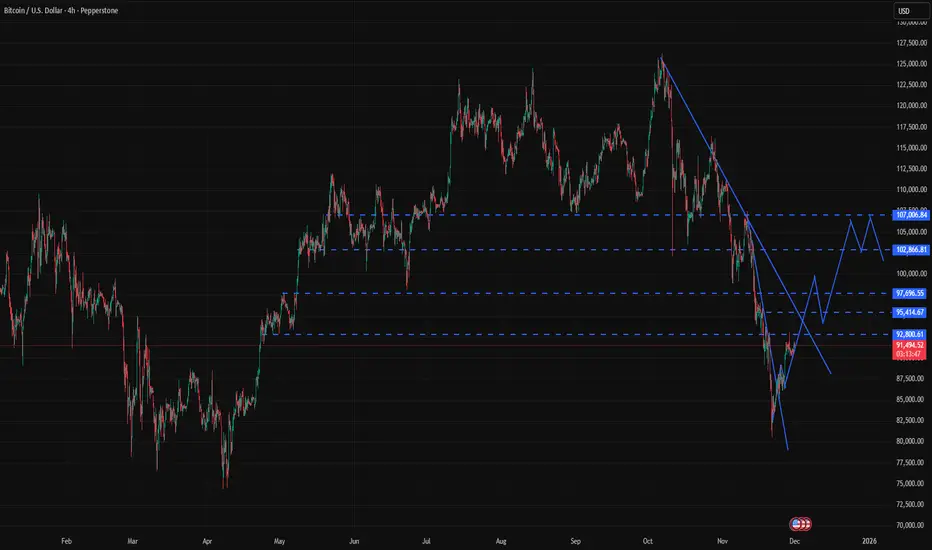
4. Price Action Analysis with Target at 92K1. Market Structure
The chart shows that the market was previously in a downtrend, but price has now created a bullish structure shift.
This shift is confirmed by a Break of Structure (BOS) to the upside, meaning buyers have taken control.
---
2. Support Zone
Price reacted strongly from the sup
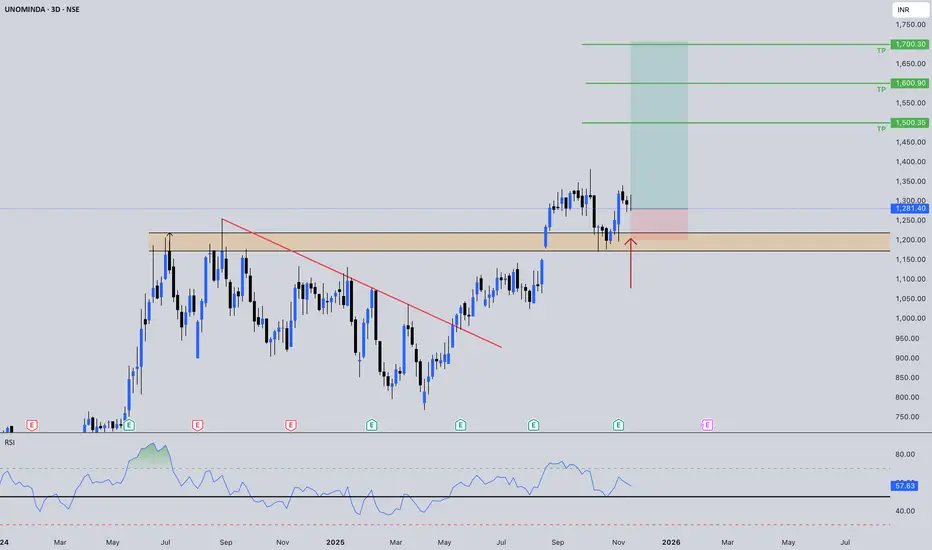
UNOMINDA: Post-Breakout Retest - Setting Up For Wave 2
Price shows a text-book breakout and retest of a multi-month consolidation high, signaling a potential acceleration phase in the Auto Components space.
🔍 Technical Snapshot (3-Day Chart)
Metric: Breakout Zone
Value: ₹1,180–₹1,250
Interpretation: Critical horizontal resistance flipped to suppo
See all editors' picks ideas
Match Finder [theUltimator5]Match Finder is the dating app of indicators. It takes your current ticker and finds the most compatible match over a recent time period. The match may not be Mr. right, but it is Mr. right now. It doesn't forecast future connection, but it tells you current compatibility for today.
Jokes aside,

Trend Line Methods (TLM)Trend Line Methods (TLM)
Overview
Trend Line Methods (TLM) is a visual study designed to help traders explore trend structure using two complementary, auto-drawn trend channels. The script focuses on how price interacts with rising or falling boundaries over time. It does not generate trade sign

Breakouts & Pullbacks [Trendoscope®]🎲 Breakouts & Pullbacks - All-Time High Breakout Analyzer
Probability-Based Post-Breakout Behavior Statistics | Real-Time Pullback & Runup Tracker
A professional-grade Pine Script v6 indicator designed specifically for analyzing the historical and real-time behavior of price after strong All-Ti

Count█ OVERVIEW
A library of functions for counting the number of times (frequency) that elements occur in an array or matrix.
█ USAGE
Import the Count library.
import joebaus/count/1 as c
Create an array or matrix that is a `float`, `int`, `string`, or `bool` type to count elements from, t

Holographic Market Microstructure | AlphaNattHolographic Market Microstructure | AlphaNatt
A multidimensional, holographically-rendered framework designed to expose the invisible forces shaping every candle — liquidity voids, smart money footprints, order flow imbalances, and structural evolution — in real time.
---
📘 Overview
The Hol

PriceFormatLibrary for automatically converting price values to formatted strings
matching the same format that TradingView uses to display open/high/low/close prices on the chart.
█ OVERVIEW
This library is intended for Pine Coders who are authors of scripts that display numbers onto a user's charts. T

LogNormalLibrary "LogNormal"
A collection of functions used to model skewed distributions as log-normal.
Prices are commonly modeled using log-normal distributions (ie. Black-Scholes) because they exhibit multiplicative changes with long tails; skewed exponential growth and high variance. This approach i

Range Oscillator (Zeiierman)█ Overview
Range Oscillator (Zeiierman) is a dynamic market oscillator designed to visualize how far the price is trading relative to its equilibrium range. Instead of relying on traditional overbought/oversold thresholds, it uses adaptive range detection and heatmap coloring to reveal where pri

Volume Surprise [LuxAlgo]The Volume Surprise tool displays the trading volume alongside the expected volume at that time, allowing users to spot unexpected trading activity on the chart easily.
The tool includes an extrapolation of the estimated volume for future periods, allowing forecasting future trading activity.
🔶 U

Smooth Theil-SenI wanted to build a Theil-Sen estimator that could run on more than one bar and produce smoother output than the standard implementation. Theil-Sen regression is a non-parametric method that calculates the median slope between all pairs of points in your dataset, which makes it extremely robust to o

See all indicators and strategies
Community trends
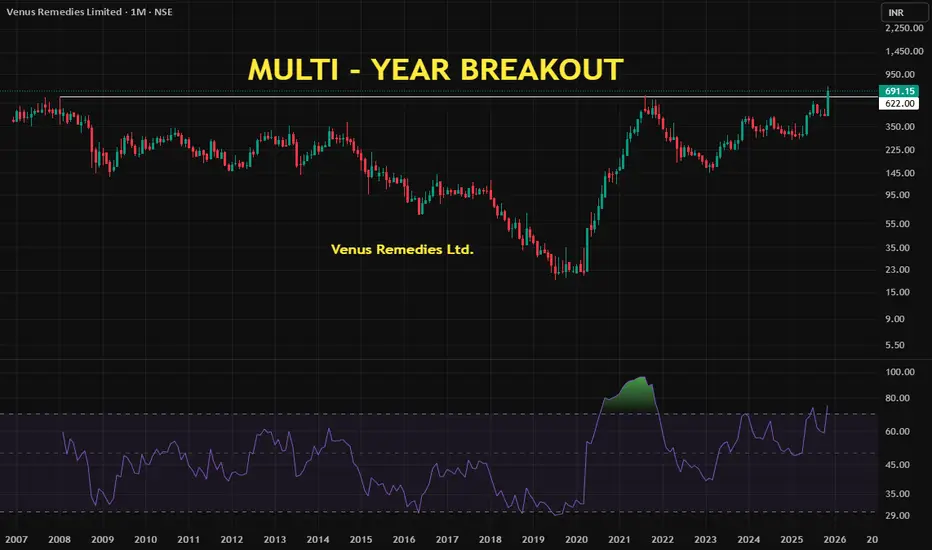
Venus Remedies: Understanding Its Multiyear Breakout🚀 Venus Remedies: Understanding Its Multiyear Breakout and RSI Momentum
A Rare Multiyear Breakout :
Venus Remedies, currently trading around ₹691 on the monthly chart, has achieved something technically significant — a multiyear breakout.
A breakout occurs when a stock price moves above a long-st
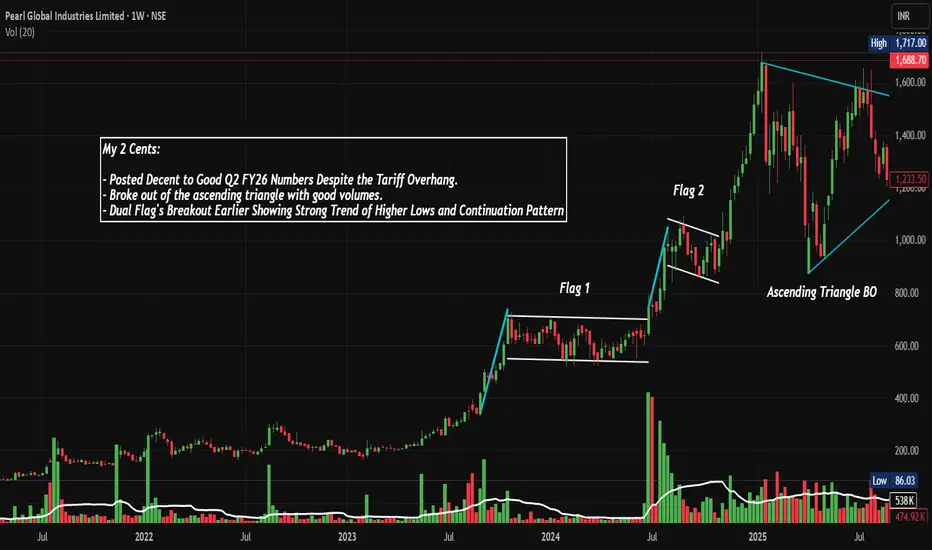
PGIL: Dual Flags and Asce. Triangle Breakout, Chart of the MonthFrom Dual Flags to Triangle Breakouts: How NSE:PGIL Spun a 10x Return Story While Tackling Global Tariff Headwinds and Posting Strong Q2 FY26 Numbers. Lets Analyse in Chart of the Month.
As per the Latest SEBI Mandate, this isn't a Trading/Investment RECOMMENDATION nor for Educational Purposes
KRBL: Basmati Leader Coiling Below Breakout Zone
KRBL is consolidating just below a key resistance band around 415-425 after a steady up move, with support holding near 398-405.
A sustained breakout and daily close above the resistance zone can open room towards high levels in line with the prevailing uptrend, while a decisive break below th

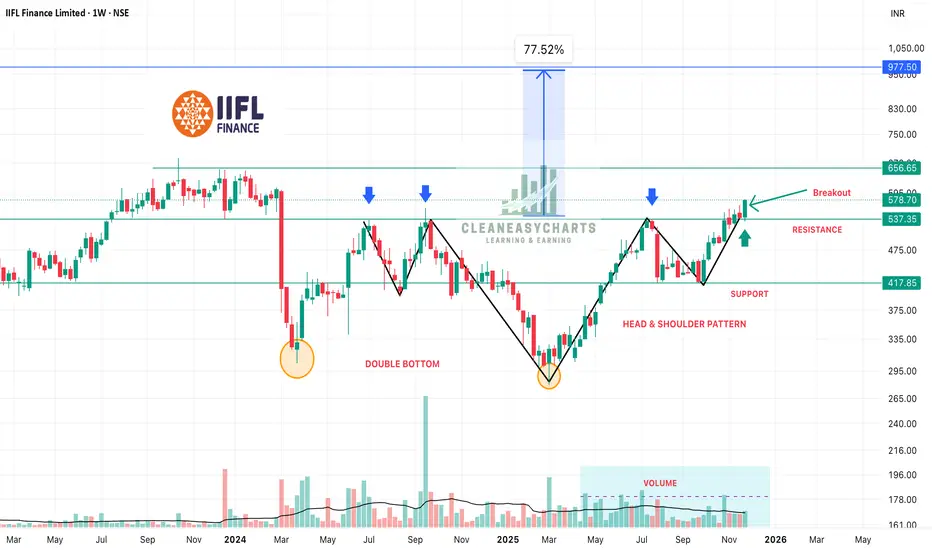
IIFL Finance - Double Bottom & Head & Shoulder PatternIIFL is read to rock by 70%-80% rise from current price on account of following:
1. 52% increase in QnQ profits
2. Double Bottom Pattern on Weekly Time Frame
3. Inverted Head & Shoulder Pattern on Weekly Time Frame
4. Weekly Breakout is already done - see last weeks candle
5. Volumes are steady
K
BUY TODAY SELL TOMORROW for 5%DON’T HAVE TIME TO MANAGE YOUR TRADES?
- Take BTST trades at 3:25 pm every day
- Try to exit by taking 4-7% profit of each trade
- SL can also be maintained as closing below the low of the breakout candle
Now, why do I prefer BTST over swing trades? The primary reason is that I have observed that

ACC at Covid/2009 Valuations — Is the Market Mispricing This?ACC is currently trading at ~35% below its all-time high. Its Price-to-Book Value is near multi-decade lows, comparable to Covid and 2009 levels, and the PE ratio is at its lowest point in the past 15 years. The stock is positioned near a strong support zone and is showing early signs of a potential

ANUPAM RASAYAN ANALYSISTHIS IS MY CHART OF THE WEEK PICK
FOR LEARNING PURPOSE
ANUPAM RASAYAN INDIA LTD- The current price of ANURAS is 1221.70 rupees
I am going to buy this stock because of the reasons as follows-
1. It gave a good breakout and made a new ATH
It's coming out from a good base.
2. I

ACC Ltd. (ACC)We mustn't forget that a top-down approach is essential. The infrastructure and cement sectors haven't seen significant movement for a long time. While you can plot the time cycle for each stock, you can't decide whether to trade or not, or you can't trade on every chart that has a time cycle plotte

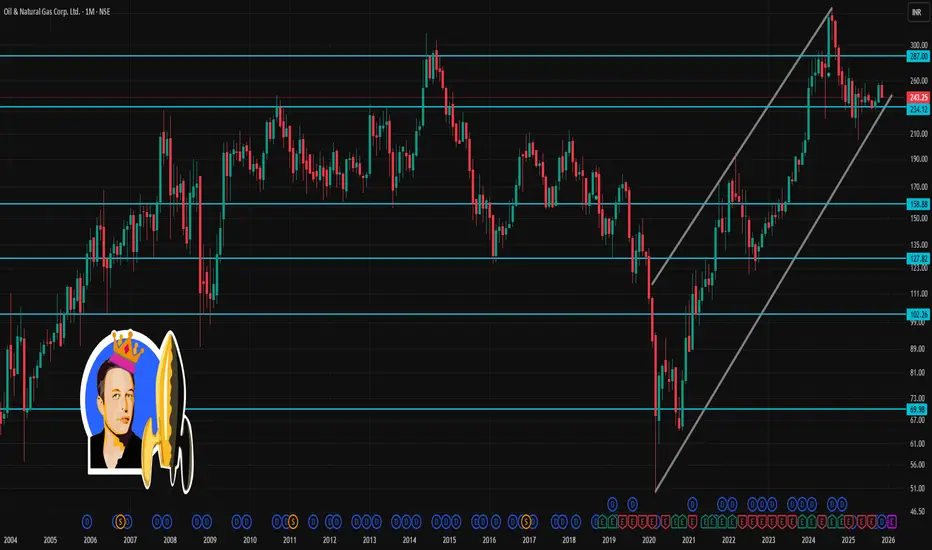
ONGC 1 Month Time Frame 📌 Current snapshot
ONGC last traded around ₹243–₹244.
Over the past month, the stock has dropped ~3–4%.
📈 What could happen in next month
Bearish scenario: If price slips below ₹241 and sentiment (oil prices, global energy demand, investor flows) remains weak — ONGC could test the lower support
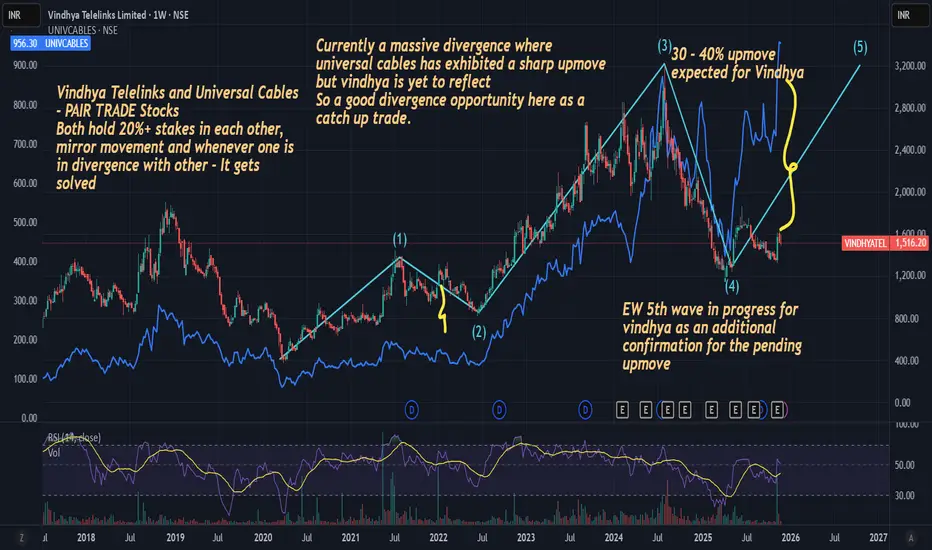
Vindhya Telelinks - Ripe for a Solid Upmove + A divergence playVindhya Telelinks has started with 5th EW wave, marking a last pending bull move for the stock
The Stock is also a pair trade play alongside another scrip Universal Cables. Both hold individual stakes in each other and have a long history of complementing moves together. Can check with the Chart
H
See all stocks ideas
Dec 3
F
FRMIMother Nutri Foods Limited
Exchange
BSE
Offer price
1.24 - 1.31
USD
Dec 5
C
CMPIPurple Wave Infocom Ltd.
Exchange
BSE
Offer price
1.34 - 1.41
USD
Dec 5
T
TINLogiciel Solutions Ltd.
Exchange
BSE
Offer price
2.05 - 2.16
USD
Dec 8
C
CHWYClear Secured Services Ltd.
Exchange
NSE
Offer price
1.40 - 1.48
USD
Dec 8
J
JOCMInvicta Diagnostic limited
Exchange
NSE
Offer price
0.90 - 0.95
USD
Dec 9
T
TPVNeochem Bio Solutions Ltd.
Exchange
NSE
Offer price
—
Dec 9
E
EMASHelloji Holidays Ltd.
Exchange
BSE
Offer price
1.23 - 1.32
USD
Dec 10
3
320000Meesho Ltd.
Exchange
BSE
Offer price
1.18 - 1.24
USD
See more events
Community trends
BITCOIN is ready for ALL TIME HIGH !! Bitcoin is making Rising channel on a weekly timeframe
In which its making 5 wave structure
Also Bitcoin has given the breakout of Head and shoulder pattern, and BTC has achieved its Linear Target and now down 35%
Also while going up Bitcoin is making Rising channel
Both are indicating super

ETH Could Skyrocket to $7.8K After FUSAKA Upgrade: History ShowsCRYPTOCAP:ETH Could Skyrocket to $7.8K After FUSAKA Upgrade – History Shows
The last Ethereum Pectra Upgrade on 7 May 2025 triggered a massive move:
✅ +55% in 35 days
✅ +168% in 109 days
What’s next?
The FUSAKA Upgrade is scheduled for 3 December 2025. If history repeats:
👉 Target 35 days post-u

BTCUSD – Key Level Rejection with Potential Liquidity Sweep TowaChart Analysis
1. Price Context
BTCUSD is trading around $90,675.
The chart shows price rejecting the Key Level and failing to hold above the Daily CLS (daily close level).
Recent candles indicate loss of bullish momentum with a series of lower highs forming.
2. Key Zones on Your Chart
🔴 Daily C

Weekly analysis BTC with high RnR scenariosBTC is now in consolidation zone and may spend some more days. It may also develop ABC pattern or reversal at daily level, if price has to change its delivery and take turn from here. This zone is kind of make or break. If price is not able to sustain and breakdown, then it may witness ~65-70K level
BTCUSDStrong bullish continuation. Liquidity has been engineered below the range; smart money is now positioned for markup into premium arrays. Expect reduced sell pressure and increasing buy-side volume

Dubious Speculation for BitcoinThat's my base case for BITSTAMP:BTCUSD Bitcoin for the next one year.
➡️ That we may see a counter rally till 100,000 level by Feb 2026.
➡️ That we will bottom around 65,000-70,000 by Oct 2026

Bitcoin to slip more ...#BTCUSD at 91325
to continue Bear 🐨 trend🎢
Expected to hit:
TP 1: 91000
TP 2: 90900
TP 3: 90700
SL : 91525

Bullish Breakout Confirmed. Key Level Conquered: $91,000 (WeeklyAnalysis: The weekly close above $91k represents a confirmed change in market character. Sell-side liquidity has been absorbed. We have entered a "Blue Sky" environment where the next major structural resistance is the psychological $100,000 barrier.
The Setup:
Context: Momentum breakout into
XRP/USDAs per Wave analysis, XRP/USD is in correction, once completed, an strong impulse is expected.


See all crypto ideas
XAU/USD Bullish Continuation Setup Toward 4,223 After Liquidity 1. Market Structure
The chart highlights a COCH (Change of Character) followed by a BOS (Break of Structure), signaling a shift from bearish to bullish structure.
Several smaller coch points confirm internal bullish structure building.
2. Liquidity & POI Zones
There is a clear liquidity sweep ne

natural gas bearish setupnatural gas reaching resistance from the most recent swing which also happens to be bearish ob.
from last year we can expect a fall

XAUUSD - GOLD - Trying to catch TOP is like chasing your crush# Here are the key factors currently supporting gold:
Momentum remains bullish:
#GOLD has gained as markets increasingly price in a potential Federal Reserve interest rate cut.
Gold continues to be regarded as a safe-haven and hedge asset. Amid economic uncertainty, inflation concerns, geopoliti

GOLD EXPLOSION: READY TO CONQUER NEW HEIGHTS?I. HOT NEWS 💥
Gold is experiencing its 4th consecutive monthly increase, reaching $4,192.78/oz (closing on 11/28) thanks to significant changes from the Fed.
Interest Rate Reversal: Recent statements from the Fed Governor have increased the probability of a rate cut in December 2025 to 89% (up from

Gold Trading Strategy for 01st December 2025📈 GOLD Intraday Trading Plan
🟢 BUY Setup (Long Position)
Entry Trigger: Buy above the high of the 15-minute candle after a confirmed close above $4248.
Reasoning: A breakout above 4248 on a lower timeframe signals bullish momentum and continuation strength.
🎯 Targets for LONG
Target 1: $4260
Targe

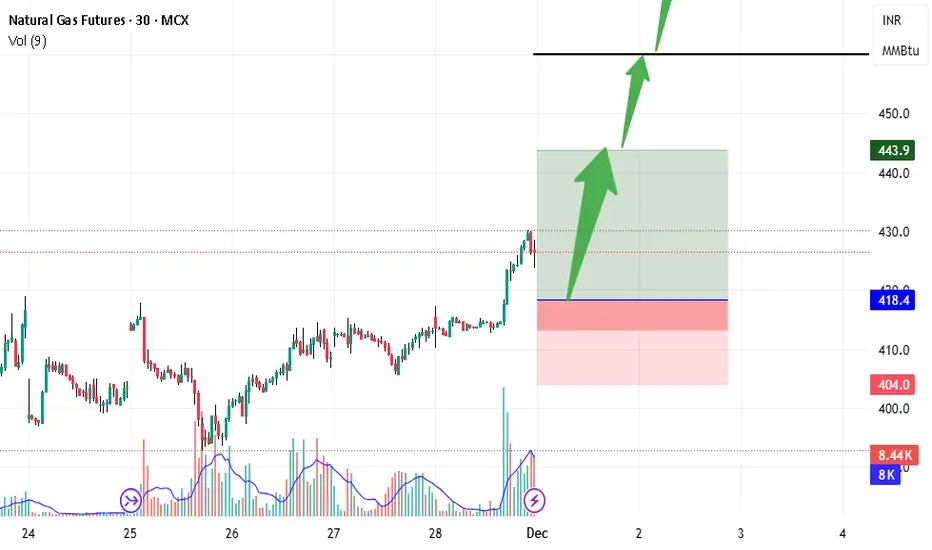
NATURAL GASVnatural gas december contract best one 418.50to 413 invalidation beloe 404 upside bias 444/460/477
XAUUSD is skyrocketing after the Adam & Eve pattern!OANDA:XAUUSD is really interesting right now. The price seems likely to rise further after the formation of the Adam & Eve pattern. With such an easy-to-remember name, the Adam & Eve pattern is one of the most memorable. Below, I’ll explain the reasons and how to easily recognize it.
The Adam pat

Silver last week we booked 10300 points profit & Gold 3800 pointParameters Data
Reason 🟩 Extreme Bullish Momentum due to: 1) Global Breakout above $56. 2) Physical Scarcity driving spot premiums. 3) Aggressive Safe-Haven Buying ahead of the Fed meeting.
Asset Name Silver MCX (Dec Futures) ₹1,71,850
Price Movement Buy side: 🟩 R1: ₹1,73,500, 🟩 R2: ₹1,75,000, 🟩 R

XAUUSD – LANA TRACKS MID-TERM WAVE 5 TOWARDS THE ATH ZONE AT ...XAUUSD – LANA TRACKS MID-TERM WAVE 5 TOWARDS THE ATH ZONE AT 4360
1. Fundamental Analysis
On the geopolitical front, President Putin has once again reiterated the conditions for a ceasefire between Russia and Ukraine. While the possibility of a peace agreement remains uncertain, his firm stance sug

XAUUSD Positional Long with SL#Gold Positional Trade Outlook
Gold is currently pulling back after a sharp rally, offering #positional traders an opportunity to build entries gradually with the target upto prev ATH or rejection. Price is approaching key demand zones, so follow a scaled stop-loss (SL) structure to manage risk eff

See all futures ideas
GU Weekly Analysis 01/12/2025 - 07/12/2025Namaste Everyone.
Analysing GU I'm seeing that -
1. We are in a weekly bearish fvg with respect to GU
2. We have SMT with DXY
This is giving me a bearish idea, its just an idea remember that, we don't trade mere interpretations of market, we look for our setup to present itself, so we'll wait.
This

CAD/CHF Short term Sell IdeaAs per wave analysis, CAD/CHF looks bearish for short term for an target of 0.56810

GBPJPY break&retest , bullish continuation set up GBPJPY remains strongly bullish, maintaining a clear sequence of higher highs and higher lows with price respecting the ascending trendline and repeatedly reacting to demand zones. After breaking above the 206.000–206.500 structure, price has pulled back into a high-confluence demand area formed by

EURUSD MULTI TIMEFRAME ANALYSIS Hello traders , here is the full multi time frame analysis for this pair, let me know in the comment section below if you have any questions , the entry will be taken only if all rules of the strategies will be satisfied. wait for more price action to develop before taking any position. I suggest yo

EURUSD Strong bullish continuation. Buy-side liquidity raided below range; smart money positioned long for markup into premium arrays. Increasing upside volume and reduced sell pressure above
CADJPY could keep rising furtherOANDA:CADJPY The market has been on a clear upward trajectory for some time, with each swing reaching higher peaks and forming higher lows. The rising trendline has been the driving force behind this momentum.
Following the recent surge, the price has pulled back slightly, forming a textbook bulli

GBP/USD Signals Trend Shift – Impulsive Upside ExpectedThe chart shows that GBP/USD has completed a full W–X–Y corrective pattern, with the final wave (y) and its C wave forming a clean bottom near the long-term support line. From that low, price has started a strong upward move, which looks like the beginning of a new impulsive Wave 1. The current pull


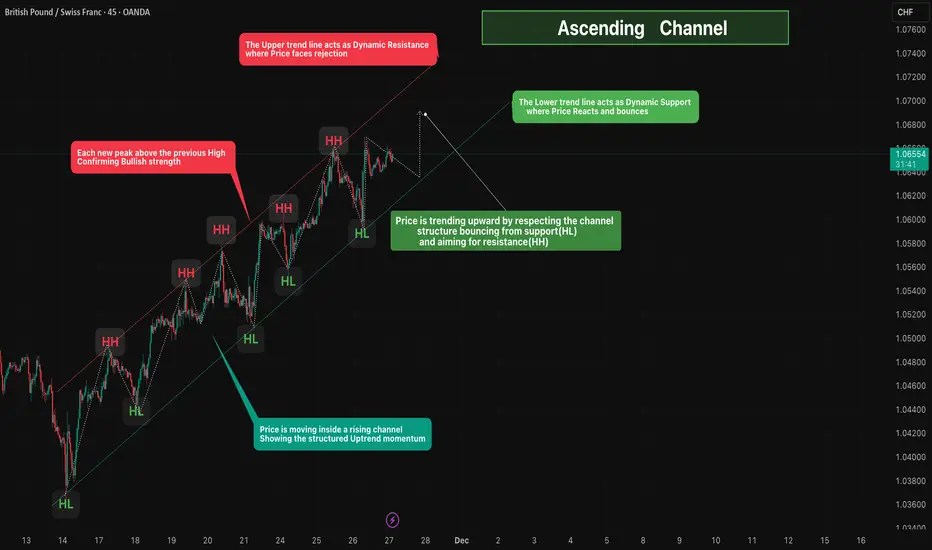
Ascending Channel🔎 Overview
Price is moving inside a well-defined Ascending Channel, showing a strong and structured uptrend.
The market continues to form Higher Highs (HH) and Higher Lows (HL), confirming consistent buying pressure.
The channel provides clear dynamic support and resistance, helping identify
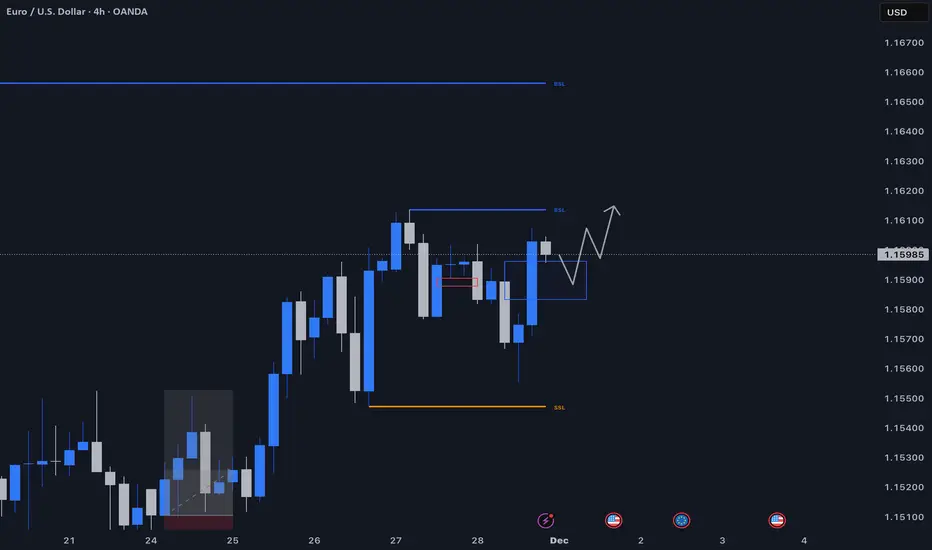
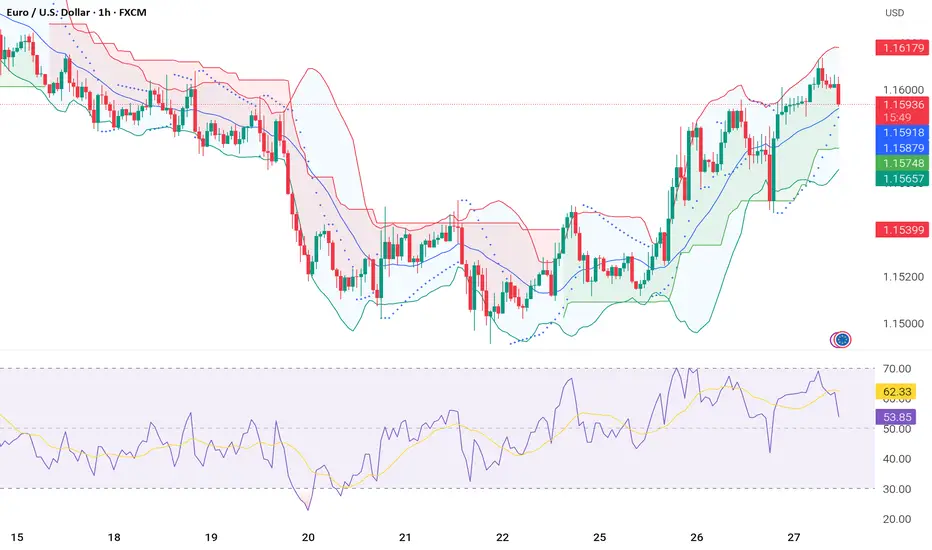
Eurusd technical Analysis EUR/USD is trading in a short-term bullish structure after bouncing from the mid-Bollinger band and holding above the intraday support zone at 1.1575–1.1565. Buyers pushed price toward the upper band, but the pair is now facing strong resistance at 1.1615–1.1620, where recent candles show rejection.
See all forex ideas
| - | - | - | - | - | - | - | - | ||
| - | - | - | - | - | - | - | - | ||
| - | - | - | - | - | - | - | - | ||
| - | - | - | - | - | - | - | - | ||
| - | - | - | - | - | - | - | - | ||
| - | - | - | - | - | - | - | - | ||
| - | - | - | - | - | - | - | - | ||
| - | - | - | - | - | - | - | - | ||
| - | - | - | - | - | - | - | - |
Trade directly on the supercharts through our supported, fully-verified and user-reviewed brokers.


