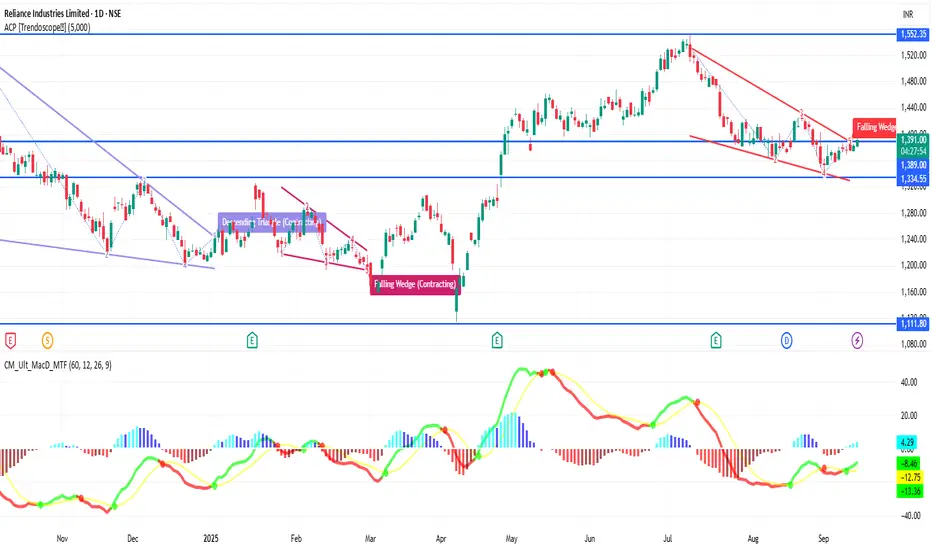
RELIANCE 1D Time frame🔢 Current Level
RELIANCE is trading around ₹1,391 – ₹1,392
🔑 Key Resistance & Support Levels
Resistance Zones:
₹1,392 – ₹1,396 (near-term resistance; breakout above this may lead to further upside)
₹1,400 (psychological resistance)
₹1,427 (stronger resistance above)
Support Zones:
₹1,380 – ₹

The best trades require research, then commitment.
Get started for free$0 forever, no credit card needed

Scott "Kidd" PoteetThe unlikely astronaut

Where the world does markets
Join 100 million traders and investors taking the future into their own hands.
Major indices
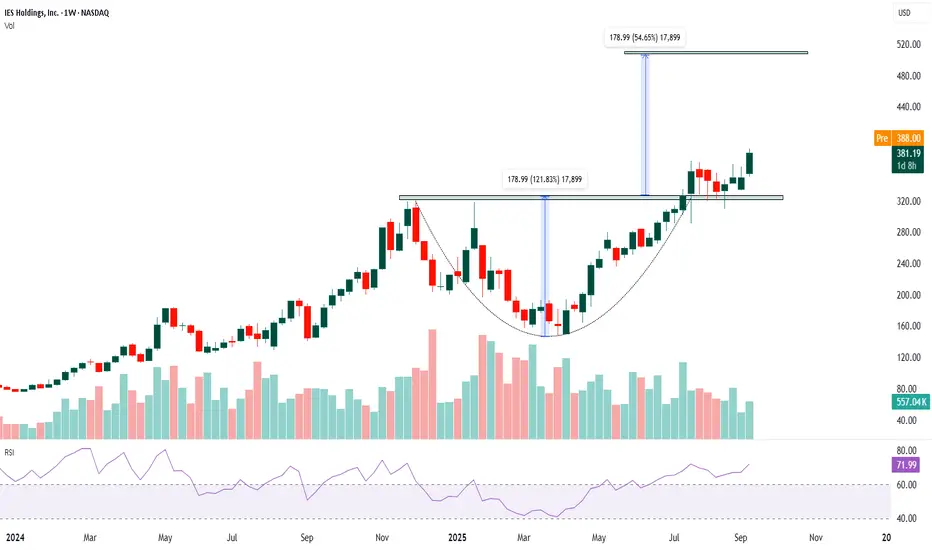
IESC- Long The chart shows a clear uptrend over the past year.
Price formed a rounded bottom (cup-shaped base) and has broken above the neckline near $320–$330, confirming a bullish continuation pattern. Current price around $381 indicates sustained bullish strength.
Volume rose meaningfully during the breakou
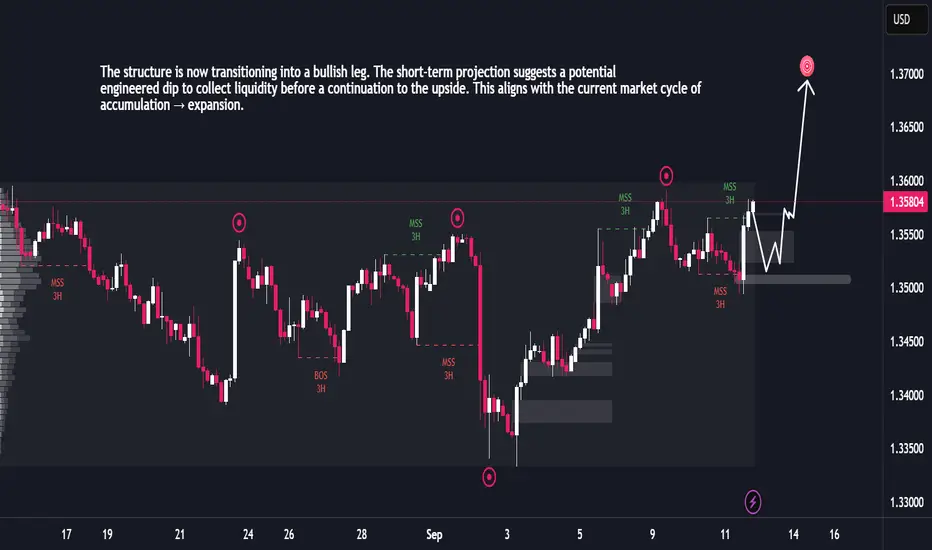
GBPUSD Ready for Expansion After Liquidity GrabThe market has been trading within a broad range, characterized by multiple liquidity grabs on both highs and lows. Each sweep has been followed by sharp reactions, confirming active smart money positioning. Recent price action shows a strong recovery after a downside liquidity sweep, indicating acc
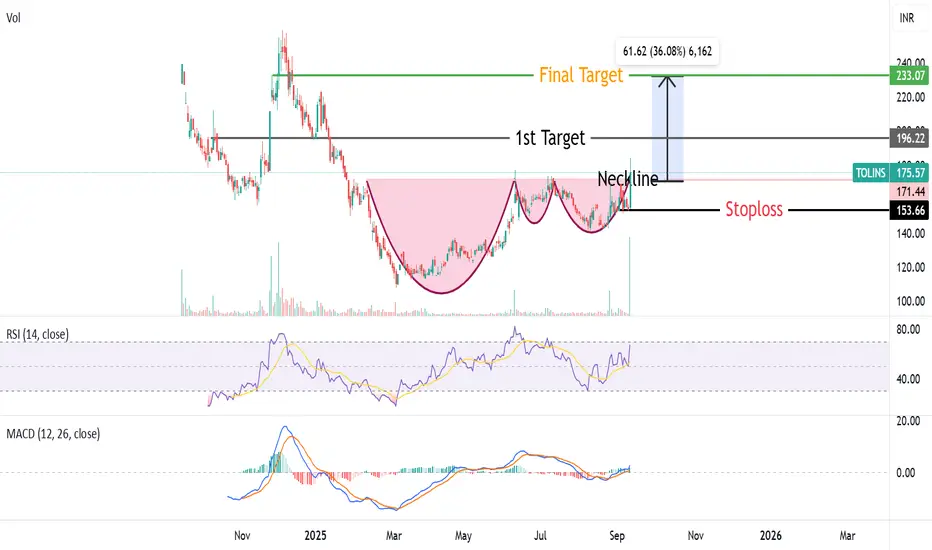
Complex Cup & Handle Pattern Breakout in TOLINS TyresTolins Tyres given Complex Cup & Handle Pattern Breakout from neckline arround 170 level. RSI & MACD also showing positive momentum ,Stock also trading above all important moving averages(50,10,200).Target of this breakout will be 230 Rs ,With a stoploss of 150Rs.
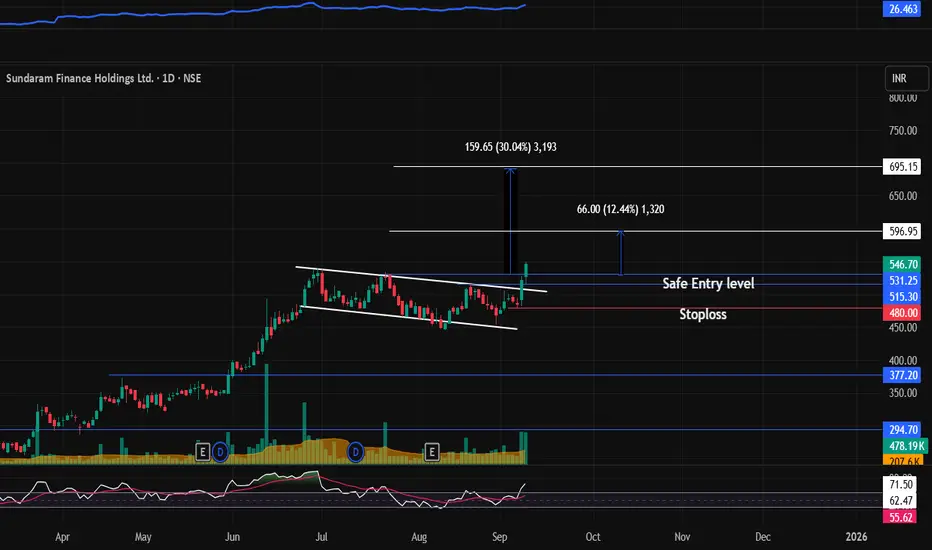
SUNDARMHLD : Breakout stock (Swing pick)#SUNDARMHLD #flagbreakout #breakoutstock #channelbreakout #swingtrading #momentumtrading
SUNDARMHLD : Swing / Short term (1-3 months)
>> Flag Breakout or Channel Breakout
>> Good Strength in stock
>> Volumes picking up
>> Low PE Stock
>> Swing Traders can Look for 10-12% Levels & Short term traders
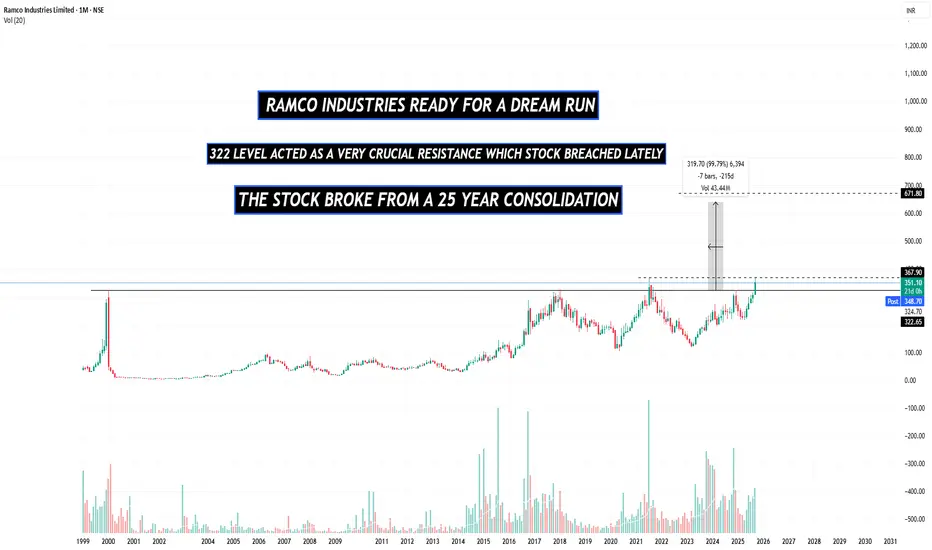
RAMCO INDUSTRIES NEAR MULTIYEAR BREAKOUTThe stock has not been able to breach the crucial resistance of 322 since 1999, pretty strange.
but now the the stock ha rallied past that level with good momentum enforcing further trust in the stock
The stock is also trading below it's book value of 488 again a pretty strange yet interesting op
The Power of Trendline Angles : My Full time trading ExperienceBreaking Down Three Critical Trendline Structures - A Complete Analysis
Structure 1: The Power of Steep Angles (Primary Focus)
The first structure showcases what I consider the gold standard of trendline breakouts. Notice how the trendline is significantly tilted/slanted rather than following a gra
Apollo Tyre - SMC AnalysisTechnical Analysis (SMC Method)
Even it is formed bullish choch and trendline breakout in the weekly timeframe, it has to break the crucial resistance zone in daily timeframe (between 488 & 500) for confirmation. Once it's broken in daily timeframe the estimate target price will be 535/540.
== ED

Finally the breakout is done or has it not?Stock has been in long consolidation phase with ibu and para prices making lower lows since over stocking post covid. With the new initiative taken by management and prudent cash allocation from covid times, the volumes speak of more than what the PAT showcases.
Technically on weekly charts on the f
Lupin LtdDate 08.09.2025
Lupin
Timeframe : Weekly Chart
Brands
(1) Lupin Life
(2) Lupin Diagnostics
(3) Life Atharv Ability
(4) SciFlix
(5) Humrahi
(6) Pharmarack
Leadership
(1) Respiratory
(2) Diabetes Care
(3) Cardiac Care
Lupin has partnered with Amman Pharma for exclusive marketing and
commercializ

See all editors' picks ideas
Volume by Time [LuxAlgo]The Volume by Time indicator collects volume data for every point in time over the day and displays the average volume of the specific dataset collected at each respective bar.
The indicator overlays the current volume and the historical average to allow for better comparisons.
🔶 USAGE
Thr

FlowScope [Hapharmonic]FlowScope: Uncover the Market's True Intent 🔬
Ever wished you could look inside the candles and see where the real action is happening? FlowScope is your microscope for the market's flow, designed to give you a powerful edge by revealing the volume distribution that price action alone can't sh

VWAP Price ChannelVWAP Price Channel cuts the crust off of a traditional price channel (Donchian Channel) by anchoring VWAPs at the highs and lows. By doing this, the flat levels, characteristic of traditional Donchian Channels, are no more!
Author's Note: This indicator is formed with no inherent use, and serves

Fibonacci Sequence Circles [BigBeluga]🔵 Overview
The Fibonacci Sequence Circles is a unique and visually intuitive indicator designed for the TradingView platform. It combines the principles of the Fibonacci sequence with geometric circles to help traders identify potential support and resistance levels, as well as price expansio

ATAI Volume Pressure Analyzer V 1.0 — Pure Up/DownATAI Volume Pressure Analyzer V 1.0 — Pure Up/Down
Overview
Volume is a foundational tool for understanding the supply–demand balance. Classic charts show only total volume and don’t tell us what portion came from buying (Up) versus selling (Down). The ATAI Volume Pressure Analyzer fills that g

Market Cap Landscape 3DHello, traders and creators! 👋
Market Cap Landscape 3D. This project is more than just a typical technical analysis tool; it's an exploration into what's possible when code meets artistry on the financial charts. It's a demonstration of how we can transcend flat, two-dimensional lines and step into

ZigzagLiteLibrary "ZigzagLite"
Lighter version of the Zigzag Library. Without indicators and sub-component divisions
method getPrices(pivots)
Gets the array of prices from array of Pivots
Namespace types: Pivot
Parameters:
pivots (Pivot ) : array array of Pivot objects
Returns: array array

ZigzagLibrary "Zigzag"
Zigzag related user defined types. Depends on DrawingTypes library for basic types
method tostring(this, sortKeys, sortOrder, includeKeys)
Converts ZigzagTypes/Pivot object to string representation
Namespace types: Pivot
Parameters:
this (Pivot) : ZigzagTypes/Pivot

Angled Volume Profile [Trendoscope]Volume profile is useful tool to understand the demand and supply zones on horizontal level. But, what if you want to measure the volume levels over trend line? In trending markets, the feature to measure volume over angled levels can be very useful for traders who use these measures. Here is an att

MathEasingFunctionsLibrary "MathEasingFunctions"
A collection of Easing functions.
Easing functions are commonly used for smoothing actions over time, They are used to smooth out the sharp edges
of a function and make it more pleasing to the eye, like for example the motion of a object through time.
Easing function

See all indicators and strategies
Community trends
RELIANCE 1D Time frame🔢 Current Level
RELIANCE is trading around ₹1,391 – ₹1,392
🔑 Key Resistance & Support Levels
Resistance Zones:
₹1,392 – ₹1,396 (near-term resistance; breakout above this may lead to further upside)
₹1,400 (psychological resistance)
₹1,427 (stronger resistance above)
Support Zones:
₹1,380 – ₹
My Trade Plan for BSE1. Trendline Breakout Attempt
• Price had been in a downtrend since May 2025, making lower highs and lower lows.
• A falling trendline (red) was respected multiple times.
• Recently, price broke above the trendline, showing a possible bullish reversal.
2. Support Zone
• Around 2,000–2,100

All negative news brushed aside is positiveITC Technical Analysis (CMP: 415)
Key Observations:
- Small corrections indicate strength, suggesting the uptrend remains intact.
-
- Fibonacci Analysis: The stock's reversal before the first support at 375 demonstrates buying interest and strength.
-
- RSI Analysis: The oscillator's decline to su

Complex Cup & Handle Pattern Breakout in TOLINS TyresTolins Tyres given Complex Cup & Handle Pattern Breakout from neckline arround 170 level. RSI & MACD also showing positive momentum ,Stock also trading above all important moving averages(50,10,200).Target of this breakout will be 230 Rs ,With a stoploss of 150Rs.
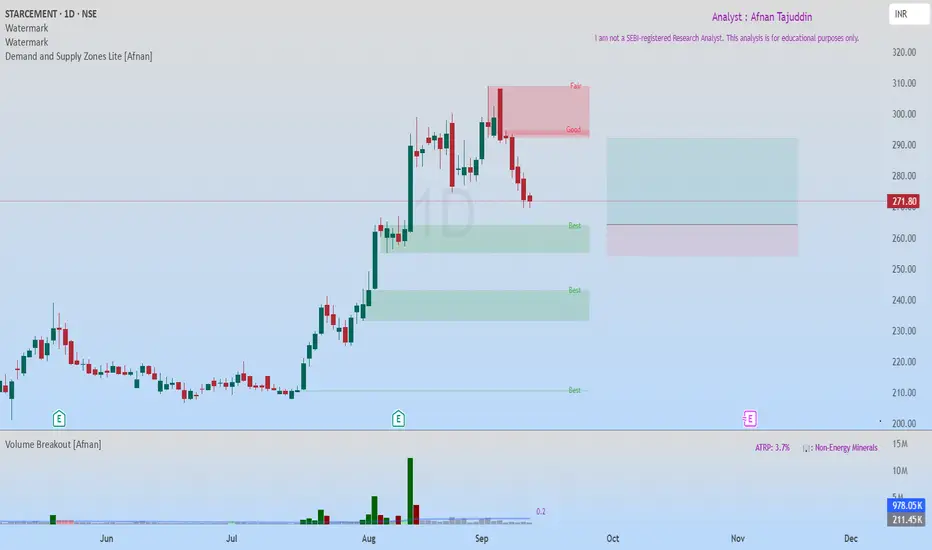
StarCement at Fresh Demand Zone – High Probability Bullish SetupStar Cement recently hit an all-time high and is now retracing towards a fresh Rally-Base-Rally (RBR) Demand Zone . This zone is of high quality, and the overall market structure remains strongly bullish. The best part? There’s no immediate supply zone until a potential 1:2 risk-to-reward target
HFCL out of dangerHFCL looks like it's out of danger of going down as it has spanned the two trendlines reversing the negative trend. Learned Wave Theory experts are saying that the 5th wave has started which should end in 200.

WAAREE ENERGIES READY FOR A BLASTWaaree Energies is India’s largest manufacturer and exporter of solar modules. As of FY24, they hold 21% share of the domestic market for solar modules and 44% share in India's solar module exports. Its installed capacity surged from 2GW in FY21 to 13.3GW by FY24.
The stock has a crucial resistance

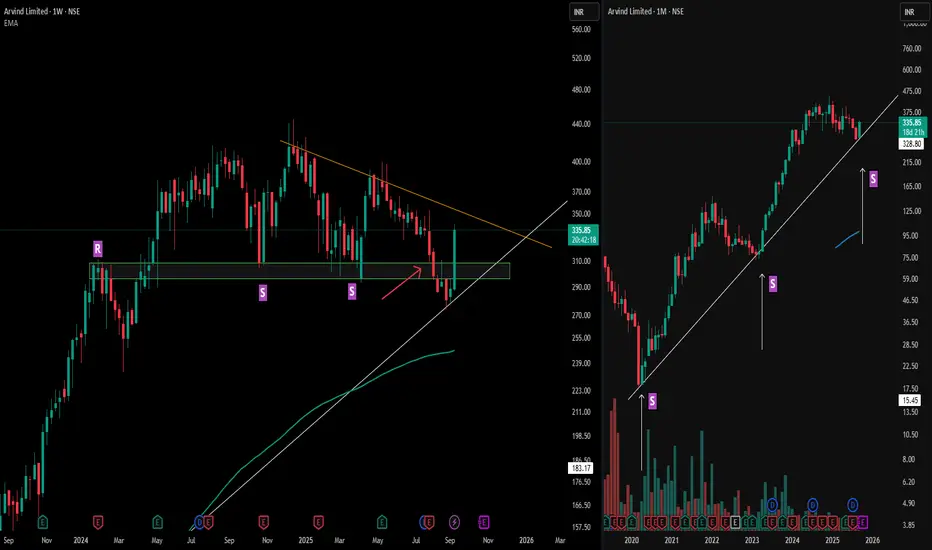
Arvind : Spotting Fake Breakdowns with Multi-Timeframe SupportArvind Limited highlights how a broader perspective can clarify deceptive price moves.
On the left (weekly), resistance ("R") flipped into support ("S") multiple times, with the orange counter trendline framing the recent structure. The red arrow marks a moment when weekly support appeared broken—a
Elliott Wave Analysis of Bharat Electronics BELThis is 15 15-minute chart. That means, wave (v) can be completed within a few days. The script is in wave (iv) on 15 min chart.

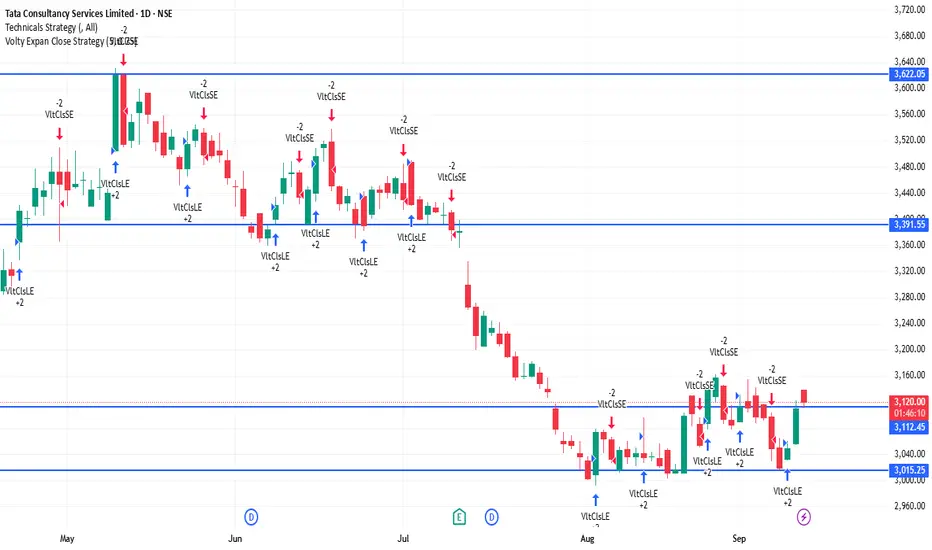
TCS 1D Time framePrice Action (Daily Chart)
Current price is around ₹3,117 - ₹3,120
Price is consolidating near support zones after a recent upward move.
Candle structure shows buying interest at lower levels, but resistance is capping the upside.
📊 Indicators
Moving Averages (MA):
Short-term MAs (5-day, 10-da
See all stocks ideas
No scheduled reports
Community trends
Bitcoin Bybit chart analysis September 11 (CPI)Hello
It's a Bitcoin Guide.
If you "follow"
You can receive real-time movement paths and comment notifications on major sections.
If my analysis was helpful,
Please click the booster button at the bottom.
This is Bitcoin's 30-minute chart.
The CPI indicator will be released shortly at 9:30 AM.
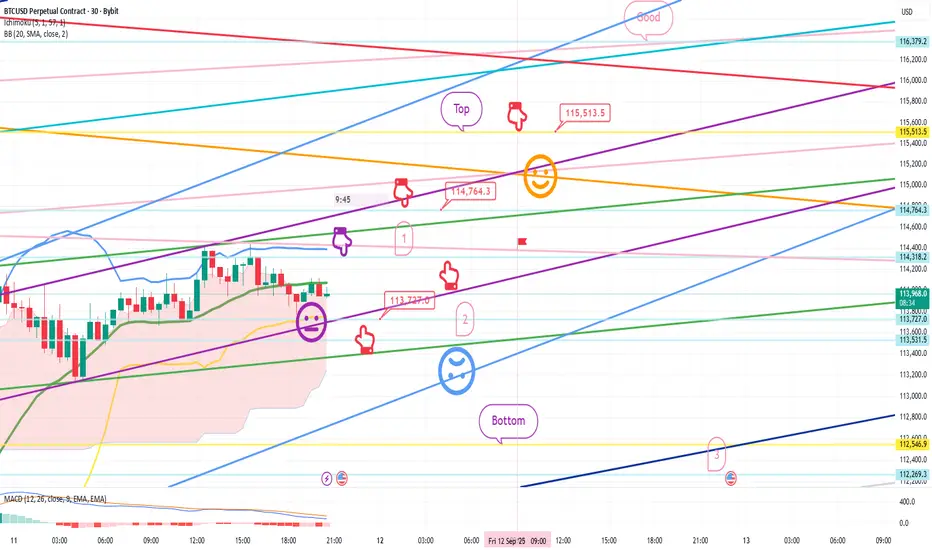
BTC/USD: Resistance in Play – Is a Pullback Coming?BTC/USD is facing a crucial test at the top of its ascending channel. As the price reaches this resistance zone, a pullback seems likely, with support at 113,500 USD acting as the next key level.
If the bulls manage to defend this support, we could see the uptrend resume, pushing BTC/USD to new hig

Bitcoin – Trend Update Ahead of PPIBitcoin – Trend Update Ahead of PPI
Hello Traders,
The current scenario for Bitcoin is unfolding in line with expectations, with the uptrend continuing to develop strongly. Price waves are moving with solid volume, and the overall structure is progressing exactly as anticipated.
Key Levels
Price

BTCUSDT Elliott Wave Analysis (2H Chart)Currently tracking a 5-wave Elliott structure:
Wave (1) initiated the bullish impulse.
Wave (2) retraced back with healthy correction.
Wave (3) extended strongly, showing momentum.
Wave (4) completed with a corrective pullback.
Wave (5) is in progress, approaching the liquidity zone between 117

Ethereum Liquidity Sweep Setup for Bullish Continuation📊 Market Analysis Report – ETHUSD
The market has been consolidating within a range after a strong impulsive move down, followed by a period of liquidity sweeps and corrective structure. Price action shows signs of engineered liquidity grabs both above and below recent highs and lows, which indicate

XAUUSD GOLD ANALYSIS ON (11/09/2025)#XAUUSD UPDATEDE
Current price - 3636
If price stay below 3660, then next target 3600,3680 and above that 3700
Plan;If price break 3640-3648 area, and stay below 3640, we will place sell order in gold with target of 3600 and 3580 & stop loss should be placed at 3660

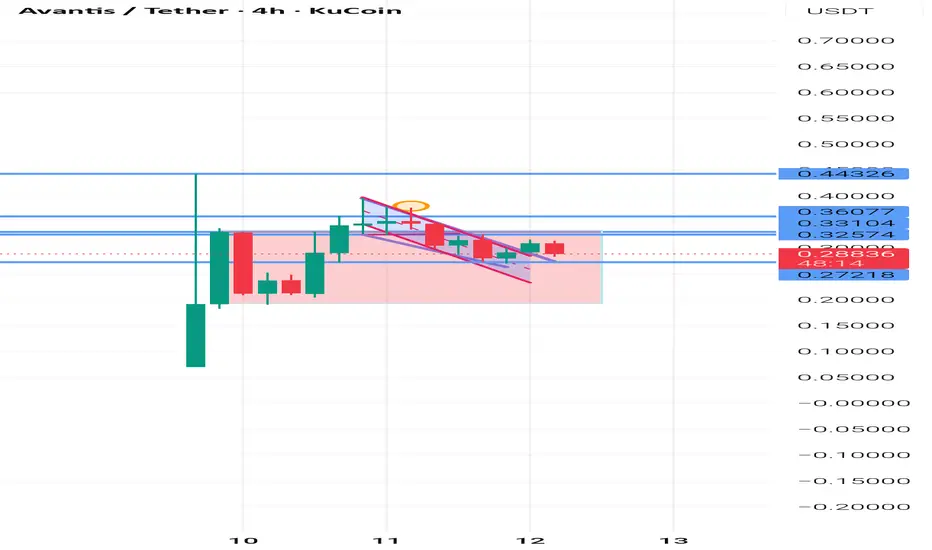
Avantis fi did a nice bullrun and ath is still pending Avantis fi did a nice bull run and looking for liquidity sweep near the 0.27 level and we moon
Expecting a nice ath pump form avantis fi
One of the bet on avantis fi can be done at 0.27 with small stop loss
Bitcoin (BTC/USD) Outlook – 4H ChartBitcoin is showing strong bullish structure while trading around $114,200, respecting its ascending channel and aiming higher.
🔎 Bullish Signals:
Ascending Channel:
Price is moving within a clear upward channel, signaling a steady uptrend.
Support Confirmation:
Strong demand zone holding around

DOGE LANDS ON WALL STREET | PipGuardDOGE LANDS ON WALL STREET | PipGuard
Hello there, my colleagues, welcome back!
Article published by PipGuard™ on the TradingView® platform – to continue this free publication, LEAVE A BOOST and a COMMENT, hit the notification bell, and never miss ANOTHER ANALYSIS.
ANALYSIS
🔥 DOGE LANDS ON

See all crypto ideas
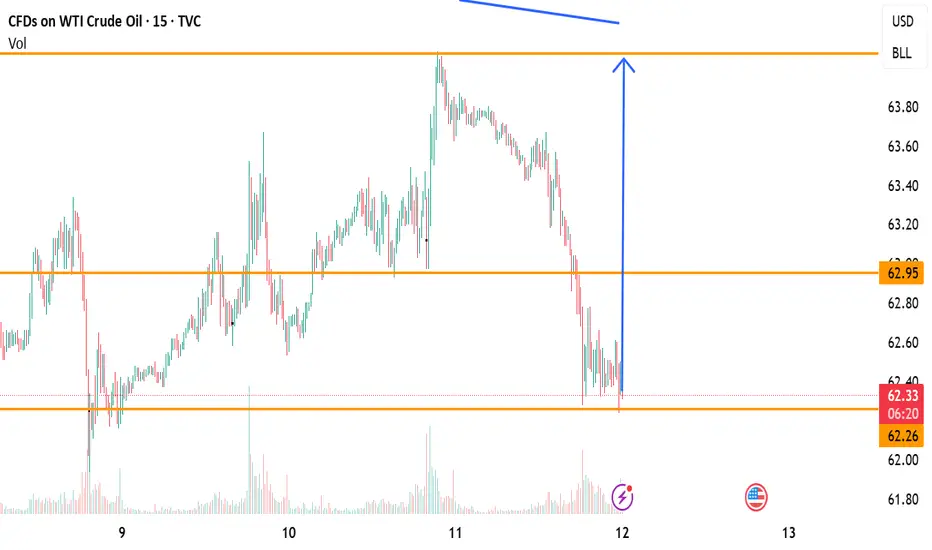
Buy Setup on 15-Min ChartCrude oil is currently holding above the key support near 62.26 and showing signs of reversal after a strong rejection from the lows.
📌 Entry Zone: 62.35 – 62.50
🎯 Target: 62.95
🛑 Stop Loss: 62.26
🔎 Analysis:
Price respected support and formed a bullish rejection wick, indicating buying pressure.
Bullish Silver is looking very very hot
Its bullish Flag making if silver sustain this week above 42.25$, then it comes to 49 superfast maybe next in two days only
There's no recommendations from my side
Only for learning purpose

XAUUSD – Will Gold Continue to Print New ATH ?XAUUSD – Will Gold Continue to Print New ATHs?
Hello Traders,
The Asian session today shows that buying interest in gold remains strong. A confirmed break above 3658 would mark a key resistance level and signal that gold could extend its bullish trend further.
Technical Outlook
The Fibonacci 2.6

XAU/USD | 1H | CPI Setup in PlayGold just swept the previous low around 3615 and is showing signs of accumulation. Liquidity below has been taken, and the market structure hints at a bullish delivery if CPI comes in line with expectations.
Key levels:
Demand Zone 3610–3620 where buyers stepped in
First Target 3650 area (mid sup

Gold Breaks Out: Rising Buying Power Amid USD WeaknessMarket Context:
The higher-than-expected Unemployment Claims data (263K vs 235K) has weakened the USD, providing favorable conditions for gold to rise. The University of Michigan Consumer Sentiment and Inflation Expectations remain stable, but they do not significantly impact gold’s trend.
XAUUSD

[MCX] Gold Short IdeaNote -
One of the best forms of Price Action is to not try to predict at all. Instead of that, ACT on the price. So, this chart tells at "where" to act in "what direction. Unless it triggers, like, let's say the candle doesn't break the level which says "Buy if it breaks", You should not buy at all.
Gold’s Surge – An Opportunity You Can’t Miss!Hello everyone, what are your thoughts on the OANDA:XAUUSD trend?
Yesterday, just as we predicted, gold had a strong surge! The precious metal skyrocketed from 3612 USD to 3653 USD, gaining over 400 pips in a short period of time.
So, what’s behind this move? The answer lies in the new unemploy

XAUUSD | FED leaning toward 50bps cut? | Buy strategy at support🟡 XAU/USD – 12/09 | Captain Vincent ⚓
🔎 Captain’s Log – Market Context
The probability of a FED -50bps cut next week has risen to 10.9% (from 8%), while a -25bps scenario is almost certain.
US jobless claims rose sharply → reflecting a weakening labor market, reinforcing expectations of FED e

Bulls Back in Action Next Stop 3700?Gold finally waking up after a quick nap and it’s breaking out of triangle it was stuck in. Eyes on 3650, the key level to watch. A strong higher-timeframe (H4 or daily) close above this level can open doors for the next leg up, with this week’s high around 3675 as the first target or higher 3700 fo

Gold 1H – CPI Liquidity Play Before ExpansionGold on the 1H timeframe is consolidating near 3,633 after multiple ChoCHs and engineered liquidity grabs. With today’s CPI release, price is expected to sweep both premium and discount liquidity zones. The structure suggests engineered spikes toward 3,688–3,691 or dips into 3,595–3,592 before expan

See all futures ideas
GBPUSD Ready for Expansion After Liquidity GrabThe market has been trading within a broad range, characterized by multiple liquidity grabs on both highs and lows. Each sweep has been followed by sharp reactions, confirming active smart money positioning. Recent price action shows a strong recovery after a downside liquidity sweep, indicating acc
Bearish Signal at BreakoutThe AUDCAD is on strong Buy side since the start of this month. Enough to be in overbought area.
The Channel / Rising wedge is confirming its strong buy on H1 timeframe.
Now we are waiting for the breakout of this Rising Wedge. Yet we will not trade unless it doesn't break its Lower High at 0.9

EURUSD | Buy & Sell Setup | 11 Sep 2025 – 09:20 IST EURUSD | Buy & Sell Setup | 10 Sep 2025 – 09:20 IST
Buy Zone: 1.17323 – 1.17159
Sell Zone: 1.16935 – 1.16665
Scenario : Buy
Entry: 1.17145
Stop Loss: 1.16887
Targets:
TP1 → 1.17801
TP2 → 1.17888
Analysis:
From Buy Zone (1.17323 – 1.17159) creates possibilities for a buy move.
Scenario 2 : Sell

USDJPY Sell entry 1::5 RnRUSDJPY is forming a beautiful day trade for selling side. It can be a very good intraday trade if everything goes as per plan.
1. Price kissed 4H Iceberg Block and showed sniper liquidity and left bearish FVGs at both 30m and 15m.
2. 15m FVG is inside 30m FVG and upper side of OTE area.
3. Now it i

BUY EURAUDTrade Idea: BUY EURAUD
The EURAUD pair is showing renewed bullish momentum as the Euro gains strength against the Australian Dollar. Market sentiment is tilted in favor of EUR, supported by stability in the Eurozone, while AUD is weighed down by softer risk appetite and commodity price pressures.

EUR/USD | 1H | Smart Money OutlookPrice has swept the previous low and is reacting from a key liquidity pocket. Structure remains intact for a potential bullish delivery. With CPI expected to print on the stronger side, we could see a favorable USD reaction — but the market is already pricing in the move, setting up EUR/USD for a li

GBPUSD(20250911)Today's AnalysisMarket News:
The U.S. PPI annual rate for August hit 2.6%, the lowest since June. Traders are increasing bets on a Federal Reserve rate cut.
Technical Analysis:
Today's buy/sell levels:
1.3533
Support and resistance levels:
1.3584
1.3565
1.3553
1.3514
1.3502
1.3483
Trading Strategy:
If the pr

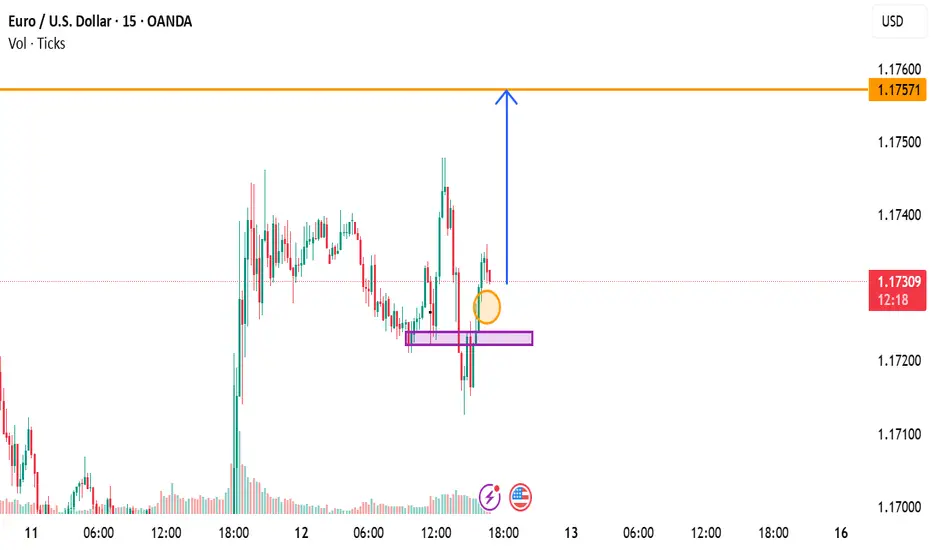
EURUSD Buy SetupPrice has successfully retested a key support zone (marked in purple) and is showing strong bullish momentum on the 15-minute chart. This retest confirms buyers are stepping back in.
📌 Entry: 1.1732
📌 Target: 1.17798
This setup offers a favorable risk-to-reward ratio, aiming for a clean move back
NZDUSD - Sell Setup Idea 📌 Pair: NZDUSD
📅 Timeframes Used: Daily + 1H
---
🔹 Higher Timeframe Context
Daily Trend: Bearish → Market is aligned with sellers, giving us downside bias.
1H Trend: Currently bullish → This looks like a retracement against the bigger bearish move.
---
🔹 Key Liquidity & Supply Zone
Price r

EUROUSD - LongIn this 30-minute chart of EUR/USD where we can see a hammer candle forming exactly at a key support level. A hammer candle indicates that sellers tried to push the price down but buyers came in strongly and managed to close the candle near the opening level. This shows buying interest at the suppor

See all forex ideas
| - | - | - | - | - | - | - | - | ||
| - | - | - | - | - | - | - | - | ||
| - | - | - | - | - | - | - | - | ||
| - | - | - | - | - | - | - | - | ||
| - | - | - | - | - | - | - | - | ||
| - | - | - | - | - | - | - | - | ||
| - | - | - | - | - | - | - | - | ||
| - | - | - | - | - | - | - | - | ||
| - | - | - | - | - | - | - | - |
Trade directly on the supercharts through our supported, fully-verified and user-reviewed brokers.


