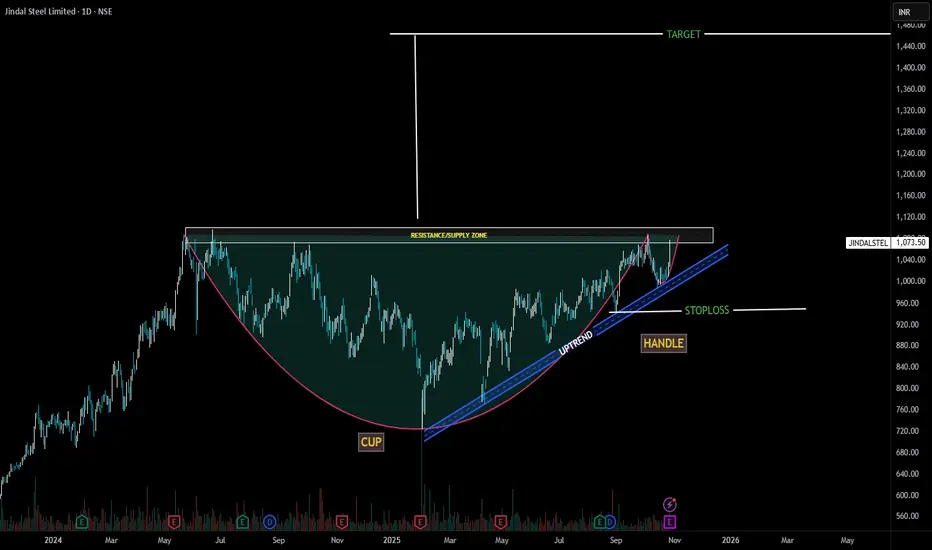
JINDAL STEEL LIMITEDCup Formation:
The left side shows a clear decline followed by a rounded bottom and a steady recovery forming a "U" shape — ✅ valid cup structure.
Volume tends to decrease during the cup and increase on the right side — which seems consistent here.
Handle Formation:
The handle is shorter in dura

The best trades require research, then commitment.
Get started for free$0 forever, no credit card needed

Scott "Kidd" PoteetThe unlikely astronaut

Where the world does markets
Join 100 million traders and investors taking the future into their own hands.
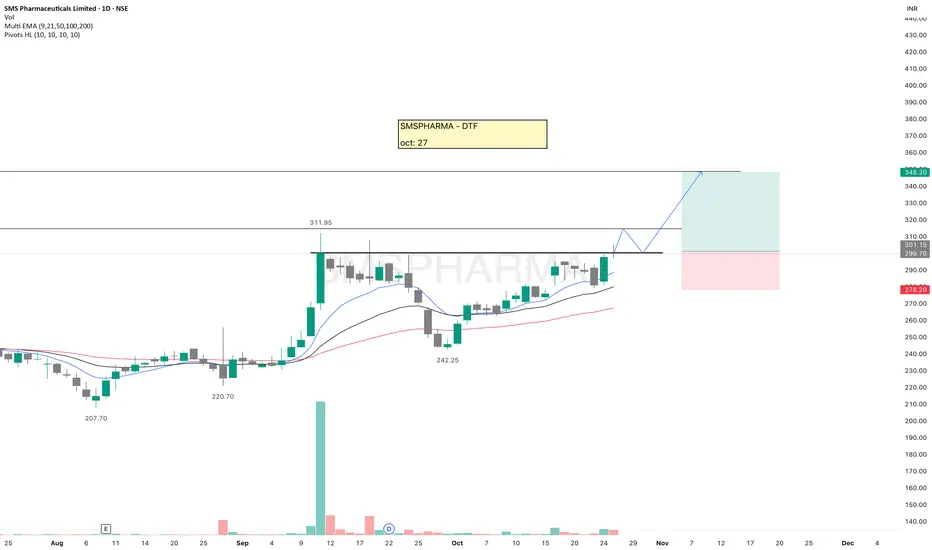
SMSPHARMASMSPHARMA is looking strong and forming a bullish structure. A breakout from the current level can lead to a good upside move.
Even while paper trading, always use a stop-loss, it builds the right trading habit.
Keep this stock on your watchlist.
✅ If you like my analysis, please follow me here
BANCOINDIA Testing Powerful Demand Zone + Breakout Retest 🧠 Understanding the Smart Money Footprints 🧠
Demand and supply zones are not just colorful boxes on a chart — they represent the footprints of smart money . When institutions buy, they don’t enter all their orders at once like retail traders do. Instead, they accumulate positions in parts — leavi

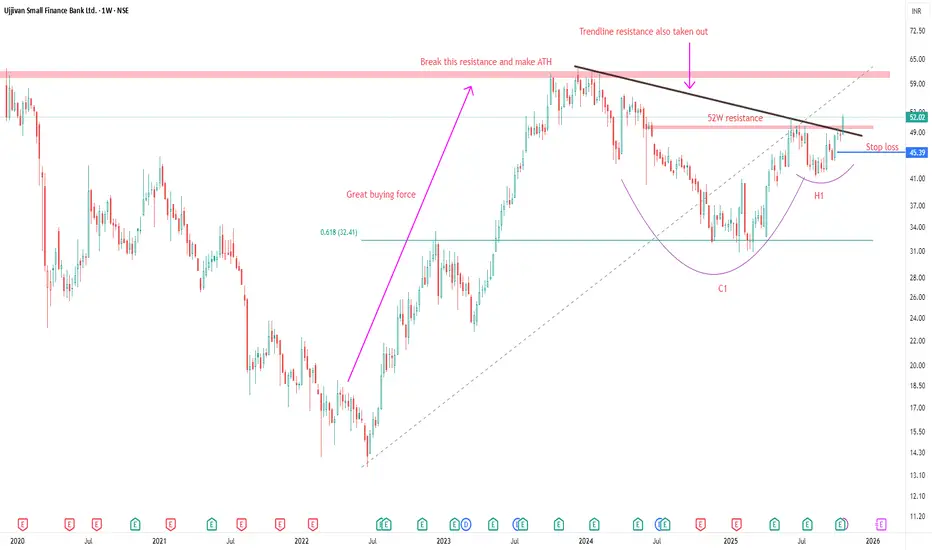
UJJIVAN SMALL FINANCE BANK ANALYSISTHIS IS MY CHART OF THE WEEK PICK
FOR LEARNING PURPOSE
UJJIVAN SMALL FINANCE BANK LTD- The current price of UJJIVAN is 52.02 rupees
I am going to buy this stock because of the reasons as follows-
1. It made a 52W high by breaking avery strong resistance and volume is good too.
Nifty Price Action Analysis for Nov 202525-Oct-25:
Nifty broke 25500 resistance with good volume on 15th Oct.
CMP is 25795 as on 24th Oct.
For November series Nifty is likely to take pullback support at 25400-25600 levels then at 25100 levels.
Major uptrend support lies at 24600 levels for another attempt for lifetime high

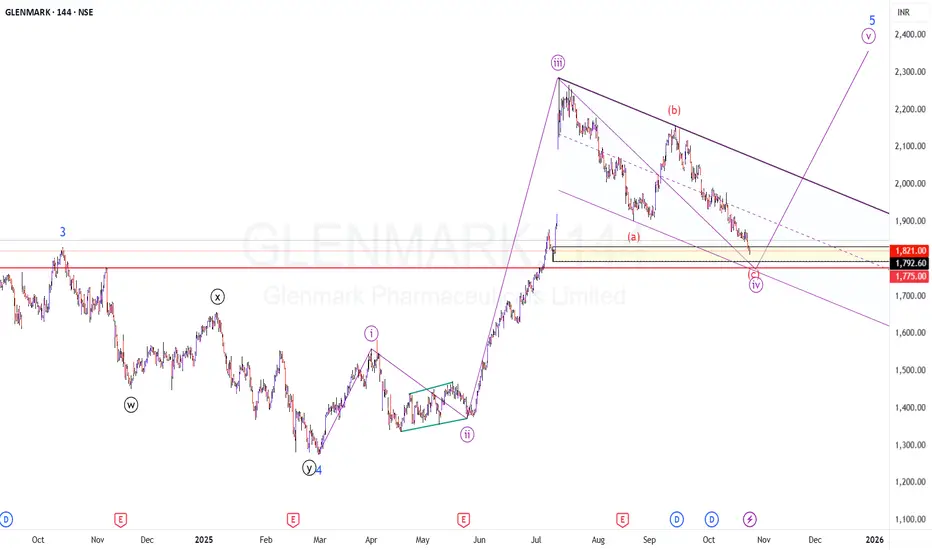
GLENMARK - Time for ATH?CMP: 1821
TFL 144 Minutes
Observation:
The script has been in bullish trend since March 2020 (Covid Lows) and is in the final leg of the impulse structure.
This view is considered from Feb-2025 lows (1275.5) for the 5th wave.
The counts are marked in the chart.
In a nutshell, price is about t
XAUUSDLast day was consolidating and has generated sell side liquidity. There could be possibility the price sweeps that liquidity and then reverse from the Marked Demand zone.
We have Imbalace left in 15M
We have Equal lows. Srong liquidity pool.
Below Eq low we have Demand zone.

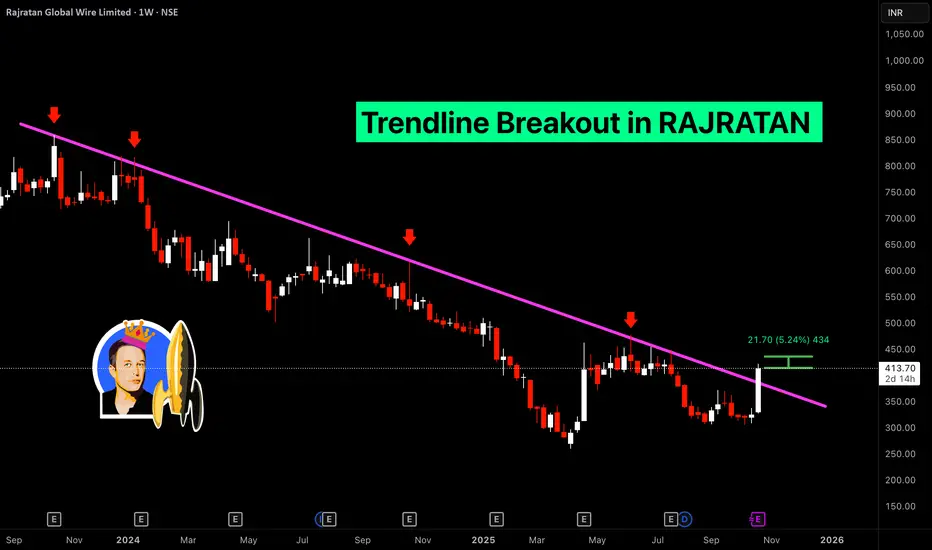
Sona BLW Precision Forgings Ltd. - Weekly chart analysis Trend: Stock is in a long-term downtrend (since late 2024).
Recent Action: Strong bullish candle with high volume, challenging/breaking the downtrend line.
Key Levels:
Resistance: Initial resistance near ₹510-₹520.
Support: Immediate support near the trendline (if it holds) and major support aro

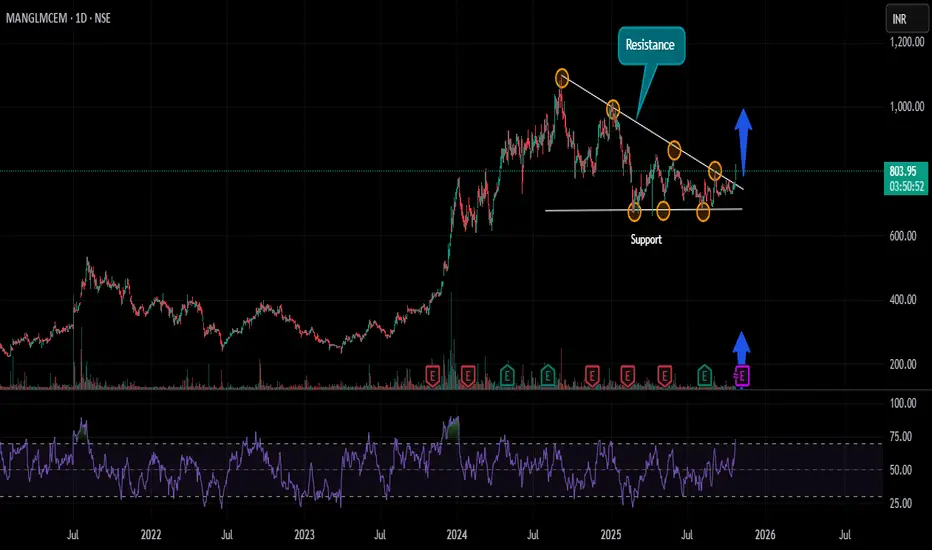
MANGALAM CEMENT : DECENDING TRAINGLE BREAKOUT The stock of Mangalam Cement is consolidating from Sept 2024 , taking support at 680 multiple times with decending traingle formation . On 23 Oct , the stock came out of this consolidation with good volume.
If the stock stays above 760 , move towards 880 and 1000 is possible in near term.
The RSI
BUY TODAY SELL TOMORROW for 5% DON’T HAVE TIME TO MANAGE YOUR TRADES?
- Take BTST trades at 3:25 pm every day
- Try to exit by taking 4-7% profit of each trade
- SL can also be maintained as closing below the low of the breakout candle
Now, why do I prefer BTST over swing trades? The primary reason is that I have observed t
See all editors' picks ideas
Range Oscillator (Zeiierman)█ Overview
Range Oscillator (Zeiierman) is a dynamic market oscillator designed to visualize how far the price is trading relative to its equilibrium range. Instead of relying on traditional overbought/oversold thresholds, it uses adaptive range detection and heatmap coloring to reveal where pri

Volume Surprise [LuxAlgo]The Volume Surprise tool displays the trading volume alongside the expected volume at that time, allowing users to spot unexpected trading activity on the chart easily.
The tool includes an extrapolation of the estimated volume for future periods, allowing forecasting future trading activity.
🔶 U

Smooth Theil-SenI wanted to build a Theil-Sen estimator that could run on more than one bar and produce smoother output than the standard implementation. Theil-Sen regression is a non-parametric method that calculates the median slope between all pairs of points in your dataset, which makes it extremely robust to o

Fair Value Gaps by DGTFair Value Gaps
A refined, multi-timeframe Fair Value Gap (FVG) detection tool that brings institutional imbalance zones to life directly on your chart.
Designed for precision, it visualizes how price delivers into inefficiencies across chart, higher, and lower (intrabar) timeframes — offering a fl

TASC 2025.11 The Points and Line Chart█ OVERVIEW
This script implements the Points and Line Chart described by Mohamed Ashraf Mahfouz and Mohamed Meregy in the November 2025 edition of the TASC Traders' Tips , "Efficient Display of Irregular Time Series”. This novel chart type interprets regular time series chart data to create an ir

Simplified Percentile ClusteringSimplified Percentile Clustering (SPC) is a clustering system for trend regime analysis.
Instead of relying on heavy iterative algorithms such as k-means, SPC takes a deterministic approach: it uses percentiles and running averages to form cluster centers directly from the data, producing smoo

Adaptive Volume Delta Map---
📊 Adaptive Volume Delta Map (AVDM)
What is Adaptive Volume Delta Map (AVDM)?
The Adaptive Volume Delta Map (AVDM) is a smart, multi-timeframe indicator that visualizes buy and sell volume imbalances directly on the chart.
It adapts automatically to the best available data resolution

Dynamic Equity Allocation Model"Cash is Trash"? Not Always. Here's Why Science Beats Guesswork.
Every retail trader knows the frustration: you draw support and resistance lines, you spot patterns, you follow market gurus on social media—and still, when the next bear market hits, your portfolio bleeds red. Meanwhile, institution

First Passage Time - Distribution AnalysisThe First Passage Time (FPT) Distribution Analysis indicator is a sophisticated probabilistic tool that answers one of the most critical questions in trading: "How long will it take for price to reach my target, and what are the odds of getting there first?"
Unlike traditional technical indicators

PongExperience PONG! The classic arcade game, now on your charts!
With this indicator, you can finally achieve your lifelong dream of beating the Markets. . . at PONG!
Pong is jam-packed with features! Such as:
2 Paddles
A moving dot
Floating numbers
The idea of a net
This indicator is solel

See all indicators and strategies
Community trends
J Kumar Infraprojects LtdDate 29.10.2025
J Kumar Infraprojects
Timeframe : Weekly
About
(1) Engaged in the business of execution of contracts of various infrastructure projects
(2) Including Transportation Engineering, Irrigation Projects, Civil Construction and Piling Work
(3) It is amongst the top 5 EPC players elig

JINDAL STEEL LIMITEDCup Formation:
The left side shows a clear decline followed by a rounded bottom and a steady recovery forming a "U" shape — ✅ valid cup structure.
Volume tends to decrease during the cup and increase on the right side — which seems consistent here.
Handle Formation:
The handle is shorter in dura
CARTRADE Price ActionTIme to pyramid
CarTrade Tech Limited’s stock has delivered a strong performance as of late August 2025, trading close to ₹824 after rallying more than 40% in the past three months and reaching a new 52-week high. The surge is largely attributed to robust quarterly results, improved profit margins,

AMBER - cup and handle patternAMBER - cup and handle pattern
Key resistance zone: ₹8,500–₹8,550 (currently being tested)
Target zone: ₹9,850–₹10,000
The cup formed from the Feb–Jun period (rounded bottom, higher lows).
The handle formed from Aug–Oct as a mild consolidation (sideways flag/pullback).
Breakout appears to be happ

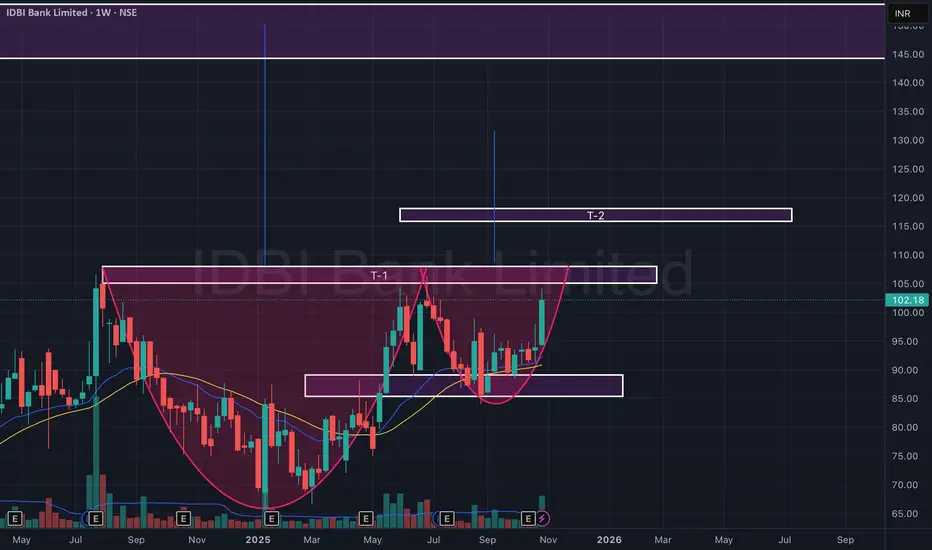
IDBI BANK FORMING CUP AND HANDLE PATTERN ON WEEKLY BASIS IDBI Bank on the weekly timeframe is showing a strong Cup & Handle formation, indicating a potential medium-term trend reversal. The stock has been consolidating since mid-2024, forming a rounded cup base near ₹72–75, suggesting steady accumulation. It later created a handle retracement around ₹85–8
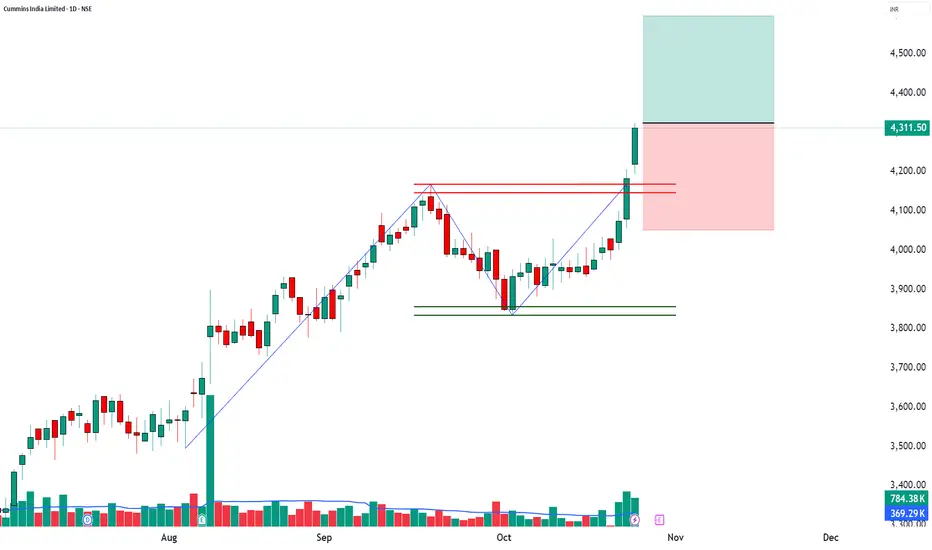
CUMMINSIND | 52-Week Breakout + Volume Expansion📈 CUMMINSIND | 52-Week Breakout + Volume Expansion + Institutional Momentum 🚀
🔹 Entry Zone: ₹4,311.50 – ₹4,324.00
🔹 Stop Loss: ₹4,051.05 (Risk ~273 pts)
🔹 Supports: 4,230 / 4,148.5 / 4,101.5
🔹 Resistances: 4,358.5 / 4,405.5 / 4,487
🔹 Swing Demand Zone: ₹4,096.70 – ₹4,060.10
🔹 Intraday Demand Zone: ₹
SMSPHARMASMSPHARMA is looking strong and forming a bullish structure. A breakout from the current level can lead to a good upside move.
Even while paper trading, always use a stop-loss, it builds the right trading habit.
Keep this stock on your watchlist.
✅ If you like my analysis, please follow me here
Policy Bazaar Cmp 1686 Double bottom @ support LinePolicy Bazaar Cmp 1686 dated 24-10-2025
1. Double bottom @ support Line
2. Price Rise with Volume
Buy above 1690 SL 1630 target 1705-1720-1735-
1755-1770-1780-1790-1805
It is just a view, please trade at your own risk.

BUY TODAY SELL TOMORROW for 5%DON’T HAVE TIME TO MANAGE YOUR TRADES?
- Take BTST trades at 3:25 pm every day
- Try to exit by taking 4-7% profit of each trade
- SL can also be maintained as closing below the low of the breakout candle
Now, why do I prefer BTST over swing trades? The primary reason is that I have observed that

Supply-Demand Squeeze: Symmetrical Triangle at the Flip zoneWitness a textbook supply-demand play on the monthly chart of Bharat Wire Ropes Ltd. as price contracts above a major zone conversion! The chart highlights a high-probability symmetrical triangle pattern—marked with a red counter trendline (lower highs) and a green trendline (higher lows).
This pow

See all stocks ideas
Today
BLUEDARTBlue Dart Express Limited
Actual
25.64
INR
Estimate
25.65
INR
Today
CREDITACCCreditAccess Grameen Ltd.
Actual
7.90
INR
Estimate
5.53
INR
Today
KIRLPNUKirloskar Pneumatic Co. Ltd.
Actual
6.70
INR
Estimate
6.70
INR
Today
CAMSComputer Age Management Services Ltd
Actual
23.10
INR
Estimate
23.10
INR
Today
SAMHISamhi Hotels Limited
Actual
—
Estimate
—
Today
STARHEALTHStar Health & Allied Insurance Co. Ltd.
Actual
0.93
INR
Estimate
1.90
INR
Today
ICRAICRA Limited
Actual
—
Estimate
—
Today
PREMIERENEPremier Energies Limited
Actual
7.50
INR
Estimate
9.63
INR
See more events
Community trends
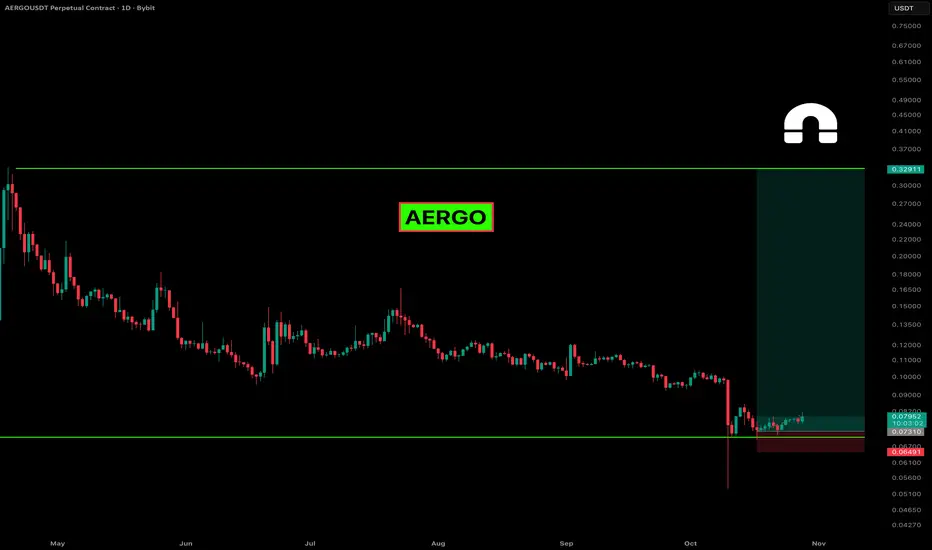
AERGO – Accumulating Near Multi-Month Support ZoneAERGO has been drifting lower for months, but price action seems to be stabilizing near a solid historical support zone around the $0.06–$0.07 range. After a sharp selloff earlier in October, the chart now shows early signs of accumulation — a small series of higher lows and tightening candles right
BTCUSD - RESISTANCE RETEST IN PROGRESSSymbol - BTCUSD
Bitcoin continues to consolidate beneath the previously breached ascending trendline, with no distinct signs indicating the end of the corrective phase or the emergence of strong bullish momentum. A retest of the resistance zone is currently forming.
Bitcoin is trading within a def

Bitcoin Bybit chart analysis October 28Hello
It's a Bitcoin Guide.
If you "follow"
You can receive real-time movement paths and comment notifications on major sections.
If my analysis was helpful,
Please click the booster button at the bottom.
This is Bitcoin's 30-minute chart.
There's a Nasdaq indicator release coming up at 11:00 A

THE ENTIRE MARKET IS ABOUT TO HARD DUMPTHE ENTIRE MARKET IS ABOUT TO HARD DUMP
If #Bitcoin holds the $107K–$104K support: next stop $150K 🚀
But if it fails… prepare for a hard dump toward the $80K zone 😳
This is the make-or-break level.
NFA & DYOR

SOL/USDT (1H timeframe)...SOL/USDT (1H timeframe):
Here’s a clear technical breakdown 👇
🧭 Chart Overview:
Current price: around $200.40
Trend: Uptrend, but showing short-term pullback
Support area: $190 – $195
Resistance area: $205 – $210
🔍 Key Observations:
The ascending trendline is acting as dynamic support.
Pri

Corrective Rise Up | Daily chartBitcoin seems to be forming a diametric pattern and we've entered Wave F
Wave F itself will be a corrective leg and is related in price to Wave B.
Long positions could be taken on dips.
The move will be invalidated below 103,500

COAIUSDT TECHNICAL ANALYSIS
$COAI Alert: Bottom Fishing Time!
SUPPORT I BROKEN NOW AS A RESISTANCE
Disclaimer
High Risk Investment
Trading or investing in assets like crypto, equity, or commodities carries high risk and may not suit all investors.
Analysis on this channel uses recent technical data and market sent

ZEC MARKET UPDATE💎 ZEC/USDT Analysis – 4H Chart
Zcash is trading inside a well-defined ascending channel, maintaining a sequence of higher highs and higher lows.
Price is currently consolidating near the mid-zone of the channel after facing resistance around $330–$340.
🔍 Market Structure:
• The overall trend rema

$TRX is forming a classic Head & Shoulders pattern on the 1-hourCRYPTOCAP:TRX is forming a classic Head & Shoulders pattern on the 1-hour timeframe — a structure often hinting at a trend reversal from bullish to bearish momentum.
🔹Left Shoulder: Formed near 0.3005, showing the first local top.
🔸Head: Peaked around 0.3030, marking the highest point of the curr

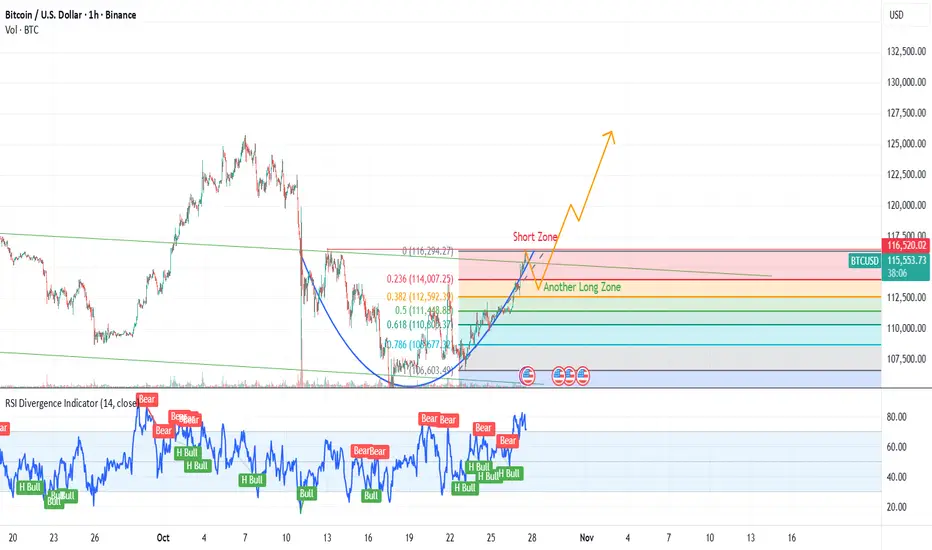
BTC Cup and Handle on 4h to 1H TF Opportunity for Swing Trade Short and Long
Long will form around 0.382 FIB | Around 113800 - 900
See all crypto ideas
Silver Futures (MCX) 4-hour chart Silver Futures (MCX) 4-hour chart, and my marked a resistance zone and a downward breakout below the Ichimoku cloud and key support.
Here’s what I can interpret:
Price broke below the Ichimoku cloud, confirming a bearish trend.
There’s a clear resistance area around ₹151,000–₹153,000.
The break

Gold at Key Support — Will XAUUSD Bounce From 3900 - 3895?Gold is testing a crucial demand zone at 3900–3895, where buyers have previously stepped in.
If this level continues to hold, we could see a bullish intraday rebound play out.
📊 Trade Setup
Buy Zone: 3900 – 3895
Stop Loss: 3878
Target 1: 3924
Target 2: 3936
💡 Technical Outlook
Price action is hi

GOLD - ENTERS COREECTION PHASESymbol - XAUUSD
Gold is currently undergoing a corrective phase following approximately six weeks of aggressive upward movement. Price action is forming a consolidation range while continuing to pressure the support zone.
The recent record breaking rally became overheated, prompting profit-taking

Gold Under Pressure: Critical Support Lost, 4040 Reclaim Needed Yesterday's session provided clear confirmation of the bearish pressure building in gold as price faced strong resistance around the CPR area between 4094-4108. The early Asian session rejection was particularly telling, as buyers simply couldn't get enough strength to push through this zone. What f

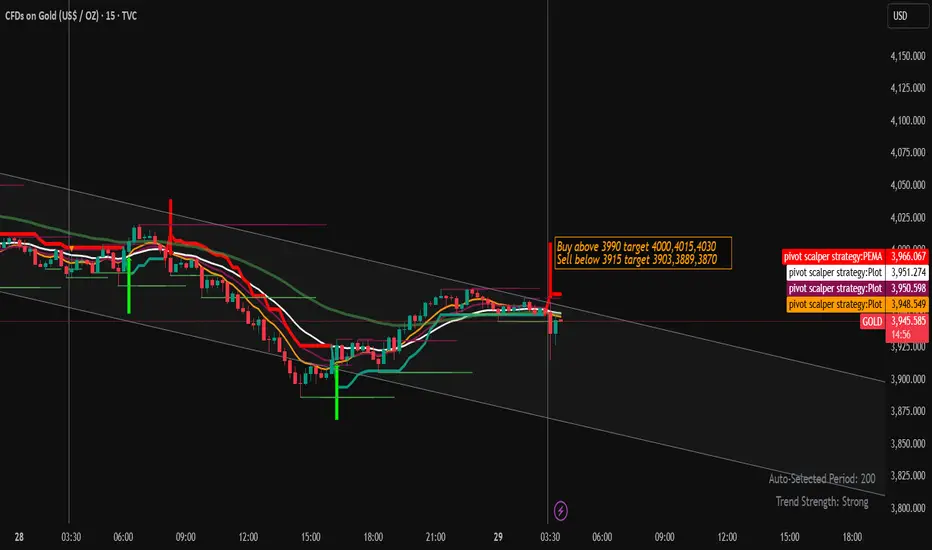
Gold Trading Strategy for 29th October 2025 (IST)🪙 TVC:GOLD Intraday Trading Plan
📈 Buy Setup:
🔹 Entry: Above the high of 15-min candle (Close > $3990)
🎯 Targets: $4000, $4015, $4030
🛑 Stop Loss: Below $3975 (or below candle low for confirmation)
📉 Sell Setup:
🔹 Entry: Below the low of 15-min candle (Close < $3915)
🎯 Targets: $3903, $3889
XAUUSD/GOLD 1H SELL LIMIT PROJECTION 28.10.251H Sell Limit Projection Chart for XAU/USD (Gold):
📝 Chart Summary (28.10.25)
Timeframe: 1 Hour
Setup Type: Sell Limit Projection
Market Structure: Bearish
📈 Key Levels:
Sell Limit Zone (Entry Area): Around $3,958 (Resistance R1)
Stop Loss: Around $3,982 (Top of FVG + Trendline)
Target 1 (TP

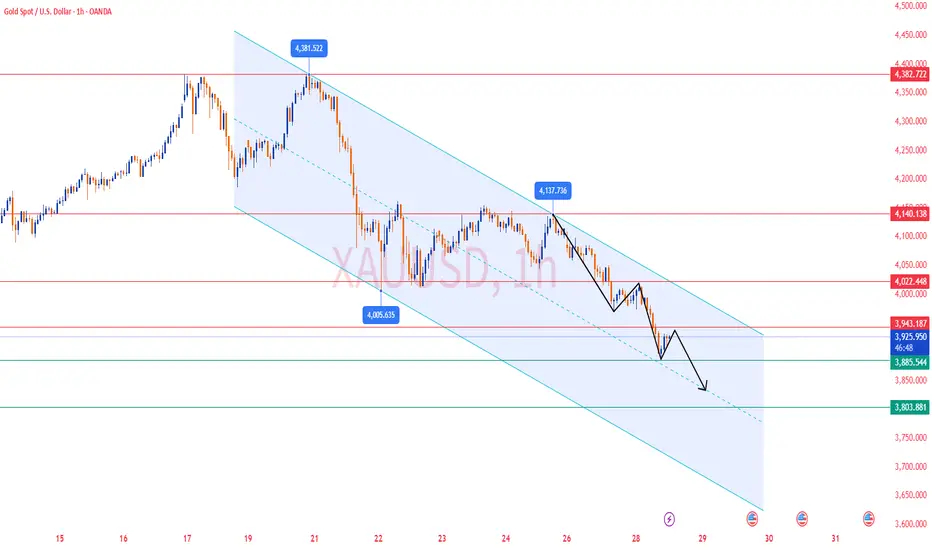
XAU/USD – Bearish Channel Still Dominates... Gold continues to trade within a well-defined descending parallel channel, showing clear lower highs and lower lows. The price has recently retested the upper boundary of the channel near $3,965–$3,970, suggesting potential resistance and continuation of the bearish momentum unless a strong breakout

XTIUSD (Crude Oil) Technical View
Trend Check
• Weekly range persists; sellers near 66–67, buyers near 56–58
• Daily momentum turning lower after failing at 62–63
• 4H/1H lower highs show short-term bearish control
Key Levels
• Resistance: 61.5–61.8, 62.5, 63.0
• Support: 60.0–59.8, 59.0–58.8, 57.2–56.5
• Pivot: 61.0
Trade Ideas

Gold Analysis and Trading Strategy | October 28✅ From the daily chart of spot gold, the price is approaching the Fibonacci 0.618 retracement level near 3897, combined with the 3900 psychological level, forming a strong short-term support zone where intense buying and selling pressure is expected. However, it is important to note that gold has al
Gold Correction Done!!!Gold has retraced to the 0.65 Fibonacci level on the 4H timeframe, calculated from the previous swing low. This zone has historically acted as a strong inflection point deep enough to shake out weak hands, but often the launchpad for the next leg up.
Zooming into the lower timeframes (30M–1H), we’r

See all futures ideas
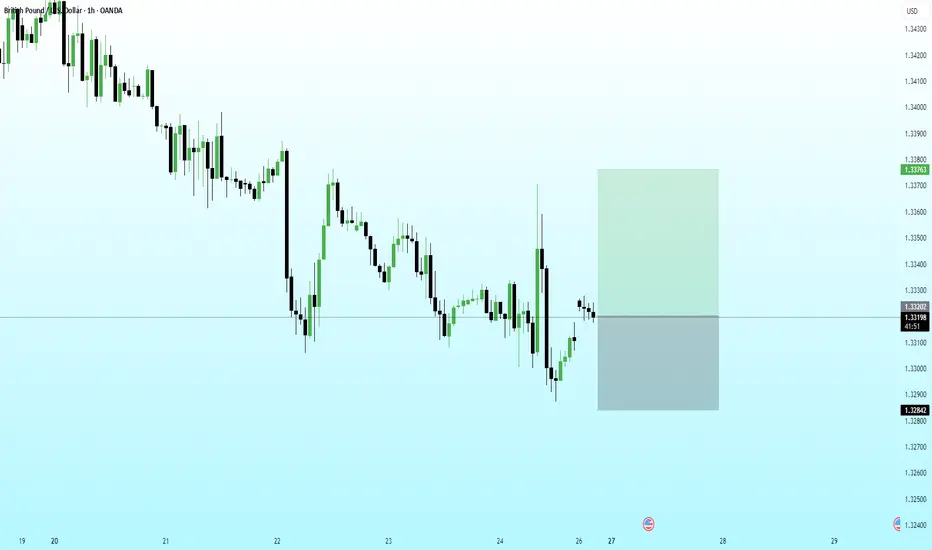
GBP/USD – 1H Chart...✅ Clear Technical Target Zones (GBP/USD – 1H Chart)
Target Price Zone Why it matters
TP1 1.3420 – 1.3440 Nearest major resistance + previous structure level + matches my first marked target
TP2 1.3485 – 1.3500 Next resistance zone + matches my upper target line + psychological round number
---

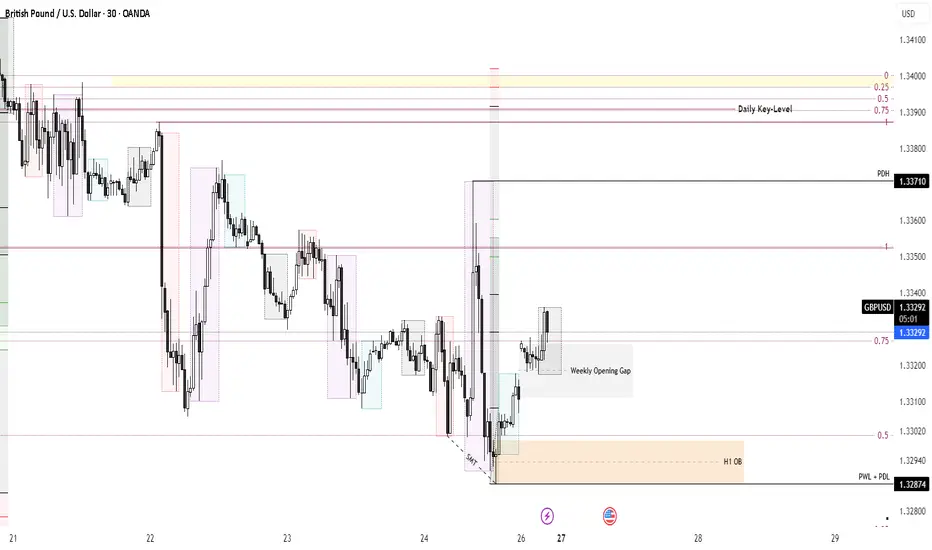
GBP/USD | 1H AnalysisPrice swept liquidity below the recent low and reacted strongly from a discount demand zone.
A bullish displacement followed, signaling a potential reversal in structure.
Currently, price is forming a retracement into the mitigation area — offering a potential continuation to the upside.
Entry: 1.
Buy Trade - GBP/NZDGreetings to everyone!
You can place a buy trade on GBP/NZD and check out my chart for the ideal entry, stop-loss & target placement.
Remember :-
* Move your SL to breakeven once the trade reaches 1:1 R.
* Aim for a minimum reward of 1:1.5 R.
* Don't risk more than 3% of your total margin.

GBPCHF - CORRECTION NEAR EXHAUSTION?Symbol - GBPCHF
GBPCHF continues its corrective move, forming lower lows amid ongoing macroeconomic uncertainty and concerns related to US policy. GBPCHF remains within a bearish structure but is now approaching a key demand zone around 1.0555 – 1.0530, where buying interest could potentially emerg

Euro Under Pressure from Strong USDThe euro continues to show weakness against the dollar as global risk sentiment cools and investors shift toward safer assets. Market participants remain cautious ahead of key inflation data from the Eurozone and upcoming comments from Federal Reserve officials, which could clarify the next phase of

Eur jpy going to 175 EURJPY is showing signs of weakness after tapping into a strong supply zone on the higher timeframe.
Price has broken short-term structure, suggesting that sellers may be in control for now.
If the current supply zone continues to hold, we could see a move down toward the 175.00 level, where the ne

GBPJPY for next Month -> 28 OctI'm expecting the price to move higher in GJ. there might be some pull back as well but expecting a long for long term.

USDJPY - BUY📊 Trade Setup: USDJPY
Direction: LONG ✅
Timeframes Used:
Primary: 1HR CapWave
Entry: 15M CapWave (optional)
Key Confluences:
1HR CapWave Confirmation - Bullish momentum and directional alignment on higher timeframe
Asia Session Low

EUR-JPY is in a Curved PathEUR -JPY is in a curved path in 30 Min TF. Breakout may be in waiting period. This is unique in EUR-JPY.

GBPUSD retracement towards higher timeframe key levelGBPUSD is retracing in higher timeframe towards an important Key level before giving the seasonal November expansion. It also is the resetting phase of the October's monthly candle as we are in the las week of October. We are anticipating a Classic expansion till Wednesday and we may purge the sell
See all forex ideas
| - | - | - | - | - | - | - | - | ||
| - | - | - | - | - | - | - | - | ||
| - | - | - | - | - | - | - | - | ||
| - | - | - | - | - | - | - | - | ||
| - | - | - | - | - | - | - | - | ||
| - | - | - | - | - | - | - | - | ||
| - | - | - | - | - | - | - | - | ||
| - | - | - | - | - | - | - | - | ||
| - | - | - | - | - | - | - | - |
Trade directly on the supercharts through our supported, fully-verified and user-reviewed brokers.


