Longs be cautious in M&MTF: Daily
CMP: 3645
The upmove from 2020 lows is at the maturing zone (as we are now trading in the 5th wave)
The upmove from April 2025 lows is also at the final leg and this impulse could end soon.
In simple price action terms, price has broken down from the sideways range (3660-3780) and the b

The best trades require research, then commitment.
Get started for free$0 forever, no credit card needed

Scott "Kidd" PoteetThe unlikely astronaut

Where the world does markets
Join 100 million traders and investors taking the future into their own hands.

Anupam Rasayan India LtdStock is about to break all time high with good volume and also if you can see the retracement of price is already done means we can see the break out but we should not miss the part stop loss as it trading at very high price so keep the low is as stop loss

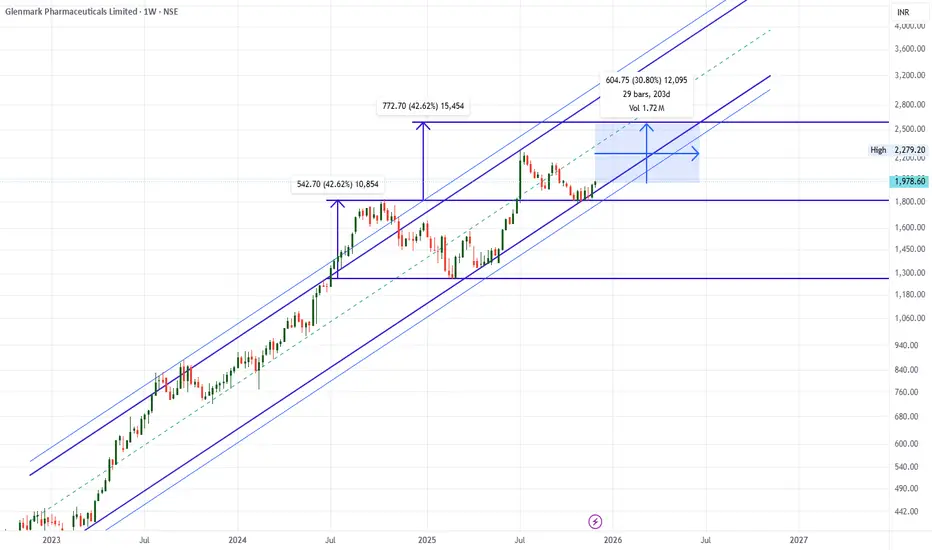
Glenmark 30% upside possible in next 6 -8 MonthsGlenmark Weekly chart suggest 30% Upside in coming 6-8 Month.
Glenmark has created bottom near 1250-1300 & have been making HH HL.
LTP - 1967
SL - 1775
Targets ... 2550+
Timeframe - 6-8 Months.
Happy Invetsing.
Breakout Setup Emerging in Strides Pharma Science Ltd#STRIDES
📈Pattern & Setup:
Strides Pharma is exhibiting a structural shakeout followed by a dry-volume pullback — a powerful combination often seen before a fresh breakout.
The stock recently shook out weak hands near 830–850, reclaimed the trendline, and is now trading above it with a strong bul

Reliance Industries Ltd. - Stock AnalysisDate : 30-Nov-2025
LTP : Rs. 1,567.50
Technical View:
• NSE:RELIANCE is in primary uptrend since Apr 2025 and currently trading through it's secondary uptrend since 16-Oct-2025.
• After touching the high of 1,551 on 9-Jul-2025, it has retraced 14% to 1,340.60 level.
• NSE:RELIANCE has formed

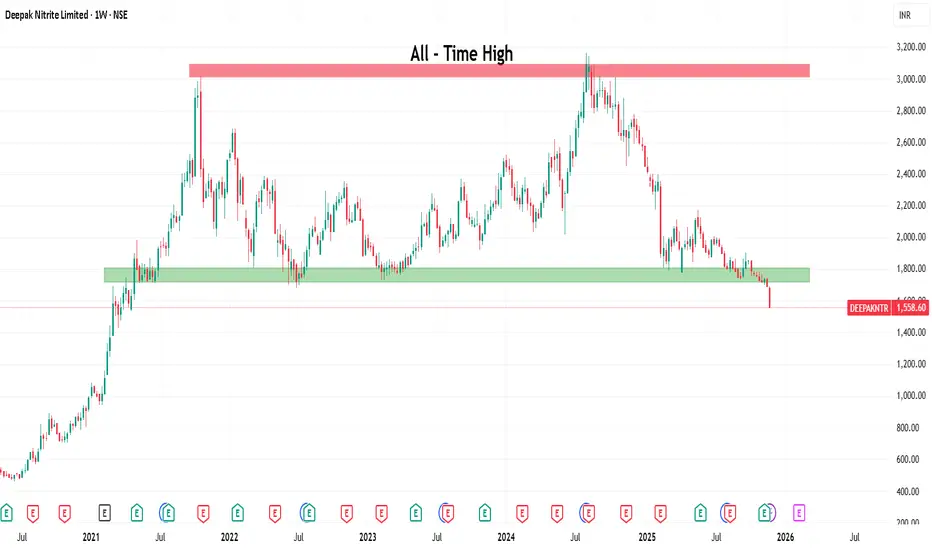
Deepak Nitrite: Support Breakdown Signals Caution🔍 Technical Analysis
Deepak Nitrite Limited has experienced a super bullish rally over the past decade, transforming from below ₹100 to reaching ₹3,000 by October 2021 - representing an impressive 30x growth in just 10 years. However, the stock has since entered a prolonged consolidation and corre
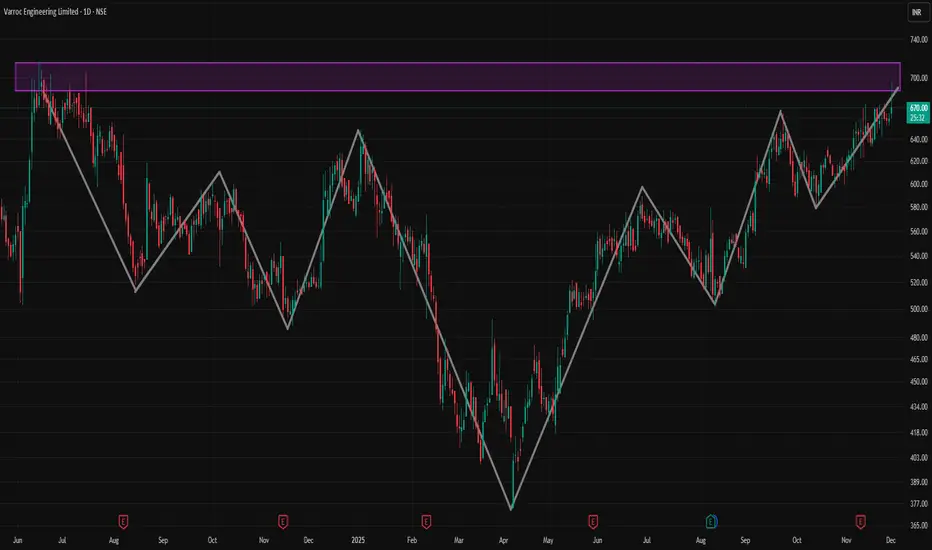
VARROC 1 Day Time Frame 📈 Where VARROC stands now
Recent quotes put VARROC around ₹ 659 – ₹ 692 per share.
On a 1‑day / very short‑term basis, the stock recently showed a jump of ~4‑5%.
The 52‑week range for the stock has been roughly ₹ 374 – ₹ 674–689 — so current levels are near the upper end of that band.
⚠️ What to
SILVER (XAGUSD) – Weekly Elliott Wave Analysis - DEC 2025Wave 3 nearing completion | Wave 4 correction possible | Major Wave 5 rally ahead
Silver is currently trading near $57.50, forming a strong impulsive structure and approaching the final phase of Wave (3).
🎯 Upside Targets (Wave 3 & Wave 5)
Wave (3) Potential Resistance / Target Zone
$59.89
$65.25

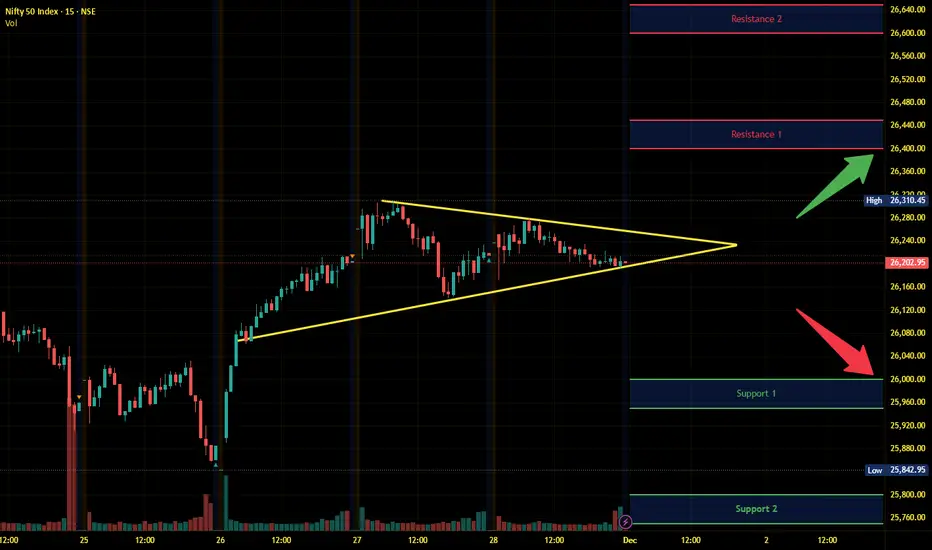
Nifty Intraday Analysis for 01st December 2025NSE:NIFTY
Index has resistance near 26400 – 26450 range and if index crosses and sustains above this level then may reach near 26600 – 26650 range.
Nifty has immediate support near 26000 – 25950 range and if this support is broken then index may tank near 25800 – 25750 range.
The uptrend is int
KAZIA THERAPEUTICS LTD SPONSORED ADRKZIA made double bottom with divergence with good volume and breakout at $4.45 with first target of $22.5, if and second target of $41.7 and with can expect strong resistance at $41.7 and reverse might happen. If KZIA did breakout at this level we can expect rally till $79.
Analysis is made on week

See all editors' picks ideas
Match Finder [theUltimator5]Match Finder is the dating app of indicators. It takes your current ticker and finds the most compatible match over a recent time period. The match may not be Mr. right, but it is Mr. right now. It doesn't forecast future connection, but it tells you current compatibility for today.
Jokes aside,

Trend Line Methods (TLM)Trend Line Methods (TLM)
Overview
Trend Line Methods (TLM) is a visual study designed to help traders explore trend structure using two complementary, auto-drawn trend channels. The script focuses on how price interacts with rising or falling boundaries over time. It does not generate trade sign

Breakouts & Pullbacks [Trendoscope®]🎲 Breakouts & Pullbacks - All-Time High Breakout Analyzer
Probability-Based Post-Breakout Behavior Statistics | Real-Time Pullback & Runup Tracker
A professional-grade Pine Script v6 indicator designed specifically for analyzing the historical and real-time behavior of price after strong All-Ti

Count█ OVERVIEW
A library of functions for counting the number of times (frequency) that elements occur in an array or matrix.
█ USAGE
Import the Count library.
import joebaus/count/1 as c
Create an array or matrix that is a `float`, `int`, `string`, or `bool` type to count elements from, t

Holographic Market Microstructure | AlphaNattHolographic Market Microstructure | AlphaNatt
A multidimensional, holographically-rendered framework designed to expose the invisible forces shaping every candle — liquidity voids, smart money footprints, order flow imbalances, and structural evolution — in real time.
---
📘 Overview
The Hol

PriceFormatLibrary for automatically converting price values to formatted strings
matching the same format that TradingView uses to display open/high/low/close prices on the chart.
█ OVERVIEW
This library is intended for Pine Coders who are authors of scripts that display numbers onto a user's charts. T

LogNormalLibrary "LogNormal"
A collection of functions used to model skewed distributions as log-normal.
Prices are commonly modeled using log-normal distributions (ie. Black-Scholes) because they exhibit multiplicative changes with long tails; skewed exponential growth and high variance. This approach i

Range Oscillator (Zeiierman)█ Overview
Range Oscillator (Zeiierman) is a dynamic market oscillator designed to visualize how far the price is trading relative to its equilibrium range. Instead of relying on traditional overbought/oversold thresholds, it uses adaptive range detection and heatmap coloring to reveal where pri

Volume Surprise [LuxAlgo]The Volume Surprise tool displays the trading volume alongside the expected volume at that time, allowing users to spot unexpected trading activity on the chart easily.
The tool includes an extrapolation of the estimated volume for future periods, allowing forecasting future trading activity.
🔶 U

Smooth Theil-SenI wanted to build a Theil-Sen estimator that could run on more than one bar and produce smoother output than the standard implementation. Theil-Sen regression is a non-parametric method that calculates the median slope between all pairs of points in your dataset, which makes it extremely robust to o

See all indicators and strategies
Community trends
Anupam Rasayan India LtdStock is about to break all time high with good volume and also if you can see the retracement of price is already done means we can see the break out but we should not miss the part stop loss as it trading at very high price so keep the low is as stop loss
Longs be cautious in M&MTF: Daily
CMP: 3645
The upmove from 2020 lows is at the maturing zone (as we are now trading in the 5th wave)
The upmove from April 2025 lows is also at the final leg and this impulse could end soon.
In simple price action terms, price has broken down from the sideways range (3660-3780) and the b
Multi year breakout RBL Bank 5 yrs breakout RBL Bank is reversal breakout. After water fall lowest done by bank. Now trying to do higher high and higher low. If break out sustain then it will be good opportunity.

#DLF analysis Broken support on the Fibonacci golden level! Next week will be crucial. I have sold CE (Earlier position).

Swiggy Limited 🟢 Swiggy is sitting at a crucial support area with RSI divergence confirming strength 🧭
📈 Might be a perfect low-risk setup for positional traders!

BUY TODAY SELL TOMORROW for 5%DON’T HAVE TIME TO MANAGE YOUR TRADES?
- Take BTST trades at 3:25 pm every day
- Try to exit by taking 4-7% profit of each trade
- SL can also be maintained as closing below the low of the breakout candle
Now, why do I prefer BTST over swing trades? The primary reason is that I have observed that

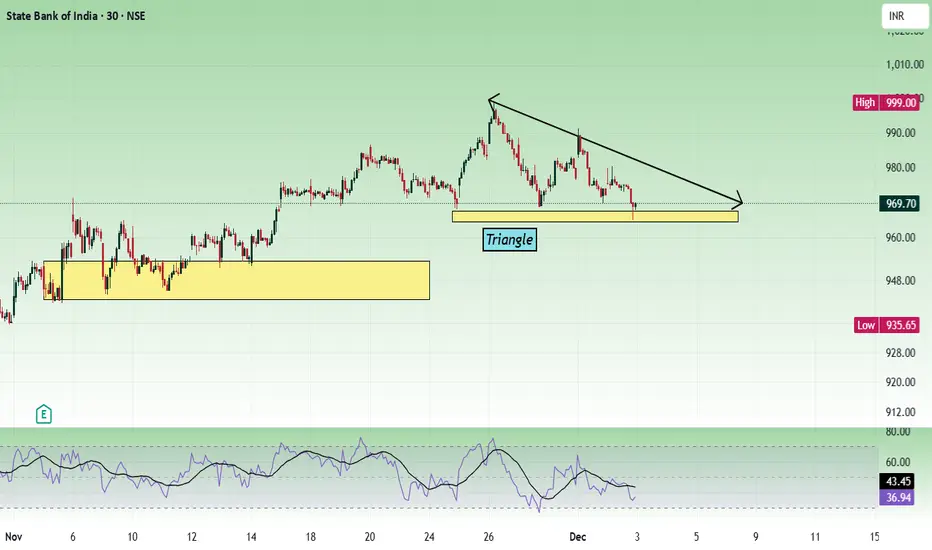
Sbin The lower time frame shows the price is forming a triangle pattern. And nearby support is seen at the 942 to 952 zone.
The daily chart shows, the price is moving steadily and is having a pullback towards the trend line. The price can bounce from the trend line.
If the price breaks the triangle, sel
Lets Create and Backtest a Simple Strategy from literally ZeroI make educational content videos for swing / positional trading .
In this video I will be using 3 months old chart along with one example of how to approach any trade or price action with literally zero lines and zones on screen .

Suzlon Long term buySuzlon is nearing the demand zone within the pattern. Best time for a short term swing and as well one can accumulate for long term for they have a veryyyyy gooodd orderbook.

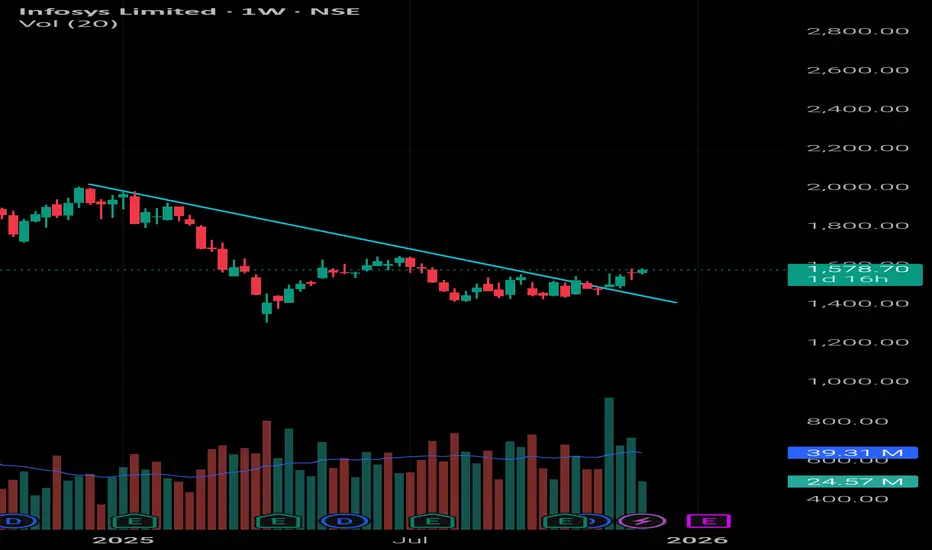
Infy Weekly Chart Breakout Infy Weekly Chart Breakout showing increasing in volume also. Closely watch the strength of breakout in coming weeks. Purely for Paper trade. First learn than earn.
If you want real trade than care should be taken for risk management.
See all stocks ideas
No scheduled reports
Tomorrow
C
CMPIPurple Wave Infocom Ltd.
Exchange
BSE
Offer price
1.34 - 1.41
USD
Tomorrow
T
TINLogiciel Solutions Ltd.
Exchange
BSE
Offer price
2.04 - 2.15
USD
Dec 8
E
EQSPEBSPEB Adhesives Ltd.
Exchange
NSE
Offer price
0.58 - 0.63
USD
Dec 8
C
CHWYClear Secured Services Ltd.
Exchange
NSE
Offer price
1.40 - 1.48
USD
Dec 8
J
JOCMInvicta Diagnostic limited
Exchange
NSE
Offer price
0.89 - 0.95
USD
Dec 9
E
EMASHelloji Holidays Limited
Exchange
BSE
Offer price
1.23 - 1.32
USD
Dec 9
T
TPVNeochem Bio Solutions Ltd.
Exchange
NSE
Offer price
1.04 - 1.09
USD
Dec 10
E
EMAPARTNERVidya Wires Limited
Exchange
BSE
Offer price
0.53 - 0.58
USD
Dec 10
N
NYMTShri Kanha Stainless Limited
Exchange
NSE
Offer price
1.001
USD
Dec 10
3
320000Meesho Limited
Exchange
BSE
Offer price
1.17 - 1.23
USD
See more events
Community trends
BTC/USDT BreakRetest Buy Setup | Bullish Continuation ExpectedBitcoin is showing a bullish structure on the 30-minute chart.
Price has broken above the immediate resistance zone and is now retesting the same area as support — creating a strong break & retest buying opportunity.
✔ Key Points
Previous resistance turned support
Clean bullish rejection from ret

Buy Setup (Safer After Pullback)✅ Buy Setup (Safer After Pullback)
Because price already pumped hard, the safe buy is after a retracement — not at the top.
Buy Entry
👉 Buy: 92,820 – 92,900 retest zone
(Price must retest old resistance → new support)
Targets
TP1: 93,600
TP2: 94,400
TP3: 95,480 (major resistance)
Stop-Loss

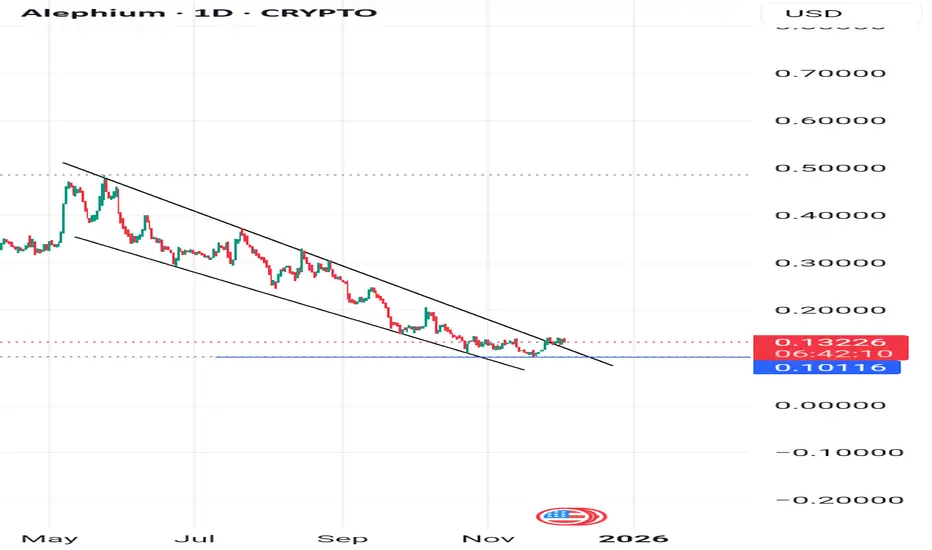
Alephium – Falling Wedge Breakout (1D Timeframe)Analysis:
After several months of steady downward pressure, Alephium (ALPHUSD) has finally broken out of its falling wedge pattern on the 1-day chart a classic bullish reversal structure.
Falling Wedge Breakout
Price has moved cleanly above the wedge’s upper trendline, indicating exhaustion of se
XAUUSD GOLD Analysis on (03/12/2025)#XAUUSD UPDATEDE
Current price - 4223
If price stay below 4245, then next target 4200,4180 and 4160 above that 4270
Plan;If price break 4224-4230 area, and stay below 4220, we will place sell order in gold with target of 4200,4180 and 4160 & stop loss should be placed at 4245


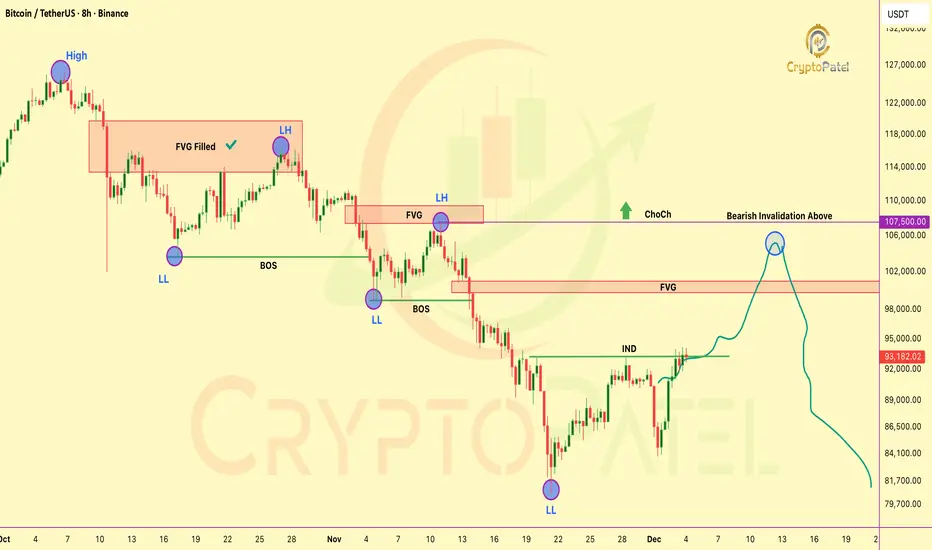
HTF ChoCH Alert: BTC’s Macro Bias Is Still BearishHTF ChoCH Alert: BTC’s Macro Bias Is Still Bearish
BTC is still following clean HTF bearish order-flow (LH → LL → BOS).
The current push up is just a premium retracement, driven by internal liquidity grabs.
Price is reaching for the premium FVG at 99,866–101,184, the next clear draw on liquidity a
$SOL — Neckline Rejection Playing Out Exactly as Expected CRYPTOCAP:SOL — Neckline Rejection Playing Out Exactly as Expected
Price tapped the neckline zone at 144–146 and got rejected cleanly — exactly the reaction we anticipated from this double-bottom structure.
The rejection has already pushed price back toward the 138–136 zone, which is the first su

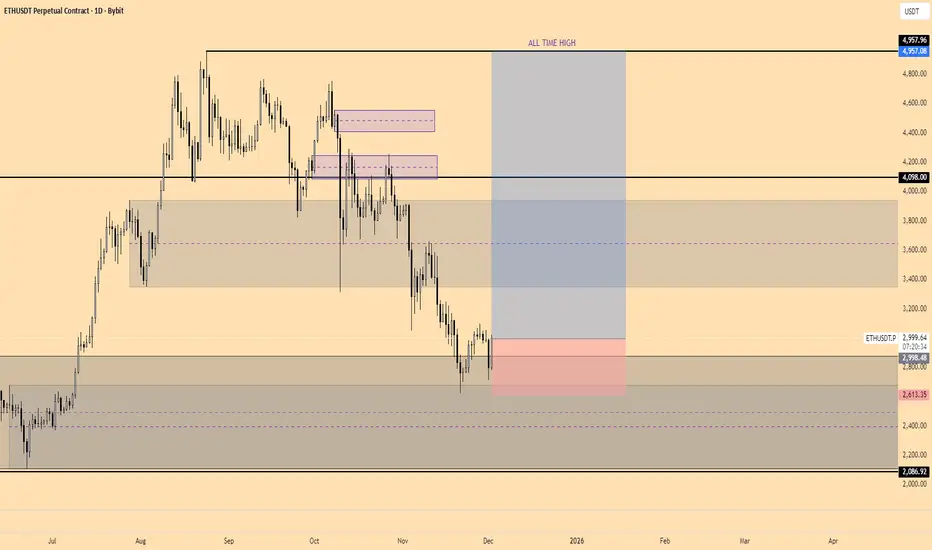
Buying $ETH Spot againAs we see CRYPTOCAP:ETH is holding Monthly Orderblock pretty well and Daily Price action is looking bullish too, so i am interested in buying CRYPTOCAP:ETH now.
BTC 📉 Technical Analysis Description (Professional & Clear)
In today’s analysis, Bitcoin is developing a potential harmonic structure with clear reactive legs forming from X → A → B → C.
Price recently rejected from the 0.95 retracement and is now pulling back toward a key liquidity pocket.
The chart


See all crypto ideas
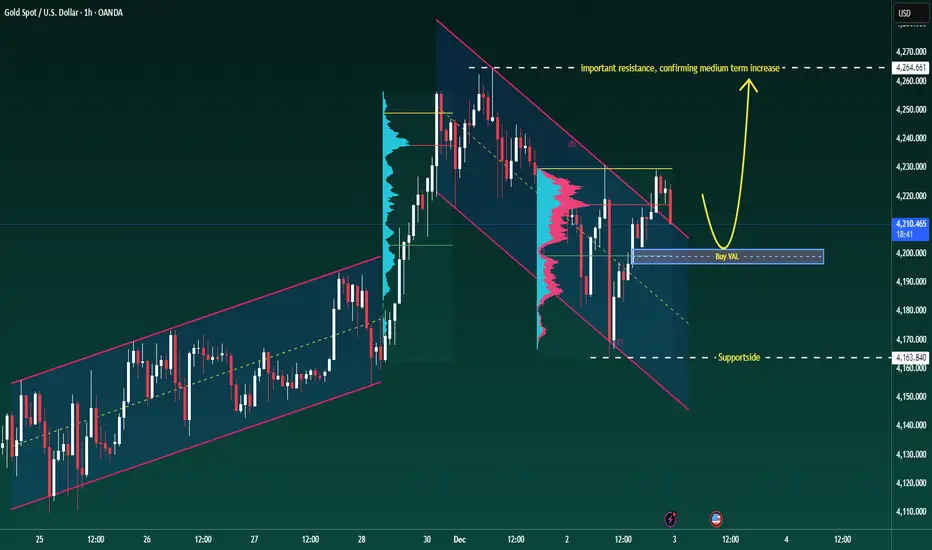
XAUUSD–Volume Profile buy scenario around 4,200, target 4,265+XAUUSD–Volume Profile buy scenario around 4,200, target 4,265+
Brian – Prioritize buying with the trend, use VAL to position entry
Market snapshot
At the end of the US session yesterday, gold had a strong increase and then stabilized, currently moving sideways around 4,216 on H1.
The structure is
XAU/USD – Waiting for 4,203 Retest Before the Next Bullish Leg(MMF Intraday Plan – Dec 03)
Gold continues to recover after last week’s deep drop, but the current bullish momentum is still weak and needs a liquidity sweep + clean pullback before pushing higher.
On the M30–H1 structure, price is still moving below the descending trendline, suggesting that Gold

Gold Breaks Trendline – Bulls Back in Control!Hello Everyone let's analyse Gold as it has broken above its falling trendline resistance, signaling a possible shift from short-term weakness to bullish momentum. After several attempts, the price finally managed to close above the trendline with increasing volume, showing that buyers are stepping
MCX Silver Mar-26 — Short Setup IdentifiedMCX:SILVER1!
Silver Futures (MCX Mar-26) has formed 3 strong bullish candles with equal body size, which often signals momentum exhaustion. Price is now consolidating near resistance, creating a short-biased educational setup as per my analysis.
🔽 Short Setup (Educational Technical Analysis)
📌 S
XAUUSD – H1 Sideways, Priority is Trading at Liquidity Zones...XAUUSD – H1 Sideways, Priority is Trading at Liquidity Zones
Gold is moving sideways on the H1 timeframe, with price fluctuating around the equilibrium zone and not choosing a clear direction yet.
In this condition, I avoid chasing trades in the middle of the range — instead, I only trade at the li

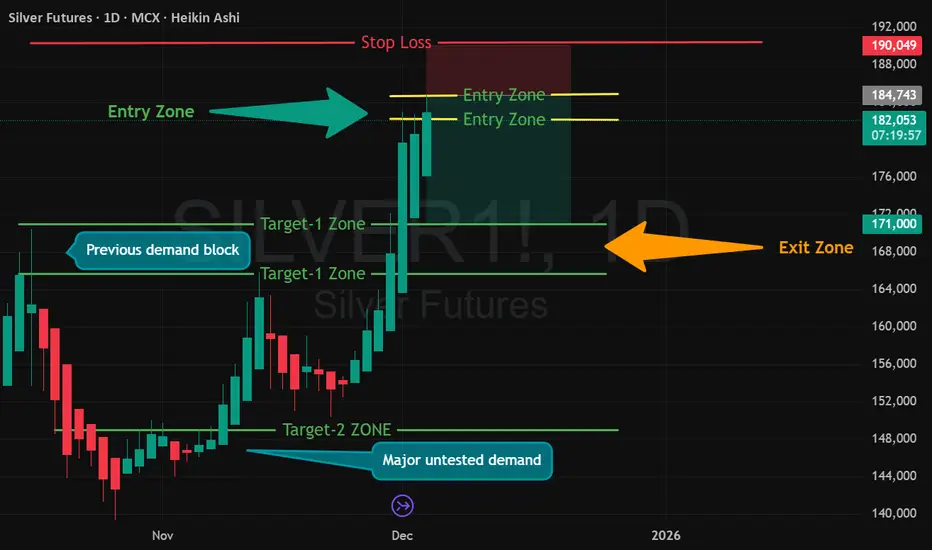
Silver - CorrectionSeveral signals indicate that a correction is possible around the 60k level (slightly below or above). There’s also an interesting setup in gold, but more on that later in the next chart/idea.”

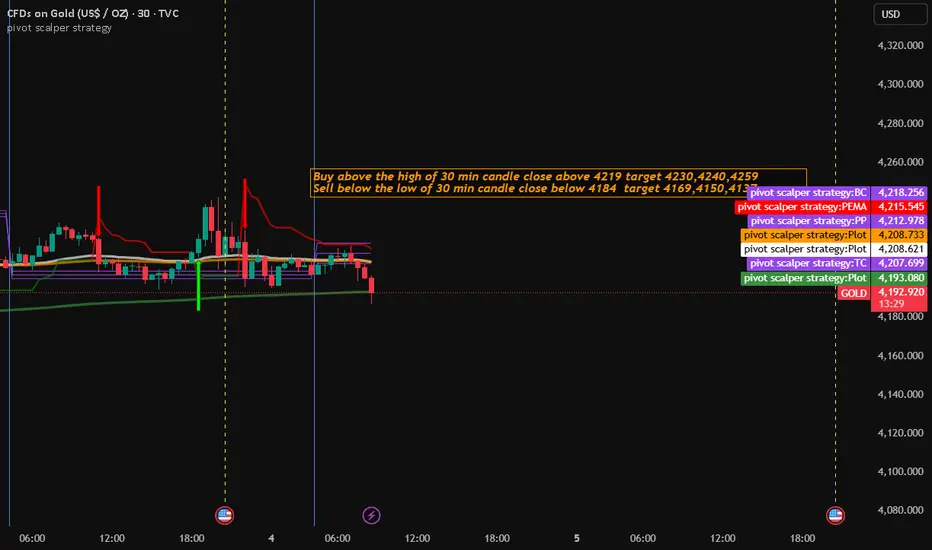
Gold Trading Strategy for 04th December 2025🟡 GOLD Trading Plan (30-Min Strategy)
📈 BUY Setup
Buy Above: High of 30-min candle closing above $4219
🎯 Targets:
TP1: $4230
TP2: $4240
TP3: $4259
🛑 Stop Loss: Below the breakout candle
🔄 Trade Management:
After TP1 is achieved, move SL → Cost + $1
📉 SELL Setup
Sell Below: Low of 30-min candle clo
Gold Pullback to Bullish OB, Watch for Buy at 4,170–4,155⏰ Timeframe: 30 minutes
📅 Update: 12/02/2025
🔍 Market Context
After gold surged from the 4,115 USD area, the price peaked at 4,256 USD, then a small Bearish OB appeared around 4,223 USD (Fibo area 0.618–0.786) – where the market reacted with a slight decline.
Currently, the price is in a technica

XAUUSD Gold Long IdeaI’m expecting Gold to move toward the $4,240 level. The stop loss should be placed below the swing low at $4,162, maintaining a risk-to-reward ratio of 1:3.

gold mcx momntum update as per adp data aheadanalysis based on 2hrs chart blow---
Range Breakout Watch: ₹130,650
Bullish Scenario
if market ₹130,650above sustain than
Upside continuation expected
Targets:
• 131,000
• 131,300
• 132,000 Trend is still positive sl will be 130277 close base 15 minute candle
Bearish Scenario
if price130,650 a

See all futures ideas
USDINR – Elliott Wave Outlook (Monthly) - 03-DEC-2025The long-term bullish structure remains intact and the pair is currently progressing within the final leg of Wave V. Price respected structural support and continues to move upward inside the long-term rising channel.
Key Support
🔹 83.70 – Major structural support
🔹 Bias remains bullish above 83.70

Triple Base Wedge Setup📌 Overview
This idea highlights a contracting price structure forming inside a Falling Wedge while the support base remains protected three separate times. The repeated defense of the same support zone creates a Triple Base, indicating strong demand. As volatility compresses and candles tighten,

EURUSD – Retesting Demand Zone for Potential Upside ReversalPrice has tapped into a well-defined HTF demand zone after a controlled selloff. The latest wick into the zone suggests absorption and potential willingness to push higher.
If the zone continues to hold, I’m expecting bullish orderflow to kick in, leading to a structure shift and an upward continua

GBPUSD LONG GU long: clean flip zone + 38.2% retrace of last impulse. Strong rejection + 4H 50 EMA bounce. Multi-confluence level — watching for continuation.

USDJPY Breakdown Begins:Elliott Wave Points to Deeper CorrectionThe USDJPY 4H chart shows a completed five-wave impulsive structure, ending at the recent high marked as wave (5). After finishing this full wave cycle, the price has started to break down from the rising wedge pattern, which is a common sign of a trend reversal. The corrective structure from the to

EURUSD - Intraday SetupRisk Management / Event Warning
Trade Management: If the trade activates and moves +15 pips to 1.16650, the Stop Loss will be moved to Breakeven (1.16500) to lock in a risk-free trade.
Fundamental Risk: High-impact USD data (US Usual Weekly Earnings) is due on December 4th. Volatility may spike

usdinr alert for long sideusdinr wonderful monthly weekly illiot 5th wave completion stage , 5th wave might goes upto 90.57 level .. keep 91 as sl ..nd sell with every rise .. till 90.57 ..day close above 91 sl.... target 86/80/76/69... it might be temporary pose of usd era nd inr uprise we might see... jai hind..this is pur

USDJPY SELLS📉 USD/JPY – Bearish Trend With Clean Supply Rejection
As we can see, UJ is clearly in a bearish trend, confirmed by the red dots on the left chart, where price continues to create new lows.
Price recently retraced into a well-defined Supply zone around the 156.000 level. On the right chart, struct

USD/CAD in Daily time frameAS per Wave analysis, Correction of flat is done. Now Wave 5 started for down trend in daily time frame for an Target of 1.36250

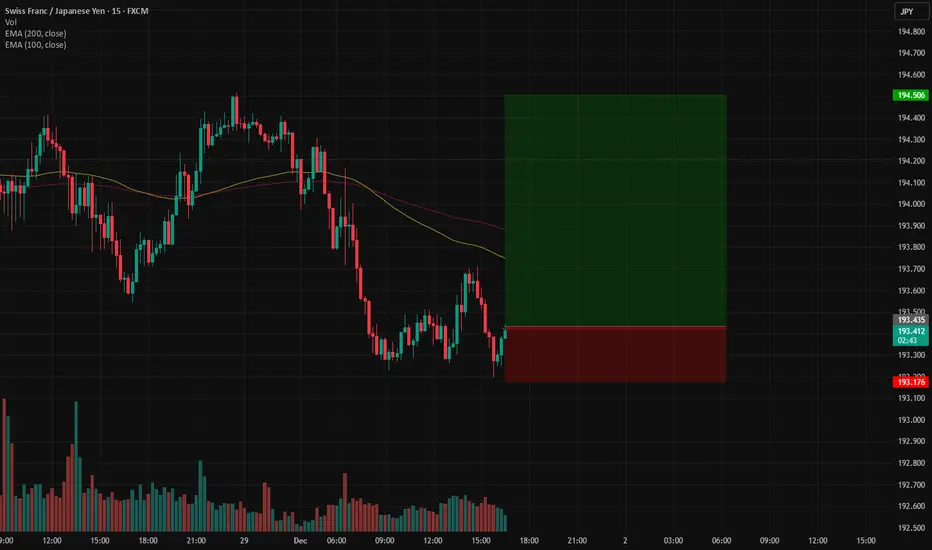
CHF JPY BuyBased on recent analysis, the Swiss Franc/Japanese Yen (CHF/JPY) currency pair is broadly in a strong bullish trend supported by fundamental factors and technical indicators. While the pair may experience short-term corrective pullbacks from recent highs, the prevailing sentiment for December 2025 i
See all forex ideas
| - | - | - | - | - | - | - | - | ||
| - | - | - | - | - | - | - | - | ||
| - | - | - | - | - | - | - | - | ||
| - | - | - | - | - | - | - | - | ||
| - | - | - | - | - | - | - | - | ||
| - | - | - | - | - | - | - | - | ||
| - | - | - | - | - | - | - | - | ||
| - | - | - | - | - | - | - | - | ||
| - | - | - | - | - | - | - | - |
Trade directly on the supercharts through our supported, fully-verified and user-reviewed brokers.


