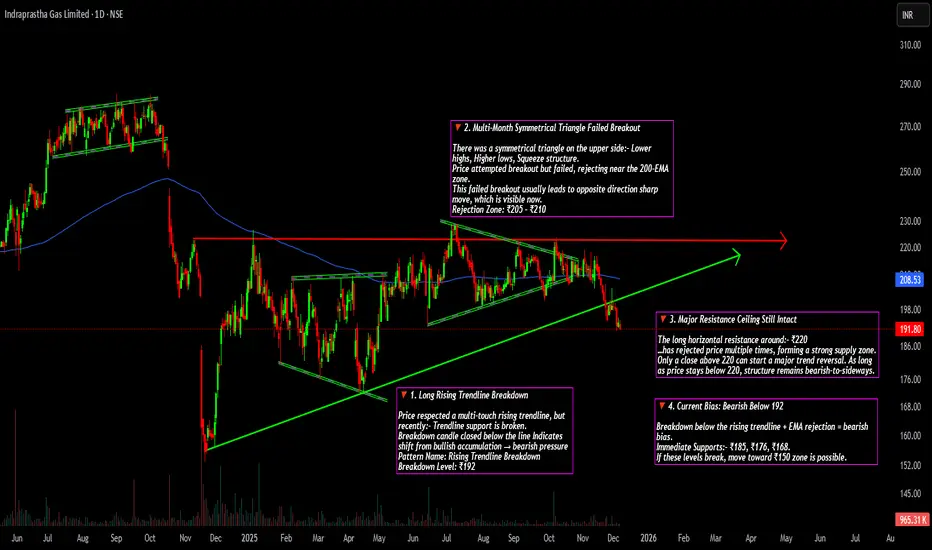
IGL – Structure & Pattern Breakdown🔻 1. Long Rising Trendline Breakdown
Price respected a multi-touch rising trendline, but recently:- Trendline support is broken.
Breakdown candle closed below the line Indicates shift from bullish accumulation → bearish pressure
Pattern Name: Rising Trendline Breakdown
Breakdown Level: ₹192.
🔻 2.

The best trades require research, then commitment.
Get started for free$0 forever, no credit card needed

Scott "Kidd" PoteetThe unlikely astronaut

Where the world does markets
Join 100 million traders and investors taking the future into their own hands.
NALCO (W) - Strongly Bullish - Fundamentally-Driven BreakoutTimeframe: Weekly | Scale: Linear
The stock has confirmed a major structural breakout, shattering a 2-year consolidation ceiling. This move is supported by a "trifecta" of bullish factors: a technical breakout to new ATHs, rising volume, and stellar quarterly earnings.
🚀 1. The Fundamental Catal

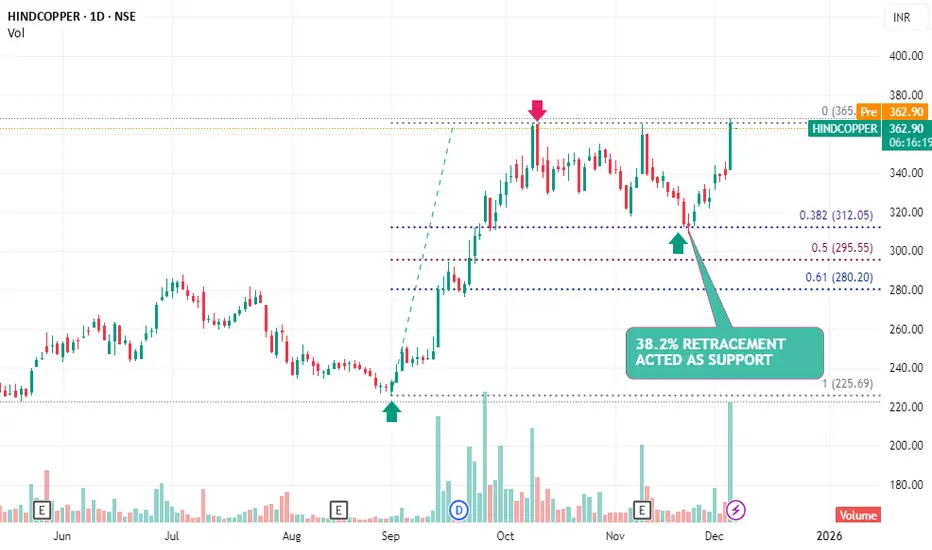
HINDCOPPER – Support at 38.2% Retracement With Reversal SignalHIHINDCOPPER has respected the 38.2% Fibonacci retracement level, indicating that buyers are active at this key support zone. The formation of a reversal candle (DOJI) at this level strengthens the probability of a reversal from the recent corrective decline.
Technical Highlights
Price retraced to th
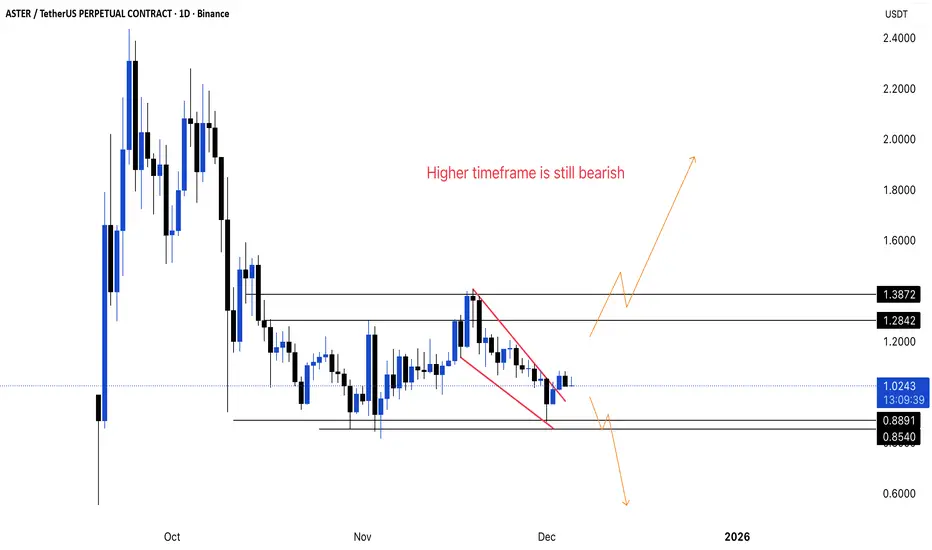
ASTER - what going to happen?📊 ASTER/USDT Update
🔎 Technical Observation:
- The pair is trading within a descending channel/falling wedge pattern, indicating a period of consolidation after a sharp decline.
- Price action shows compression near the apex of this wedge, suggesting imminent volatility.
- The chart explicitly no
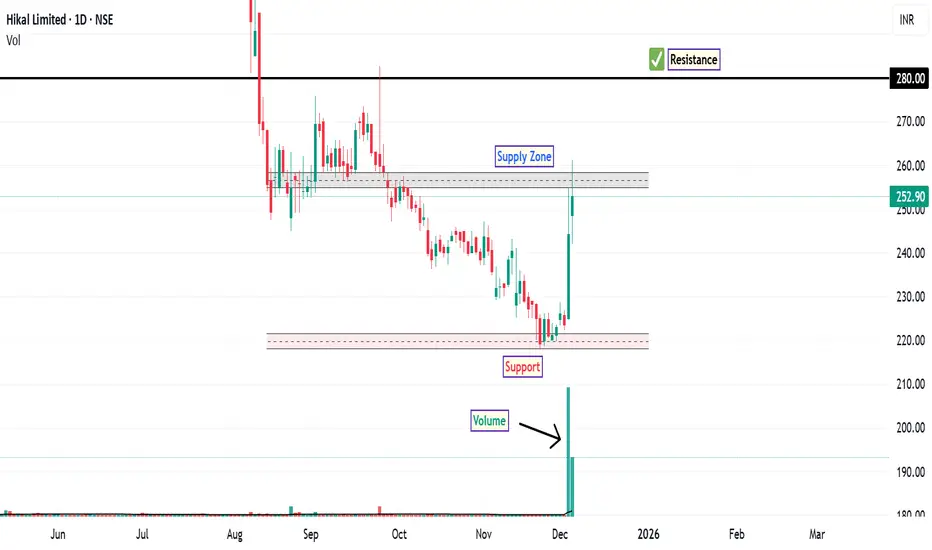
Hikal: Trend Shift and Key LevelsThe stock of Hikal Ltd . experienced a significant breakdown below its major support level of ₹331 in July, marking a continuation of its bearish phase. After testing the discount zone which is now major support zone, the stock rebounded sharply with high trading volume, signaling renewed buying in
Jubilant Foodworks Near Long Term SupportJubilant Foodworks swiftly moving in a Parallel Channel since it got listed in the secondary market. Stock respected the channel's boundaries on several occasions. Now it is very near to its support on both log & linear (caption image) charts. Support zone range from 570 to 525 for double to four ti

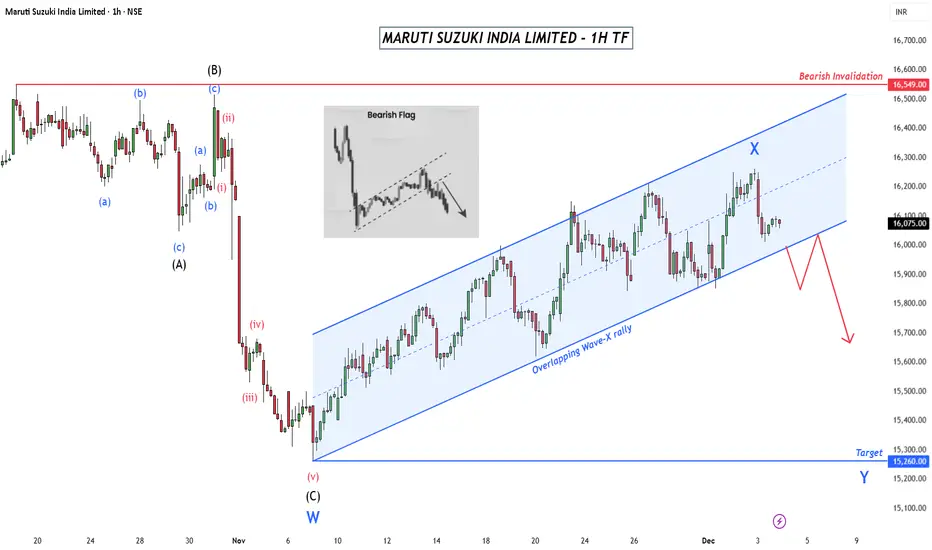
Maruti: Rising Flag, Dropping ProbabilityStructure
The decline into Wave W is complete as a Regular Flat.
The rebound is a corrective Wave X, fully overlapping and contained within a rising channel.
Bias remains bearish as long as price trades inside this channel.
Wave Y Setup
Trigger: Breakdown below the channel near 16000.
Longs be cautious in M&MTF: Daily
CMP: 3645
The upmove from 2020 lows is at the maturing zone (as we are now trading in the 5th wave)
The upmove from April 2025 lows is also at the final leg and this impulse could end soon.
In simple price action terms, price has broken down from the sideways range (3660-3780) and the b

Anupam Rasayan India LtdStock is about to break all time high with good volume and also if you can see the retracement of price is already done means we can see the break out but we should not miss the part stop loss as it trading at very high price so keep the low is as stop loss

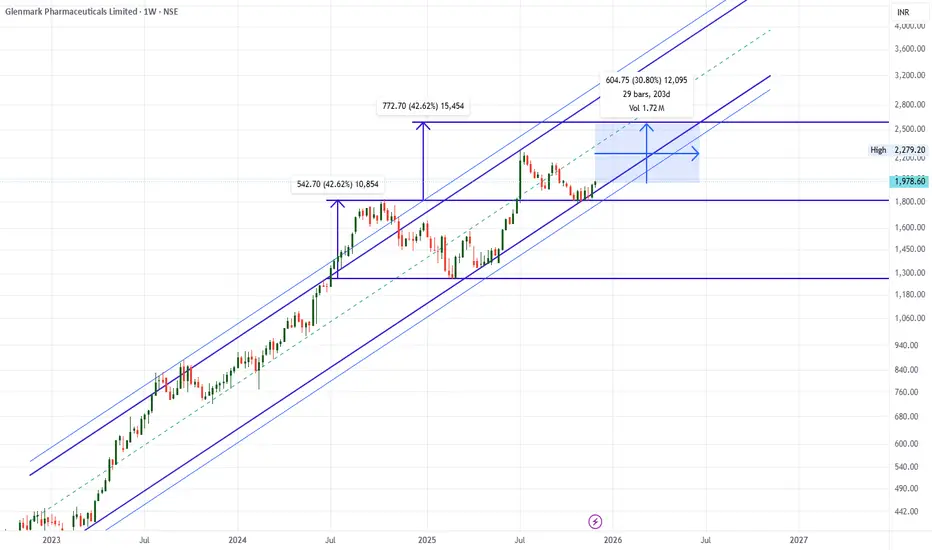
Glenmark 30% upside possible in next 6 -8 MonthsGlenmark Weekly chart suggest 30% Upside in coming 6-8 Month.
Glenmark has created bottom near 1250-1300 & have been making HH HL.
LTP - 1967
SL - 1775
Targets ... 2550+
Timeframe - 6-8 Months.
Happy Invetsing.
See all editors' picks ideas
Match Finder [theUltimator5]Match Finder is the dating app of indicators. It takes your current ticker and finds the most compatible match over a recent time period. The match may not be Mr. right, but it is Mr. right now. It doesn't forecast future connection, but it tells you current compatibility for today.
Jokes aside,

Trend Line Methods (TLM)Trend Line Methods (TLM)
Overview
Trend Line Methods (TLM) is a visual study designed to help traders explore trend structure using two complementary, auto-drawn trend channels. The script focuses on how price interacts with rising or falling boundaries over time. It does not generate trade sign

Breakouts & Pullbacks [Trendoscope®]🎲 Breakouts & Pullbacks - All-Time High Breakout Analyzer
Probability-Based Post-Breakout Behavior Statistics | Real-Time Pullback & Runup Tracker
A professional-grade Pine Script v6 indicator designed specifically for analyzing the historical and real-time behavior of price after strong All-Ti

Count█ OVERVIEW
A library of functions for counting the number of times (frequency) that elements occur in an array or matrix.
█ USAGE
Import the Count library.
import joebaus/count/1 as c
Create an array or matrix that is a `float`, `int`, `string`, or `bool` type to count elements from, t

Holographic Market Microstructure | AlphaNattHolographic Market Microstructure | AlphaNatt
A multidimensional, holographically-rendered framework designed to expose the invisible forces shaping every candle — liquidity voids, smart money footprints, order flow imbalances, and structural evolution — in real time.
---
📘 Overview
The Hol

PriceFormatLibrary for automatically converting price values to formatted strings
matching the same format that TradingView uses to display open/high/low/close prices on the chart.
█ OVERVIEW
This library is intended for Pine Coders who are authors of scripts that display numbers onto a user's charts. T

LogNormalLibrary "LogNormal"
A collection of functions used to model skewed distributions as log-normal.
Prices are commonly modeled using log-normal distributions (ie. Black-Scholes) because they exhibit multiplicative changes with long tails; skewed exponential growth and high variance. This approach i

Range Oscillator (Zeiierman)█ Overview
Range Oscillator (Zeiierman) is a dynamic market oscillator designed to visualize how far the price is trading relative to its equilibrium range. Instead of relying on traditional overbought/oversold thresholds, it uses adaptive range detection and heatmap coloring to reveal where pri

Volume Surprise [LuxAlgo]The Volume Surprise tool displays the trading volume alongside the expected volume at that time, allowing users to spot unexpected trading activity on the chart easily.
The tool includes an extrapolation of the estimated volume for future periods, allowing forecasting future trading activity.
🔶 U

Smooth Theil-SenI wanted to build a Theil-Sen estimator that could run on more than one bar and produce smoother output than the standard implementation. Theil-Sen regression is a non-parametric method that calculates the median slope between all pairs of points in your dataset, which makes it extremely robust to o

See all indicators and strategies
Community trends
NALCO (W) - Strongly Bullish - Fundamentally-Driven BreakoutTimeframe: Weekly | Scale: Linear
The stock has confirmed a major structural breakout, shattering a 2-year consolidation ceiling. This move is supported by a "trifecta" of bullish factors: a technical breakout to new ATHs, rising volume, and stellar quarterly earnings.
🚀 1. The Fundamental Catal
IGL – Structure & Pattern Breakdown🔻 1. Long Rising Trendline Breakdown
Price respected a multi-touch rising trendline, but recently:- Trendline support is broken.
Breakdown candle closed below the line Indicates shift from bullish accumulation → bearish pressure
Pattern Name: Rising Trendline Breakdown
Breakdown Level: ₹192.
🔻 2.
Bullish in all time frame good for swing tradingExpert Quantitative Analysis: Constructing High-Conviction Technical Momentum Screeners on Screener.in
I. Executive Summary: The Quantitative Rationale for Trend-Following
The successful implementation of quantitative swing trading strategies necessitates a disciplined approach to stock selection, f
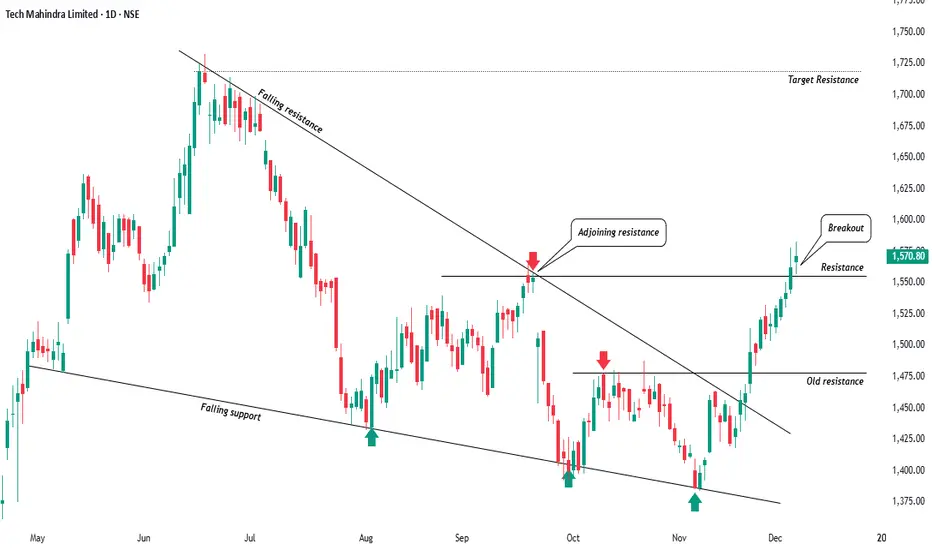
Techm Wakes Up! Reversal CandidateHi Traders! Hope all you are doing well and doing good trades, So today I am sharing a clean technical setup which I’ve been tracking for weeks Tech Mahindra has finally given breakout from a multi-month falling wedge along with a horizontal resistance flip. The structure is now turning bullish, and
BUY TODAY SELL TOMORROW for 5%DON’T HAVE TIME TO MANAGE YOUR TRADES?
- Take BTST trades at 3:25 pm every day
- Try to exit by taking 4-7% profit of each trade
- SL can also be maintained as closing below the low of the breakout candle
Now, why do I prefer BTST over swing trades? The primary reason is that I have observed that

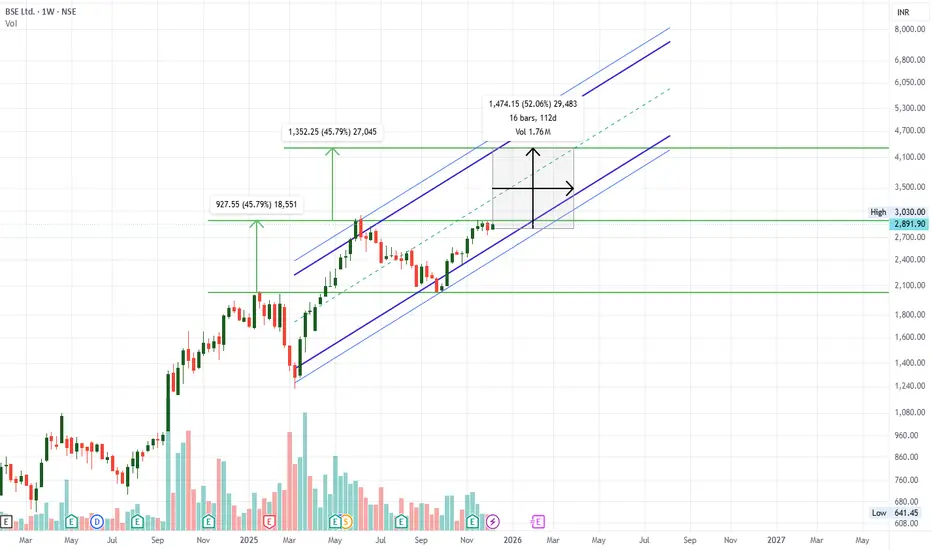
BSE Targets 4300 Possibility Based on Weekly charts BreakoutBSE Targets 4300 Possibility Based on Weekly charts Breakout.
Fundamentals:
Company is almost debt free.
Company has delivered good profit growth of 65.4% CAGR over last 5 years
Company has been maintaining a healthy dividend payout of 41.1%
Technical Analysis:
Weekly chart suggest Breakout fro
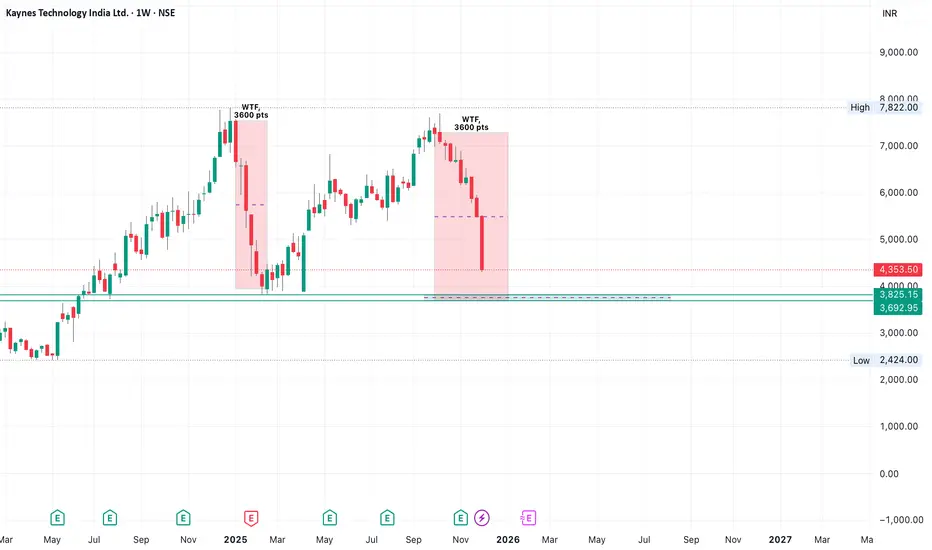
Kaynes Technology Weekly Chart Review | Key Levels & TrendKaynes Technology
Time frame : Weekly
I am expecting 3600 pts fall from the top i.e from 7320 to 3700.
if the weekly candle closes above 3825 price (don't check daily candle only weekly ) and if we get bullish confirmation of two candle then we will have the Entry for Long
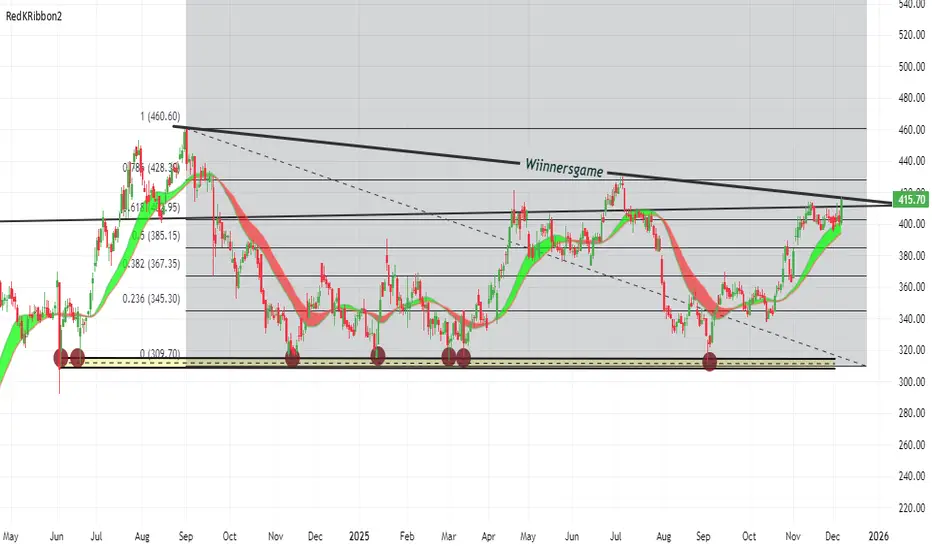
INDUSTOWER: GOING FOR NEW HIGHS AFTER STRONG BREAKOUTINDUSTOWER 416, now going for strong breakout of trendline resistance. Multiple pullback from support at 310 levels in last 16 months done. Time for breakout and make 52 week and all time highs. Trend is bullish on all timeframe.
Expected higher levels are 460 to 550 levels. Traders do exit below 39
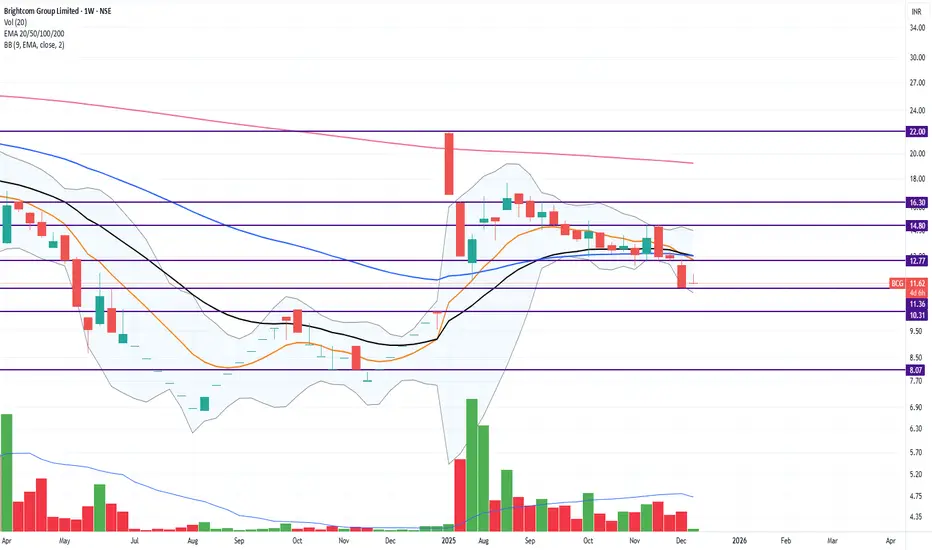
BCG a hidden GEM or a TrapBrightcom Group Ltd. shares are trading up approximately 5% on the NSE, outperforming the broader market after renewed buying interest from retail investors following ongoing speculation about corporate governance clean-up and potential business restructuring; the stock has traded between ₹11.56 and
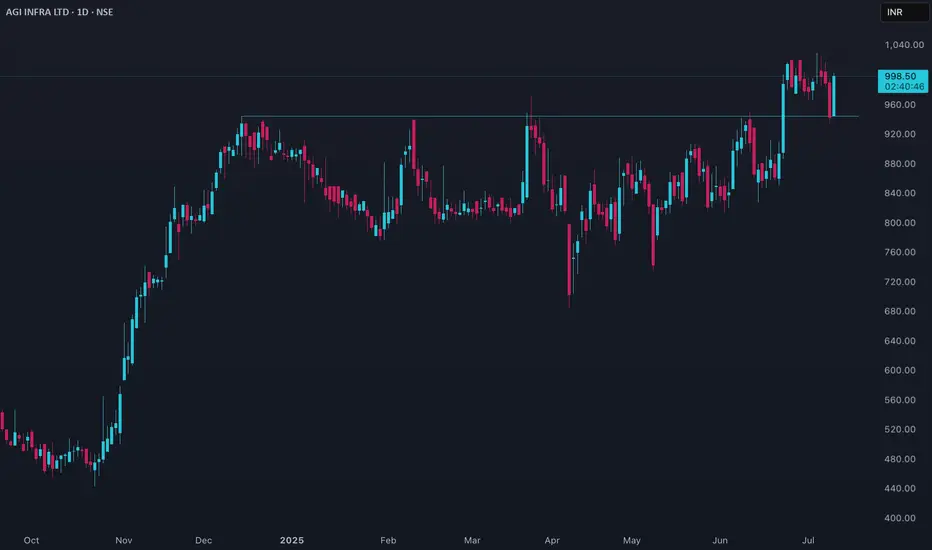
AGIIL Price Action#### Current Price and Performance
- AGI Infra Ltd (AGIIL) is trading near ₹990–₹1,000 as of early July 2025.
- The stock touched a 52-week high of around ₹1,030 and a low near ₹328, showing a strong upward trend over the past year.
- Over the last year, AGIIL has delivered a return of more than 11
See all stocks ideas
No scheduled reports
Today
J
JOCMInvicta Diagnostic limited
Exchange
NSE
Offer price
0.89 - 0.94
USD
Today
R
RAVELRAVELCARE LIMITED
Exchange
BSE
Offer price
1.36 - 1.44
USD
Today
S
SPEBSPEB Adhesives Ltd.
Exchange
NSE
Offer price
0.58 - 0.63
USD
Today
C
CSSLClear Secured Services Ltd.
Exchange
NSE
Offer price
1.40 - 1.48
USD
Tomorrow
T
TPVNeochem Bio Solutions Ltd.
Exchange
NSE
Offer price
1.04 - 1.09
USD
Tomorrow
EMASHelloji Holidays Limited
Exchange
BSE
Offer price
1.23 - 1.32
USD
Dec 10
N
NYMTShri Kanha Stainless Limited
Exchange
NSE
Offer price
1.000
USD
Dec 10
3
320000Meesho Limited
Exchange
BSE
Offer price
1.17 - 1.23
USD
Dec 10
VIDYAWIRESVidya Wires Limited
Exchange
NSE
Offer price
0.53 - 0.58
USD
Dec 11
FGHWestern Overseas Study Abroad Limited
Exchange
BSE
Offer price
0.628
USD
See more events
Community trends
BTC Long Term ViewFollowing different long-term trendlines and trying to identify support and resistance levels.

BITCOIN 1HRSWING TRADE
- EARN WITH ME DAILY 10K-20K –
BITCOIN Looking good for Downside..
When it break level 88199 and sustain.. it will go Downside...
SELL @ 88199
Target
1st 83769
2nd 80539
Enjoy trading traders.. Keep add this STOCK in your watch list..
Big Investor are welcome..
Like this Post??? Hit

BTC/USDT – Bearish Rejection at Supply ZoneAnalysis (15m Timeframe):
Bitcoin is currently trading near the 0.5–0.618 Fibonacci retracement zone, where price has shown repeated rejection. The structure remains bearish, with lower highs forming under the descending trendline.
Price is also approaching a strong supply zone (₹90,100 – ₹90,300),

Attacking the $91k Supply Wall – Breakout SetupBitcoin is currently compressing just below a major area of liquidity. As illustrated on the chart, the $91,100 - $91,300 zone has acted as stubborn resistance, resulting in multiple distinct rejections over the recent period (marked by the red arrows).
Technical Analysis:
The Resistance (


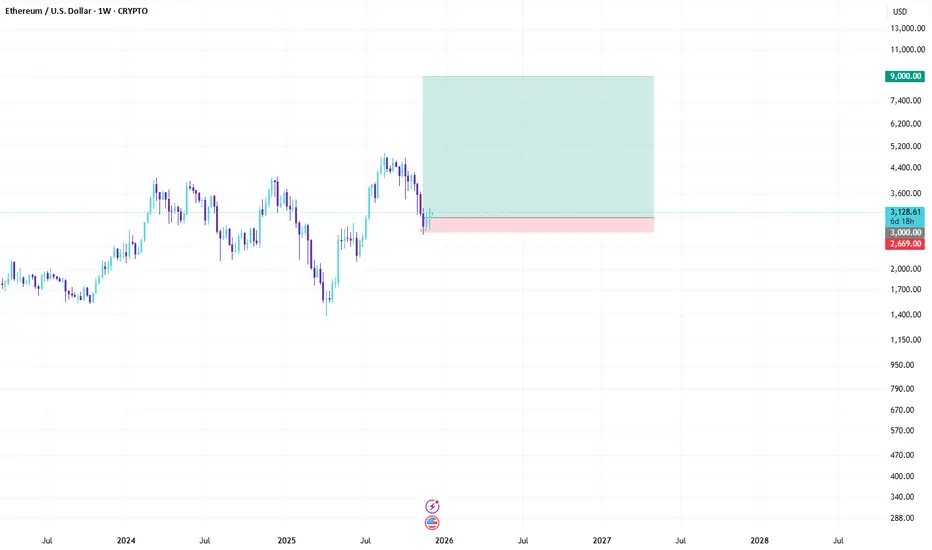
ETH Bullish Outlook: Tokenization Boom to $9K in 2026CRYPTO:ETHUSD
Asset: ETH/USD
Timeframe: Weekly
Hey traders! 🚀 Ethereum's dipping into December around $3,100 after some post-ATH consolidation, but the setup screams reversal. Fundstrat's Tom Lee is calling for a monster rally to $9,000 by 2026, fueled by tokenization exploding across finance. Th
PRICE ACTION ANALYSIS OF YOUR CHART (BTCUSDT)PRICE ACTION ANALYSIS OF YOUR CHART (BTCUSDT)
🟢 BUY SETUP (Bullish Scenario)
1️⃣ BUY ENTRY #1 — Break & Retest of 92,240 – 92,500 Zone
This zone is a major resistance.
A breakout above it confirms strong bullish momentum.
📌 ENTRY
Buy: 92,300 – 92,450
(After a breakout + retest candle, not inside

$SHIB HOLDERS: READ THIS BEFORE THE NEXT MOVE!CRYPTOCAP:SHIB HOLDERS: READ THIS BEFORE THE NEXT MOVE!
Shiba Inu is approaching one of the strongest historical support zones in its entire chart history… and every previous touch has triggered a massive impulsive rally.
Current Positioning
SHIB is trading ~91% below its ATH and ~82% below last

BTCUSDBitcoin is in a downtrend.
Currently falling off the supply zone, @106 lvl.
Will be monitoring closely the demand, other then that first low is logical target.

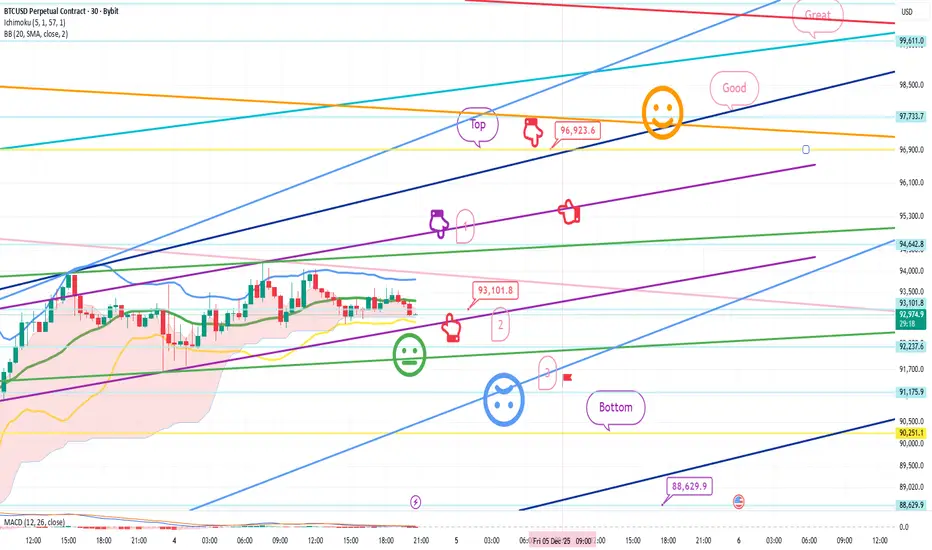
Bitcoin Bybit chart analysis December 4Hello
It's a Bitcoin Guide.
If you "follow"
You can receive real-time movement paths and comment notifications on major sections.
If my analysis was helpful,
Please click the booster button at the bottom.
This is a 30-minute Bitcoin chart.
It's not visible on the screen due to limited space,
See all crypto ideas
Gold Weekly Trend: XAU/USD Ready to SurgeGold Weekly Trend: XAU/USD Ready to Surge
Gold closes the week with a steady bullish profile, maintaining a structure that reflects strong positioning from larger market participants. The weekly flow shows a market that continues to rotate upward through liquidity pockets while holding firm during

Gold elliot wave updateGOLD – Elliott Wave Update
The major red Wave (3) appears complete, and Gold is now working through its Wave (4) correction.
Wave A seems to be in place, and the current recovery looks like Wave B, developing as a flat or expanded flat.
If price moves above the 1.618 extension of Wave A, the flat

Gold Trading Strategy for 08th December 2025📌 GOLD (XAUUSD) INTRADAY TRADE PLAN
BUY SETUP – Breakout Above 1-Hour Candle
Idea: Buy only if the price shows strength by breaking and closing above the 1-hour candle high.
🔹 Buy Conditions
Buy Above: $4,241
Condition: Wait for a strong 1-hour candle close above $4,241.
After the candle closes, ent

XAUSD/GOLD 4H SELL PROJECTION 07.12.251. Major Rejection Zone
Price tapped into the Huge Liquidity Collection Zone (yellow zone).
Strong rejection with bearish candlestick formations (Engulfing + Spinning Top).
2. Pattern Confirmation
Double Top formation at Resistance R1–R2.
Neckline broken and candle closed below – confirming tre

Weekly analysis Gold Multi RnR sell and Buy scenarioThis is weekly analysis of gold providing detailed analysis and educational topics i.e. ICT, Price action, support and resistance etc.
Note – if you liked this analysis, please boost the idea so that other can also get benefit of it.
Also follow me for notification for incoming ideas.
Also Fe

XAUUSD: The Bullish Pennant That Could Trigger the Next RallyHello everyone, what is your take on XAUUSD right now?
The 2 hour chart is becoming quite interesting. Price action is shaping a clean bullish pennant, a pattern that often suggests the market is building pressure for its next major move. After completing its corrective pullback, XAUUSD is beginnin

XAUUSD - Gold Spot US Dollar Technical Analysis🟢 BUY zones + buy confirmation levels
🔴 SELL zones + sell confirmation levels
🚫 NO-TRADE zone
🎯 TP (Take Profit) levels
🛑 SL (Stop Loss) levels
📌 Why buy / why sell (Price-Action logic)
✅ 1. NO-TRADE ZONE (as on chart)
The shaded middle area 4,150 – 4,210 is a NO-TRADE ZONE.
❌ Why no trade here?

Crude oil mcx still in range buy on dip 5150 amd sell 5420-5450Parameter Data Data
Asset Name Crude Oil MCX Futures (Dec 2025)
Last Traded Price (LTP) 🟢 ₹5,423.00/BBL (Reference: Dec 8, 2025)
Price Movement 🟢 Positive (Approx. +0.74% from previous close)
Current Trade 🟢 Expansion Phase (Bullish Breakout) Active
SMC Structure 🟢 Short-term Bullish (Decisive Break

XAGUSD – Clean Rejection From Discount Zone With Upside Silver reacted perfectly from a refined discount zone after a controlled pullback. The immediate rejection and push back above micro structure levels indicate bullish absorption and renewed momentum.
This reaction aligns with the broader HTF bullish narrative, suggesting price may continue expandin

Gold 1H – Will 4232 Trap Liquidity or 4170 Spark Expansion?🟡 XAUUSD – Intraday Smart Money Plan | by Ryan_TitanTrader (08/12)
📈 Market Context
Gold trades inside politically-driven liquidity as Donald Trump signals that the current method of tariffing through the US Supreme Court is “more direct, less cumbersome, and much faster.”
This introduces fresh unc

See all futures ideas
EURUSD MULTI TIMEFRAME ANALYSIS weekly bias: Bullish (targeting pwh)
1D bias : Bearish ( targeting pdl)
EU’s Last weekly close is bullish, but daily bias is still bearish. On 15m I’ve got an OTE + sweep + BOS + FVG, so I’m looking for a short from my marked level, targeting the previous daily low. If that low clears before Londo

GBP/CAD New UpdateLooks like GBP/CAD in heavy selling pressure after the Fundamental event for CAD on last week.
Earlier Thought process was 5th wave in the Diagonal pattern was not completed, but after the fundamental news, the pattern structure changed, now it seems there's an correction running for an start of an

GBPUSDGbpusd just tapped into the FVG and reacted perfectly. Until that imbalance gets violated or DXY shows real strength, I’m favoring longs on continuation.

USDJPYIt looks like price completed its objective just before Friday’s news release, after which USD dropped sharply. From a technical perspective, structure has flipped from bullish to bearish. A clean correction to the upside into the 148.0 supply zone followed by a drop would make perfect sense. I’ll b

EURUSD – Clean HTF Discount Zone Re-test With Bullish ContinuatiPrice has returned into a deep HTF discount zone, and the reaction from this area aligns well with my overarching bullish narrative. The marked zones represent the regions where I want to see LTF confirmational behavior before considering any long entries.
The structure remains intact as long as pr

usdjpy shortA major currency pair in forex that shows how many Japanese yen are needed to buy one US dollar. Traders watch it for interest-rate differences, risk sentiment, and Bank of Japan vs. Federal Reserve policy. It’s known for strong trends and volatility, especially around economic data release

USDINR Wave 5 Update | Elliott Wave Analysis | 8 Dec 2025🧠 Wave Structure
USDINR is currently progressing inside a clean Elliott Wave 5 advance.
Price remains strongly supported inside a rising parallel channel and continues respecting the trend structure.
Wave progression so far:
Wave 1 – Completed near ₹88.80
Wave 2 – Corrective low near ₹87.60
Wave 3

EURUSD_Analysis_15m_8_Dec15m swing is bullish
15m Internal is Bearish (But may be taken its Pullback)
If Internal high is in control -- then we may see sell opportunity
If swing Low is in control -- then we may buy opportunity

See all forex ideas
| - | - | - | - | - | - | - | - | ||
| - | - | - | - | - | - | - | - | ||
| - | - | - | - | - | - | - | - | ||
| - | - | - | - | - | - | - | - | ||
| - | - | - | - | - | - | - | - | ||
| - | - | - | - | - | - | - | - | ||
| - | - | - | - | - | - | - | - | ||
| - | - | - | - | - | - | - | - | ||
| - | - | - | - | - | - | - | - |
Trade directly on the supercharts through our supported, fully-verified and user-reviewed brokers.


