RR Kabel Ltd | Volume Area High Breakout Setup RR Kabel is currently trading above the Volume Area High, indicating strong acceptance at higher levels. Price is hovering near a key resistance zone and showing signs of a potential breakout with volume expansion.
Technical View:
Acceptance above VAH → bullish bias
Strong base formation afte

The best trades require research, then commitment.
Get started for free$0 forever, no credit card needed

Scott "Kidd" PoteetThe unlikely astronaut

Where the world does markets
Join 100 million traders and investors taking the future into their own hands.

Varun BeveragesDate 15.12.2025
Varun Beverages
Timeframe : Weekly Chart
About
(1) Varun Beverages has been associated with PepsiCo since the 1990s
(2) Operations spans 10 countries with franchise rights & distribution rights
Brands
(1) PepsiCo. franchised Brands - Pepsi, Tropicana, Slice, 7UP, Sting, Kurkure,

Nifty 50 Swing Trading setup - RRR 1:3Nifty swing trading setup analysis through Elliott wave Downside risk max 200 points target 600 point reaching possible on before 02/01/2026 maximum hold 2 weeks this setup useful for swing traders so go long at 25900-25800 Risk reward is good 1:3 Happy trading Journey

SJS looks like a good swing opportunitySJS enterprise has shown good strength in the recent volatile market. Strong closing above key EMA levels. Expecting prices to push higher as the stock is backed with strong fundamentals.

ICICIBANK – Bullish Setup (Short-Term)ICICIBANK – Bullish Setup (Short-Term)
ICICIBANK is showing strength and holding above key support.
Price action suggests a continuation move on the upside.
📈 Outlook: Bullish
🎯 Target: 1386 (short-term)
🛑 SL: Below recent swing low
Momentum looks positive; expecting price to move higher in the c

ACC | On the Verge of a Breakdown? | Daily Chart | Bearish Bias
📉 Summary
ACC has been compressing into a descending structure, forming Lower Highs since 24 April 2025, while holding Equal Lows near ₹1770 since 03 March 2025.
Repeated tests (4+ times) of the same support zone have reduced its strength, hinting at a potential breakdown setup.
Price action sugge

Angel One on the Edge: Long-Term Chart Points to 4800+The monthly chart of Angel One shows a well-defined broadening wedge pattern, where price has been repeatedly oscillating between a rising support line and a widening resistance zone. The structure has been forming for almost two years, indicating a long consolidation phase after a strong uptrend. C

HIND ZINC:At the verge of a Huge breakoutHIND ZINC:Trading at 545
Trading above all its Moving averages even in weekly chart with 10 DEMA Golden Cross over.
Formed a rounding bottom in weekly chart also.
Combination of the above suggests a move towards 600+(For educational purpose only)

Hdfc life Longattached chart is of hdfc life where the stock is trying to absorb the supply from the last 1 month around 770 levels. The stock is likely to move towards 800 levels in the coming session. We can attempt this one with the stop loss around 754 and entry around 770 levels.

Glenmark Pharma shows a strong uptrend with periodic correctionsGlenmark Pharma has been moving in a clear weekly uptrend where each strong rise has been followed by a period of consolidation before the next move. This sequence appears three times on the chart, marked as rally and correction phases.
After the most recent rise, price has entered a narrow downwar

See all editors' picks ideas
Multi-Ticker Anchored CandlesMulti-Ticker Anchored Candles (MTAC) is a simple tool for overlaying up to 3 tickers onto the same chart. This is achieved by interpreting each symbol's OHLC data as percentages, then plotting their candle points relative to the main chart's open. This allows for a simple comparison of tickers to tr

Vdubus Divergence Wave Pattern Generator V1The Vdubus Divergence Wave Theory
10 years in the making & now finally thanks to AI I have attempted to put my Trading strategy & logic into a visual representation of how I analyse and project market using Core price action & MacD. Enjoy :)
A Proprietary Structural & Momentum Confluence System

Per Bak Self-Organized CriticalityTL;DR: This indicator measures market fragility. It measures the system's vulnerability to cascade failures and phase transitions. I've added four independent stress vectors: tail risk, volatility regime, credit stress, and positioning extremes. This allows us to quantify how susceptible markets are

Volatility Risk PremiumTHE INSURANCE PREMIUM OF THE STOCK MARKET
Every day, millions of investors face a fundamental question that has puzzled economists for decades: how much should protection against market crashes cost? The answer lies in a phenomenon called the Volatility Risk Premium, and understanding it may fundam

Volume Gaps & Imbalances (Zeiierman)█ Overview
Volume Gaps & Imbalances (Zeiierman) is an advanced market-structure and order-flow visualizer that maps where the market traded, where it did not, and how buyer-vs-seller pressure accumulated across the entire price range.
The core of the indicator is a price-by-price volume prof

Match Finder [theUltimator5]Match Finder is the dating app of indicators. It takes your current ticker and finds the most compatible match over a recent time period. The match may not be Mr. right, but it is Mr. right now. It doesn't forecast future connection, but it tells you current compatibility for today.
Jokes aside,

Trend Line Methods (TLM)Trend Line Methods (TLM)
Overview
Trend Line Methods (TLM) is a visual study designed to help traders explore trend structure using two complementary, auto-drawn trend channels. The script focuses on how price interacts with rising or falling boundaries over time. It does not generate trade sign

Breakouts & Pullbacks [Trendoscope®]🎲 Breakouts & Pullbacks - All-Time High Breakout Analyzer
Probability-Based Post-Breakout Behavior Statistics | Real-Time Pullback & Runup Tracker
A professional-grade Pine Script v6 indicator designed specifically for analyzing the historical and real-time behavior of price after strong All-Ti

Count█ OVERVIEW
A library of functions for counting the number of times (frequency) that elements occur in an array or matrix.
█ USAGE
Import the Count library.
import joebaus/count/1 as c
Create an array or matrix that is a `float`, `int`, `string`, or `bool` type to count elements from, t

Holographic Market Microstructure | AlphaNattHolographic Market Microstructure | AlphaNatt
A multidimensional, holographically-rendered framework designed to expose the invisible forces shaping every candle — liquidity voids, smart money footprints, order flow imbalances, and structural evolution — in real time.
---
📘 Overview
The Hol

See all indicators and strategies
Community trends
ICICIBANK – Bullish Setup (Short-Term)ICICIBANK – Bullish Setup (Short-Term)
ICICIBANK is showing strength and holding above key support.
Price action suggests a continuation move on the upside.
📈 Outlook: Bullish
🎯 Target: 1386 (short-term)
🛑 SL: Below recent swing low
Momentum looks positive; expecting price to move higher in the c
SJS looks like a good swing opportunitySJS enterprise has shown good strength in the recent volatile market. Strong closing above key EMA levels. Expecting prices to push higher as the stock is backed with strong fundamentals.
RR Kabel Ltd | Volume Area High Breakout Setup RR Kabel is currently trading above the Volume Area High, indicating strong acceptance at higher levels. Price is hovering near a key resistance zone and showing signs of a potential breakout with volume expansion.
Technical View:
Acceptance above VAH → bullish bias
Strong base formation afte
Varun BeveragesDate 15.12.2025
Varun Beverages
Timeframe : Weekly Chart
About
(1) Varun Beverages has been associated with PepsiCo since the 1990s
(2) Operations spans 10 countries with franchise rights & distribution rights
Brands
(1) PepsiCo. franchised Brands - Pepsi, Tropicana, Slice, 7UP, Sting, Kurkure,
PowerGrid – A Steady Dividend GiantPowerGrid has consistently rewarded investors with strong dividend payouts, backed by stable cash flows from its transmission business. The chart reflects resilience even in volatile markets, making it a reliable choice for long-term dividend income seekers. With government backing and steady expans

My BSE Intraday Short Trade Setup — 08 Dec 2025After a successful intraday win on 05 Dec 2025, where 30 points were captured in BSE, I have decided to post my intraday trade setups daily with full transparency and structure.
Staying consistent with the same rules and discipline, BTR Auto Buy/Sell Indicator has now identified another high-probab

Bajaj Finance: Impulse Complete, Correction in ControlBajaj Finance completed a clean five-wave impulsive advance , topping out near ₹1,102.5 , followed by a clear loss of momentum. Since that peak, price action has shifted from trend to overlap , signaling a corrective phase rather than continuation.
Structurally, the decline is unfolding withi

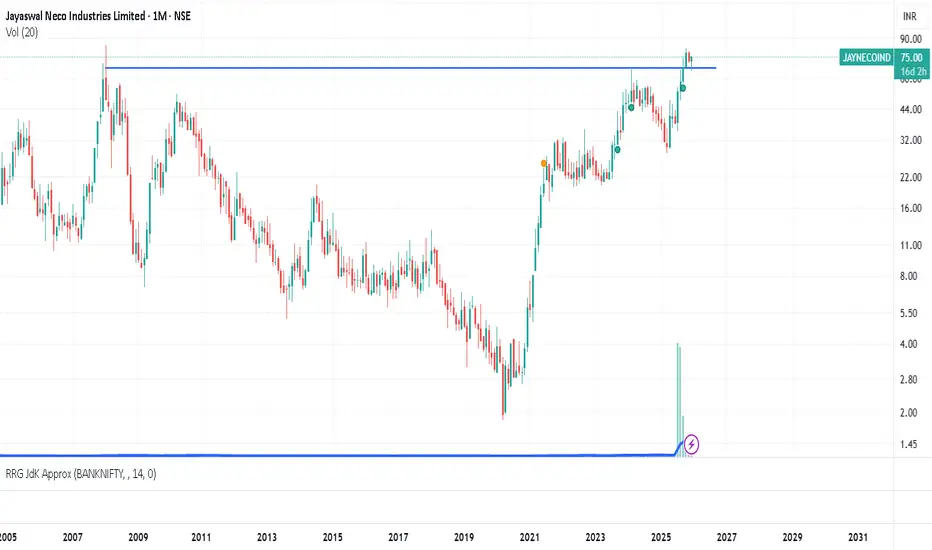
JAYNRCOIND : 17 year's multi year breakout with retest. Clear multi-year breakout with huge volume in the monthly chart & weekly chart. Minimum upside 65% possible.
A high prob reversal zoneHindzinc CMP - 564.25
Elliott- the entire rally is a complicated one. The second abc rally is done and has come to an important resistance zone on the chart. Hence the probability that its the end of wave B is very very high.
Fibs- the rally has halted at fib confluence at 571.
Pivot- the curr

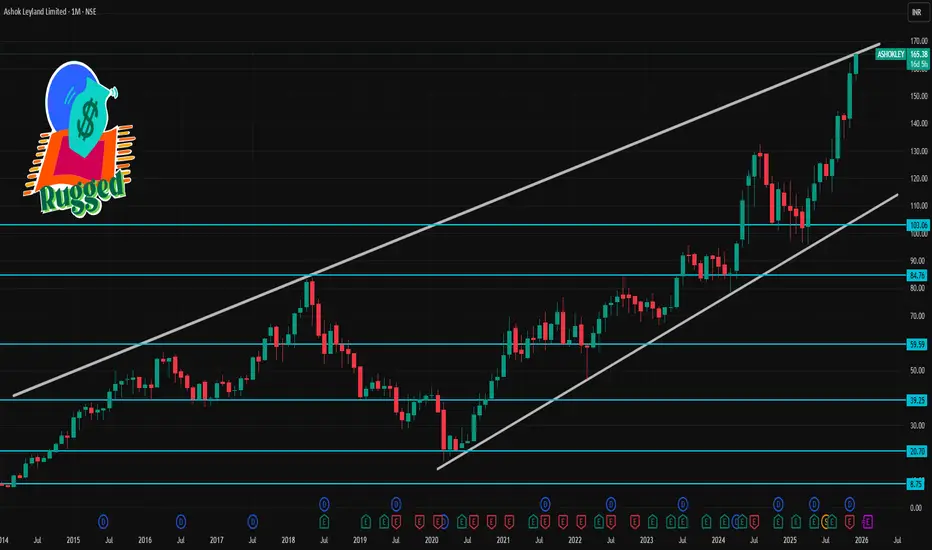
ASHOKLEY 1 Month Time Frame 📊 Current Price & Trend (as of latest market close)
Current trading level: ~₹163‑164 on NSE.
Price has rallied strongly and recently hit a 52‑week/all‑time high.
📈 1‑Month Key Levels (Short‑Term Technicals)
🔹 Immediate Resistance (Upside Targets)
R1 ~ ₹165‑167: Short‑term pivot resistance z
See all stocks ideas
No scheduled reports
Tomorrow
5
544520Shipwaves Online Limited
Exchange
BSE
Offer price
0.140
USD
Tomorrow
5
544555Park Medi World Limited
Exchange
BSE
Offer price
1.792
USD
Tomorrow
2
2539Nephrocare Health Services Limited
Exchange
BSE
Offer price
5.088
USD
Dec 18
PANRHRS Aluglaze Ltd.
Exchange
BSE
Offer price
1.04 - 1.07
USD
Dec 19
S
SHOTAshwini Container Movers Limited
Exchange
NSE
Offer price
1.49 - 1.57
USD
Dec 19
E
EXIMROUTESExim Routes Limited
Exchange
NSE
Offer price
0.92 - 0.97
USD
Dec 22
2
2651Neptune Logitek Ltd.
Exchange
BSE
Offer price
1.402
USD
Dec 23
N
NVFYKSH International Ltd.
Exchange
BSE
Offer price
4.06 - 4.27
USD
Dec 24
5
544512Marc Technocrats Ltd.
Exchange
NSE
Offer price
0.98 - 1.03
USD
See more events
Community trends
BTC Bullish or Bearish
1 Hour Scenario:
Price is consolidating inside a symmetrical triangle (yellow trendlines). BTC is sitting near $89,300, just above the lower ascending support. EMA 100 (~$90,500) is acting as resistance. Volume is dropping, indicating a potential breakdown soon.
1 Day scenario:
BTC is struggling

DIOGONAL BREAK DOWN OF ETHERIUMETHUSD – Ending Diagonal Completed, Wave 5 Reversal Underway
Ethereum has completed a classic ending diagonal at the top of Wave (5), and the structure has now broken down exactly as expected.
Price action showed:
Clear loss of momentum near the upper diagonal boundary
A final push that failed t

itcoin (BTC/USD) Daily Chart: Downtrend Pressure with Early Stab
Trend: BTC is still trading below a clear descending trendline, confirming a broader bearish structure since the mid-year highs. Lower highs and lower lows remain intact.
Price Action: Current price is around $90,160, consolidating after a sharp sell-off in November. This looks like a pause or ba

XAUUSD GOLD Analysis on Weekly#XAUUSD UPDATEDE
Current price - 4299
Buy Limited - 4280-4270
If price stay above 4252 then next target ,4330,4350 and 4380 and below that 4220
Plan;If price break 4280-4270 area,and stay above 4280,we will place buy order in gold with target of 4330,4350 and 4380 & stop loss should be placed at

BTCUSD preparing for fallBTCUSD daily RSI could not cross 50 mark and going downwards, while its 4H rSI has started going below daily RSI, it indicates a fall is close.
Expecting a fall below its earlier support and in range of 70-76k
Bitcoin - Elliott Wave Analysis - weekly TFHallo crypto traders bitcoin completed Expanding leading diagonal pattern in grand super cycle degree now in correction phase so wait for long fib ret 61.8% level then big move starts (wave 3)

"BTCUSD WARNING THIS IS NOT A DIP… A MAJOR DROP IS COMING”⚠️ BTC MARKET WARNING – HIGH RISK ZONE AHEAD 🚨
This is not a normal analysis.
This is a clear market warning.
CRYPTO:BTCUSD is showing strong bearish signals on the higher timeframe, and ignoring these signs could be extremely costly. The chart clearly suggests that the market is preparing for

BTC Weekly Downtrend
BTC has moving in a downtrend trend on weekly chartand soon moving to the 50% retracement level at 70.8k
further down is 58.4 - 48k zone
its a high probablility zone for a weekly bullish reversal to take place as it will the long consolidation of buyers.

ethereum longs activated im in long manage your riskim in eth longs from this level of entry and long targets risk your capital that ytou can lose and make profits as your levels its just a trade idea thats it

Bitcoin Miner Set UP As big companies slow down their Bitcoin buying, Bitcoin miners are quietly stepping into the spotlight.
According to BitcoinTreasuries.net, mining companies now hold 12% of all corporate Bitcoin reserves. Instead of selling what they mine, many are holding Bitcoin on their balance sheets, showing

See all crypto ideas
Waiting for OB Reaction to Confirm the Next Move◆ Market Context (M30)
Price swept sell-side liquidity around 4,349–4,350 but failed to hold, indicating weakening buying pressure in premium. With a prior liquidity sweep at the lows and a bullish BOS, the current move is likely a rebalancing phase after liquidity absorption.
◆ SMC & Price Action

GOLD ShortGold (XAUUSD) Trade Recap 🟡
Entry: 4338.00
Stop Loss: 4348.00
Target: 4275.00
Position: Sell
Risk: Fixed & defined
Outcome: Running / Planned execution
Clean execution. Levels respected. Trade managed as planned.
#XAUUSD #GoldTrade #TradeRecap #ForexTrading #TradingView #RiskManagement

Gold Today: Dip-Buy or Breakout Setup on XAU/USDIdea 1 — Buy the Dip (Conservative)
Entry: Break above short-term pullback support
Trigger: Price finds support near key levels and RSI stabilizes from oversold conditions
Target: Near recent local swing high
Stop-Loss: Just below today’s low
Rationale: Buying pullbacks in an overall uptrend red

Gold Trading Strategy for 15th December 2025Gold Trading Plan – Intraday & Scalping
🟡 GOLD (XAU/USD) – Intraday Trading Plan 💰
📈 BUY SETUP (Bullish Scenario)
🟢 Condition:
Buy above the HIGH of the 1‑Hour candle
Candle must CLOSE above 4326
🎯 Targets:
Target 1: 4338 💵
Target 2: 4349 💵
Target 3: 4360 💵
🛑 Stop Loss (Suggested):
Below the 1‑Hour

XAUUSD – Lana waits for reaction at resistance, focuses on ...XAUUSD – Lana waits for reaction at resistance, focuses on zone-based trading
Quick Summary
Context: Early in the week with many high-impact news events. Gold opened strong and is now approaching a major resistance area.
Timeframe: H1
Strategy: No chasing price. Prefer waiting to buy at liquidity

Natural gas updated levels, if 395&400 break then uptrend startParameter Data Data
Asset Name Natural Gas Futures (MCX)
Price Movement 🟨 Technical Bounce/Mild Bullish (₹381.2 / +1.25% Live)
Current Trade 🟥 SELL ON RISE (Focus on short-term technical resistance)
SMC Structure 🟥 Bearish Order Flow (कीमतें 20-DEMA से नीचे हैं)
Trap/Liquidity Zones 🟥 Supply/Trap Zo

Chumtrades XAUUSD Trading PlanMarket Context
During Friday’s session, after the previous range breakout, the market saw strong profit-taking pressure from buyers.
Large capital exits triggered a sharp sell-off of ~96 prices, while the 426X base zone supported price very well.
Overall structure remains bullish.
👉 Session Expecta

XAUUSD Technical Analysis (1H Timeframe)📊 XAUUSD Technical Analysis (1H Timeframe)
🔹 Trend Overview
Overall Bias: Bullish
Price continues to trade in a higher high–higher low structure
Strong trend continuation with no confirmed reversal pattern yet
📈 Indicator Analysis
EMA / VWAP Band
Price is holding above the EMA–VWAP band, indic

GOLD 4H | Liquidity Harvest Done… Now the Slide BeginsPrice engineered liquidity above the previous swing high and immediately delivered a sharp rejection, confirming a buy-side liquidity grab and the start of distribution.
Structure has now shifted bearish with a clear BOS from the premium zone. I’m expecting a mitigation leg before continuation lowe
XAUUSD H4 Medium Term Rising Channel and Key Liquidity ZonesXAUUSD H4 – Medium-Term Rising Channel and Key Liquidity Zones
Gold reacted sharply after touching the trendline, with the primary focus next week on buying pullbacks in line with the dominant trend
PRIORITY SCENARIO – MAIN STRATEGY
Trend-following buy strategy on a corrective move into key suppo

See all futures ideas
AUD/CAD Bullish in Daily time frameTechnically : AUD/CAD is technically ready for bullish move. As the wave 1( impulse) followed by wave 2 (Correction), Wave 3 (impulse), followed by wave 4(Correction). Wave 5 Start will be determined by Fundamental connection.
Fundamental Data : CAD CPI will be published tomorrow. Based on the re

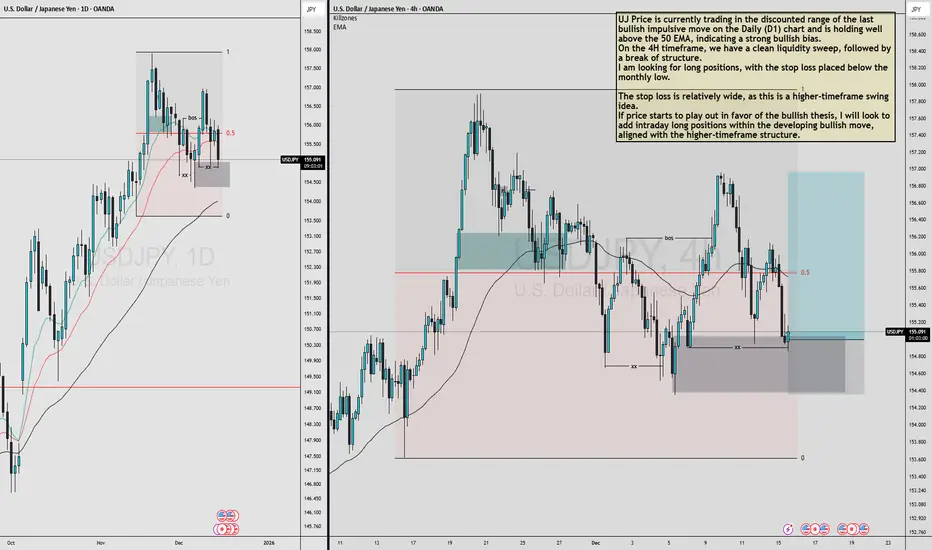
USDJPY MULTI TIMEFRAME ANALYSIS UJ Price is currently trading in the discounted range of the last bullish impulsive move on the Daily (D1) chart and is holding well above the 50 EMA, indicating a strong bullish bias.
On the 4H timeframe, we have a clean liquidity sweep, followed by a break of structure.
I am looking for long posit
AUDCHF
Massive AOI in daily TF.
impulsive brake and come to retest the previous structure.
1. in daily TF:- After long time finaly brake the consodetion.
Become bearish to bullish.
2. in 4h TF:- Come for retesting the AOI or previous structore.
Wating for (CHOCH) change of carectore.

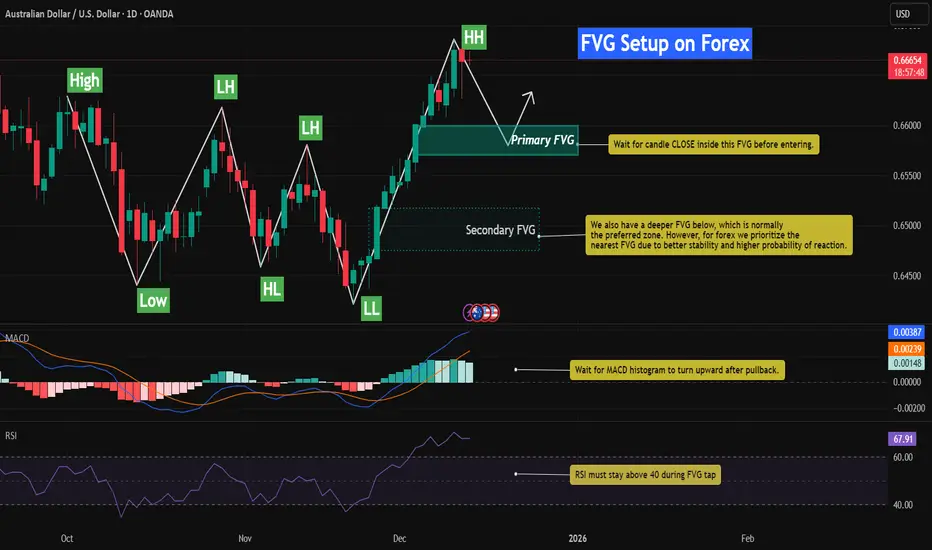
Bullish FVG Retracement With RSI & MACD📈 AUDUSD – Bullish FVG Retracement With RSI & MACD Momentum Confluence
This chart highlights a well-defined bullish structure on AUDUSD, characterized by a sequence of Higher Lows (HL) followed by a clean Higher High (HH). The latest impulsive leg upward created multiple Fair Value Gaps (FVGs), ea
USDJPY LONGprice came to retest the daily demand area and gave a ltf confirmation on 15.
study the reaction at marked levels

NZDUSD Short | 15m | Structural Breakdown After ExhaustionNZDUSD showed a clear loss of momentum after an extended upside leg. Price consolidated near the highs with diminishing impulsiveness, forming a distribution-style structure. The break back below the micro-range support confirmed weakness.
The short entry is based on:
• Rejection from the intraday

Eur cad trade A good resistance in EurCad if this resistance break and up move continue the good trade we will capture focus on level and patiencly wait for level breakthrough

usdjpy shortA major currency pair in forex that shows how many Japanese yen are needed to buy one US dollar. Traders watch it for interest-rate differences, risk sentiment, and Bank of Japan vs. Federal Reserve policy. It’s known for strong trends and volatility, especially around economic data release

USDINR Wave 5 Update | Elliott Wave Analysis | 8 Dec 2025🧠 Wave Structure
USDINR is currently progressing inside a clean Elliott Wave 5 advance.
Price remains strongly supported inside a rising parallel channel and continues respecting the trend structure.
Wave progression so far:
Wave 1 – Completed near ₹88.80
Wave 2 – Corrective low near ₹87.60
Wave 3

See all forex ideas
| - | - | - | - | - | - | - | - | ||
| - | - | - | - | - | - | - | - | ||
| - | - | - | - | - | - | - | - | ||
| - | - | - | - | - | - | - | - | ||
| - | - | - | - | - | - | - | - | ||
| - | - | - | - | - | - | - | - | ||
| - | - | - | - | - | - | - | - | ||
| - | - | - | - | - | - | - | - | ||
| - | - | - | - | - | - | - | - |
Trade directly on Supercharts through our supported, fully-verified, and user-reviewed brokers.


