Long term analysis of Tanla Platforms Ltd.Wrap up:-
As per chart of Tanla Platforms Ltd., it seems that correction in Tanla is over with a wxy pattern in major wave 2 and also, after breakout it has retested the support. Now, major wave 3 is about to start/started.
What I’m Watching for 🔍
As initial breakout is confirmed for a probabl

The best trades require research, then commitment.
Get started for free$0 forever, no credit card needed

Scott "Kidd" PoteetPolaris Dawn astronaut

Where the world does markets
Join 100 million traders and investors taking the future into their own hands.

Understanding the Down Trend Line Breakout : Base chart GALLANTTUnderstanding the Down Trend Line Breakout : Base chart GALLANTT ISPAT Ltd
Introduction
Gallantt Ispat Limited, currently trading around 580.00 on its daily chart, has been moving below a persistent down trend line since August 2025. Recently, the stock has shown signs of strength by forming a doubl

JK Tyre & Industries Ltd – Weekly Chart Breakout WatchJK Tyre & Industries Limited is currently showing strong momentum, and the price action suggests that the stock may be approaching a fresh breakout above the ₹554 level.
Since this analysis is based on the weekly timeframe, the primary focus will be on a weekly breakout and weekly closing above

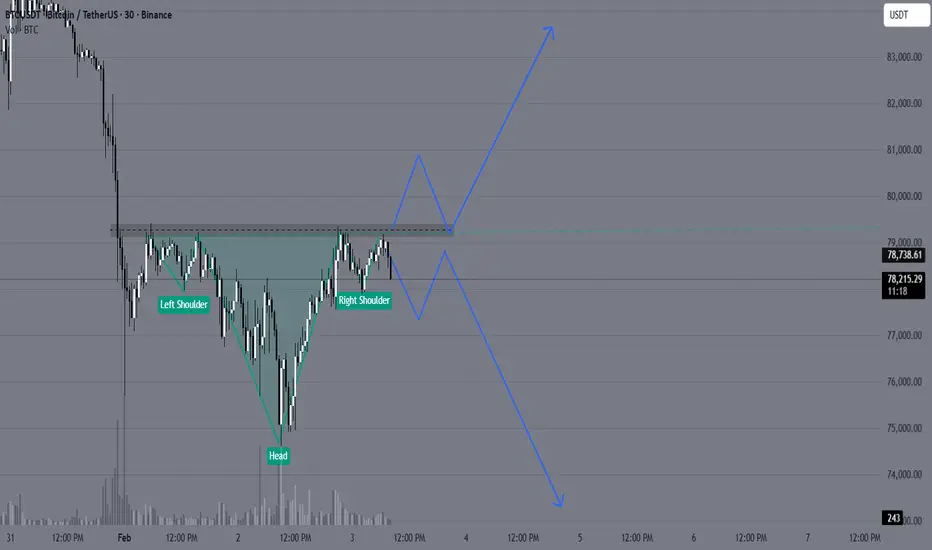
On the 1H chart, $BNB is forming a Head & ShouldersOn the 1H chart, CRYPTOCAP:BNB is forming a Head & Shoulders after a strong sell-off from the 900+ region.
Left Shoulder: ~785–790
Head: ~728 (marked low on chart)
Right Shoulder: ~770–775
Neckline / Supply Zone: 780–785
Current price is trading below the neckline, which keeps the structure

Varun Beverages: Formation Near Support | Multi-Target Study📄 Description
Varun Beverages is currently trading near a strong long-term support zone around ₹440–₹450, where price has formed a stable base after a prolonged correction.
The chart shows a descending trendline breakout attempt along with consolidation near Fibonacci support (0–0.22 zone), indica

BTCUSD might give Structure Shift Now✅ Pattern: Potential Inverse Head & Shoulders
Look closely:
Left dip → around 76.8k
Deep dip (Head) → around 75k
Right dip → higher low near 76.5k
Now price is pushing back up
This is a classic reversal structure.
✅ Important Level: Neckline Resistance
The dotted zone you marked around:
79,
Texas Instruments breaks into price discovery above ATH1 Trend is constructive and the breakout came after a long base, not a random spike
2 The old high was reached, tested, then broken, now price is in discovery
3 The key is whether the market can hold above the breakout zone and stay accepted there
4 Pattern labels are visual context only, they are n

TRADINGVIEW IS LOOKING FOR A NEW INDIAN REGION MODERATOR!Join Our Team: Exciting Opportunity to Become a Moderator for the Indian Region Community at TradingView!
Hello TradingView Enthusiasts,
Are you passionate about trading and the TradingView platform? We are on the lookout for a new moderator to join our INDIAN REGION Community and help elevate th

Market Outlook & Trade Setup – Monday, 2nd Feb 2026Major indices corrected heavily yesterday during the Budget announcement due to the increase in STT in F&O and no respite in LTCG.
Nifty, Sensex and Bank nifty went minus by almost 500,1200 and 1500 points respectively. We expect the selling to continue further. Additionally, the selling in metals c

PTL Trade SetupCurrent Market Price (CMP): 41.50
Breakout Context: Consolidation breakout confirmed yesterday with strong volume, which adds conviction.
Target: 46.62 (approx. +12.3% from CMP)
Stop Loss: 40.03 (risk of about -3.5% from CMP)
Key Notes
- A breakout with volume often signals genuine momentum, but

See all editors' picks ideas
Smart Trader, Episode 03, by Ata Sabanci, Candles and TradelinesA volume-based multi-block analysis system designed for educational purposes. This indicator helps traders understand their current market situation through aggregated block analysis, volumetric calculations, trend detection, and an AI-style narrative engine.
━━━━━━━━━━━━━━━━━━━━━━━━━━━━━━━━━━━━━━━

Asset Drift ModelThis Asset Drift Model is a statistical tool designed to detect whether an asset exhibits a systematic directional tendency in its historical returns. Unlike traditional momentum indicators that react to price movements, this indicator performs a formal hypothesis test to determine if the observed d

Hyperfork Matrix🔱 Hyperfork Matrix 🔱 A manual Andrews Pitchfork tool with action/reaction propagation lines and lattice matrix functionality. This indicator extends Dr. Alan Andrews' and Patrick Mikula's median line methodology by automating the projection of reaction and action lines at equidistant intervals, cr

Arbitrage Matrix [LuxAlgo]The Arbitrage Matrix is a follow-up to our Arbitrage Detector that compares the spreads in price and volume between all the major crypto exchanges and forex brokers for any given asset.
It provides traders with a comprehensive view of the entire marketplace, revealing hidden relationships among d

Wyckoff Schematic by Kingshuk GhoshThe "Wyckoff Schematic" is a Pine Script indicator that automatically detects and visualizes Wyckoff Method accumulation and distribution patterns in real-time. This professional tool helps traders identify smart money movements, phase transitions, and critical market structure points.
Key Features

Volume Cluster Profile [VCP] (Zeiierman)█ Overview
Volume Cluster Profile (Zeiierman) is a volume profile tool that builds cluster-enhanced volume-by-price maps for both the current market window and prior swing segments.
Instead of treating the profile as a raw histogram only, VCP detects the dominant volume peaks (clusters) insid

DeeptestDeeptest: Quantitative Backtesting Library for Pine Script
━━━━━━━━━━━━━━━━━━━━━━━━━━━━━━━━━━
█ OVERVIEW
Deeptest is a Pine Script library that provides quantitative analysis tools for strategy backtesting. It calculates over 100 statistical metrics including risk-adjusted return ratios (Sharpe

Arbitrage Detector [LuxAlgo]The Arbitrage Detector unveils hidden spreads in the crypto and forex markets. It compares the same asset on the main crypto exchanges and forex brokers and displays both prices and volumes on a dashboard, as well as the maximum spread detected on a histogram divided by four user-selected percenti

Multi-Distribution Volume Profile (Zeiierman)█ Overview
Multi-Distribution Volume Profile (Zeiierman) is a flexible, structure-first volume profile tool that lets you reshape how volume is distributed across price, from classic uniform profiles to advanced statistical curves like Gaussian, Lognormal, Student-t, and more.
Instead of forcin

Multi-Ticker Anchored CandlesMulti-Ticker Anchored Candles (MTAC) is a simple tool for overlaying up to 3 tickers onto the same chart. This is achieved by interpreting each symbol's OHLC data as percentages, then plotting their candle points relative to the main chart's open. This allows for a simple comparison of tickers to tr

See all indicators and strategies
Community trends
Understanding the Down Trend Line Breakout : Base chart GALLANTTUnderstanding the Down Trend Line Breakout : Base chart GALLANTT ISPAT Ltd
Introduction
Gallantt Ispat Limited, currently trading around 580.00 on its daily chart, has been moving below a persistent down trend line since August 2025. Recently, the stock has shown signs of strength by forming a doubl
Long term analysis of Tanla Platforms Ltd.Wrap up:-
As per chart of Tanla Platforms Ltd., it seems that correction in Tanla is over with a wxy pattern in major wave 2 and also, after breakout it has retested the support. Now, major wave 3 is about to start/started.
What I’m Watching for 🔍
As initial breakout is confirmed for a probabl
Final Stand at the ₹2645–₹2661 Resistance: Is TIINDIA Ready to FTube Investments of India (TIINDIA) is exhibiting a strong recovery structure after forming a Double Bottom near the 2170 level. The stock has shown significant momentum over the last 48 hours, surging nearly 8% on Feb 3rd and continuing its upward trajectory toward a critical resistance zone.
🗝️ K

IOC – Classic IHNS Pattern Showing Accumulation Before BreakoutThis chart is a textbook example of an Inverse Head and Shoulders pattern forming after a decline.
First, price made a low (left shoulder).
Then it dropped deeper and formed the head.
After that, it made a higher low (right shoulder), showing selling pressure is weakening.
Now price is consolidati

What is Multi confluence Strategy making ?In this video I am showcasing how to create multiple confluences and decrease the no of frequency of trades you get to filter out A+ setups .
I am using charts older than 3 months to showcase the same

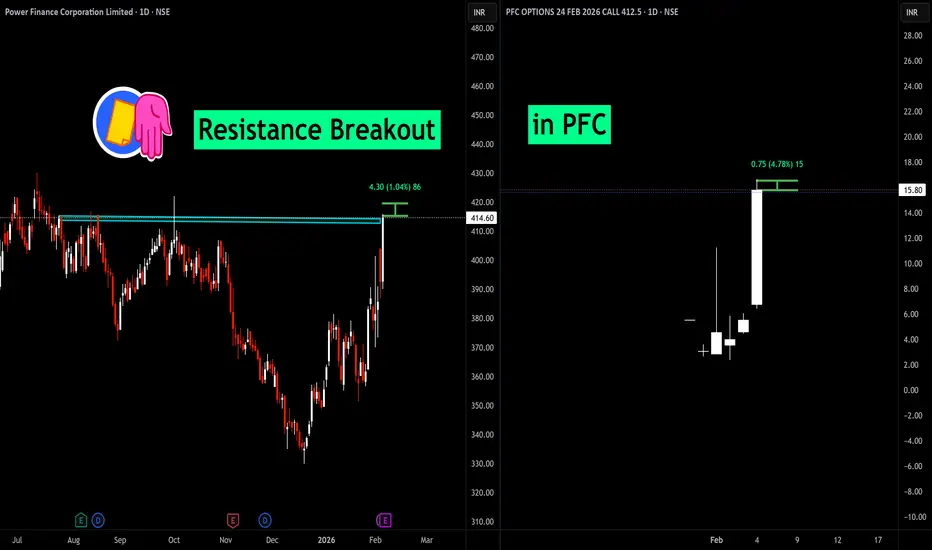
BUY TODAY SELL TOMORROW for 5% - BTST STOCK OPTIONDON’T HAVE TIME TO MANAGE YOUR TRADES?
- Take BTST Stock Option trades at 3:25 pm every day
- Try to exit by taking 4-7% profit of each trade
-Resistance Breakout in PFC
BUY TODAY, SELL TOMORROW for 5%
JK Tyre & Industries Ltd – Weekly Chart Breakout WatchJK Tyre & Industries Limited is currently showing strong momentum, and the price action suggests that the stock may be approaching a fresh breakout above the ₹554 level.
Since this analysis is based on the weekly timeframe, the primary focus will be on a weekly breakout and weekly closing above
Trent Ltd Cmp 3823 Bullish Engulfing Candle @ supportTrent Ltd Cmp 3823 dated 3-2-2026
Weekly chart (Positional)
1. Bullish Engulfing Candle @ support
2. RSI reversal
Buy above 3900 Sl 3600 target 4000-4200-4400-4500
it is just a view, please trade at your own risk.

Varun Beverages: Formation Near Support | Multi-Target Study📄 Description
Varun Beverages is currently trading near a strong long-term support zone around ₹440–₹450, where price has formed a stable base after a prolonged correction.
The chart shows a descending trendline breakout attempt along with consolidation near Fibonacci support (0–0.22 zone), indica
NTPC - Long• Price has moved above the middle Bollinger Band on the weekly chart. This shows the stock is shifting from sideways to bullish.
• The recent weekly candle is strong and moving toward the upper Bollinger Band. This tells us volatility is expanding on the upside, which usually supports further upsi

See all stocks ideas
Today
LEMONTREELemon Tree Hotels Ltd.
Actual
1.00
INR
Estimate
0.90
INR
Today
SOLARASolara Active Pharma Sciences Ltd.
Actual
—
Estimate
—
Today
CANTABILCantabil Retail India Limited
Actual
—
Estimate
—
Today
SAPPHIRESapphire Foods India Ltd.
Actual
—
Estimate
0.46
INR
Today
SANGHVIMOVSanghvi Movers Limited
Actual
—
Estimate
—
Today
STARCEMENTStar Cement Ltd.
Actual
—
Estimate
1.37
INR
Today
B
BESTAGROBest Agrolife Ltd.
Actual
—
Estimate
—
Today
ELECTCASTElectrosteel Castings Ltd.
Actual
—
Estimate
—
See more events
Community trends
On the support let's wait It's waiting on support let it show us something of either direction up or down

BITCOIN at High-Timeframe Demand: Reaction Zone in Play!When I look at this chart, I’m not seeing fear or structural damage.
I’m seeing price doing exactly what it should do after a distribution phase , revisiting demand and slowing down.
Bitcoin has come back into a clearly marked high-timeframe demand / reaction zone . This is not a random level. Th

Why Bitcoin’s Stability Is a Warning, Not StrengthBitcoin’s inability to participate in the recent “debasement trade” is not a sign of hidden strength — it’s a sign of waning relevance in the current macro cycle.
While gold and silver surged during the final euphoric phase, Bitcoin’s stagnation near $82,000 suggests that capital actively chose har

BTC 1D UpdateThe Hook: Is the floor finally in? $70k is the new battleground. 🩸📉
If you’re looking at your portfolio today, take a deep breath. Bitcoin has officially plunged below $71,000, hitting lows we haven't seen since early November 2024. We’ve wiped out over $500 billion in market cap this week alone, an

CALLED IT - Bitcoin $107K TO $66K (-40% DROP) 🚨 CALLED IT - $107K TO $66K (-40% DROP)
Remember my warning on October 18, 2025?
When everyone was screaming "TO THE MOON" at $107K, I showed you the bearish divergence and said:
"$104K breakdown could trigger a crash to $73K and $49K."
👉 RESULT: Bitcoin dropped from $107K → $66,700
That's -40% C

BTC Ichimoku 4H: Bears in Top Gear as Every Bull Reclaim FailsBTC Ichimoku 4H: Bears in Top Gear as Every Bull Reclaim Fails
This is one of those phases where Ichimoku structure becomes crystal clear and easy to read.
The Weekly HTF has broken down from the Kumo , establishing a clear bearish higher-timeframe bias.
Within that context, the 4H LTF ha

BTCUSD (1H) – Bearish Continuation | Trendline Breakdown IdeaMarket Structure
Bitcoin remains in a clear descending channel on the 1H timeframe. Price has consistently respected the downward sloping trendline, confirming a strong bearish structure with lower highs and lower lows.
Technical Confluence
Trendline Resistance (Red): Multiple rejections validate

BTC Price going down According to current uncertainty in the world market. In my opinion now BTC is going down and testing the support level. #btc

BTC/USD: Rebound from 2026 Lows – Path to $100K Re-Accumulation?Based on the detailed technical analysis: Bitcoin is showing signs of life after a sharp weekend flush that saw prices hit a fresh 2026 low near $74,500. My current analysis highlights a potential structural shift as we defend critical support levels and look to reclaim mid-range liquidity.
The Tec

Bitcoin Long Term Price Comes in unmitigated order flow tap inside order block after taking inducement

See all crypto ideas
SILVER Looks Sell for 27% downside Targets.Silver Chart looks very Bearish ... once it breaks last time low can slide till 54 Levels.
LTP - 75.5
Targets - 54
timeframe - 20-30 days.
Be Cautious.

whats next on Silver?Silver CMP $88
Elliott- this is the 3rd wave there is no doubt on that. The question is where will this 3rd wave get over. If in the next two months the precious metal cannot go past $145 then the last move was iii of 3.
Conclusion- in my view in the next two months silver will go past $145. So

Silver - Bear Flag + Rising WedgeSilver (XAGUSD) seems to be forming a Bear Flag & a Rising Wedge on shorter time frames - 4H, 1H, 15Min. Looking to short once the $84-$85 support is broken.

(Gold) 45-Minute Chart — Support Hold & Upside Retest Scenario
Chart Analysis:
Market Structure:
Gold is in a short-term corrective phase after a strong bearish impulse. Price made a lower low, then started forming higher lows, suggesting a potential short-term recovery within a broader downtrend.
Key Support Zone (Red):
The marked support around 4,850–4,900

XAUUSD / GOLD – 1H SELL PROJECTION (05-02-2026)
Gold was moving inside a rising channel, respecting the uptrend line.
However, price failed to sustain bullish momentum and clearly broke the uptrend, indicating a market structure shift.
After the breakdown:
Price retraced back into a Fair Value Gap (FVG)
The retracement got rejected near Resi

Bearish Pullback Into Resistance, Downside Target in FocusMarket Structure
Price previously made a strong impulsive drop, followed by a rounded bottom / corrective recovery.
That recovery looks corrective, not impulsive (overlapping candles, curved structure), suggesting a bearish continuation setup rather than a trend reversal.
Key Zones
Major Resista

#XAGUSD silver start falling from monday and forms A wave on 27jan then after it start rising in its B wave which is almost near to complete so we can expect a downfall in silver between 106-100 in the upcoming hours.

NIFTY LOOKS DOWNAS PER OI INTERESTS AND CHANGE IN CHARACTER IT LOOKS BEARISH when you see a spike in Open Interest (OI) alongside a negative Change in Character (CHoCH), the market is essentially signaling that new short sellers are aggressively entering the fray and the previous bullish structure has buckled. This

Crude oil idea for today 5 th FebHi traders if you missed 10:30 pm move . Here is the retracement. But is it a real retracement or complete reversal? Only time - candle pattern-volume can tell. So no fomo wait for right entry and accept the outcome. Always have Stoploss level.

SILVER : Make-or-Break Zone — Double Bottom vs. ABC “C” WaveSilver saw a sharp impulsive sell-off (black leg down), followed by a controlled corrective rebound inside an ascending channel (blue). Price then rejected from the upper channel boundary and broke down, shifting momentum back to the downside.
Now price is approaching a high-importance horizontal s

See all futures ideas
EURUSD | 15M | Smart Money Concept OutlookMarket Structure:
Price is currently delivering a short-term bullish repricing following a displacement from the internal range low near 1.1775. The sequence of higher highs and higher lows confirms an intraday shift in structure, suggesting that buy-side liquidity has been engineered to facilitate

USDCHF Is Not Weak – It’s Testing Support!USD/CHF is currently trading inside a well-defined rising channel, and the recent move lower looks more like a pullback into trend support rather than a breakdown.
For me, this is typical behavior in trending markets. Strong moves don’t continue in a straight line, price pulls back, tests support,

DAILY FOREX SCAN Session – 24 04 02 26Scanning multiple forex pairs to filter high-quality trade setups. No trades are forced—only structure-based opportunities.
Note: There may be a delay in this video due to upload processing time.
Disclaimer: FX trading involves high leverage and substantial risk, and losses can exceed your initial

GBPUSD looks bearish for the next few sessions!!ICT Concepts:
- Price swept BSL in Daily timestamp
- IFVG creation on daily showing bearish sentiment
- Daily candle delivering out of CE of the IFVG
- FVG sitting in discount should attract price lower
- Previous breakout region and OB should be the next price targets as mentioned in the chart

EURUSD - MY TRADE ON US OPENAlways Follow Your Set Up Or a+ Trade Set Up So That We Can Get Our Tp Hit Without Any Hustle. - Trade On Your Own Risk, This Is Only My Perspective Of Trade On My Own. Happy Trading Fellas.

GBP/AUD Analysis: Bearish Momentum Accelerates on Hawkish RBAFresh Selling Level_ At CMP
The GBP/AUD currency pair is experiencing significant selling pressure on the 1-hour timeframe as the Australian Dollar strengthens following a hawkish interest rate decision. The pair is currently trading at 1.95423, down approximately 0.58% from the daily open.

EURUSD SlidingI See EURUSD is sliding down with channel.
Fundamentals are also aligned with an Idea.

Long USDCAD Setup Looking to BUY USDCAD. Price is bouncing from a strong support zone with bullish momentum divergence, suggesting a potential reversal higher.

Expecting EurCHF bearish Why should we trust this idea 💡??Eur has 2.15% interest rate ,while chf is safe heaven currency so
it would shows always significant strength towards chf ,apart from that any Ongoing panic
global events will also cause CHF bullish with aligning the price action parameters by following liquidity 💲⚔

See all forex ideas
Trade directly on Supercharts through our supported, fully-verified, and user-reviewed brokers.


