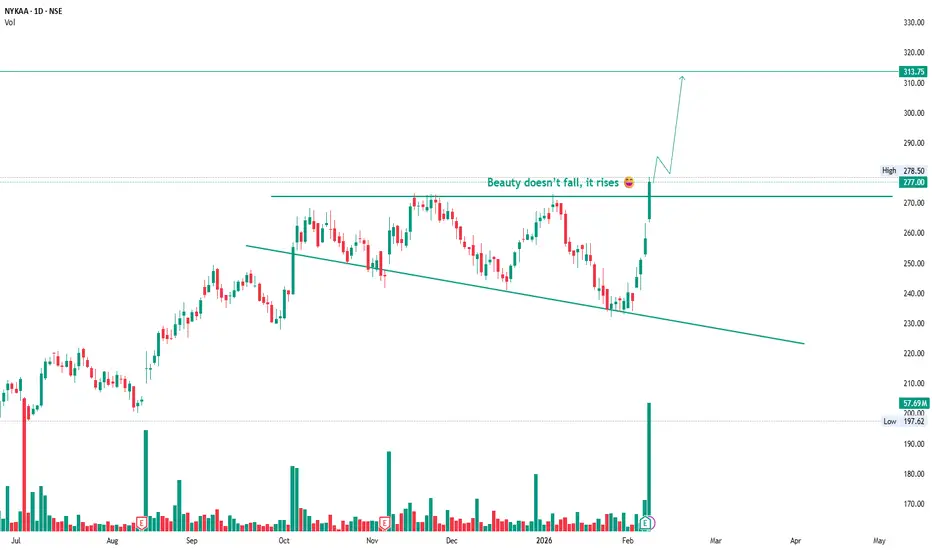
Nykaa: Descending Trendline BreakoutNykaa respected the rising structure even during the correction and never lost its trend strength.
Price held the sloping support, absorbed selling pressure, and then gave a clean breakout above the key horizontal resistance around 277 with strong volume.
This move shows acceptance above resistanc

The best trades require research, then commitment.
Get started for free$0 forever, no credit card needed

Scott "Kidd" PoteetPolaris Dawn astronaut

Where the world does markets
Join 100 million traders and investors taking the future into their own hands.
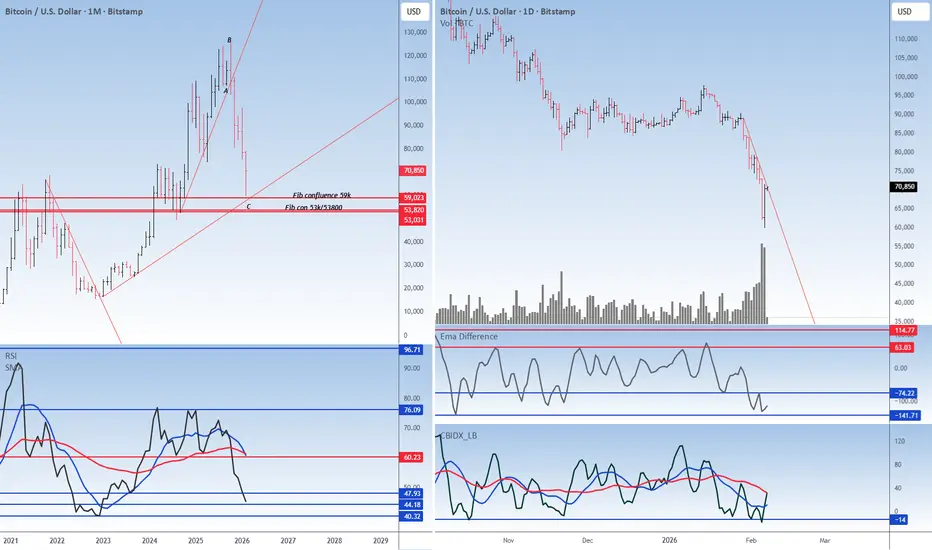
The crypto has found its supportBitcoin CMP $70690
The beauty of looking at various asset classes is that they rise and fall together. In my view the correction in the crypto is over.
Elliott- The v waves within the C wave is done. Hence to me this correction is over.
Fib- The crypto reversed just shy away from the 59K whic
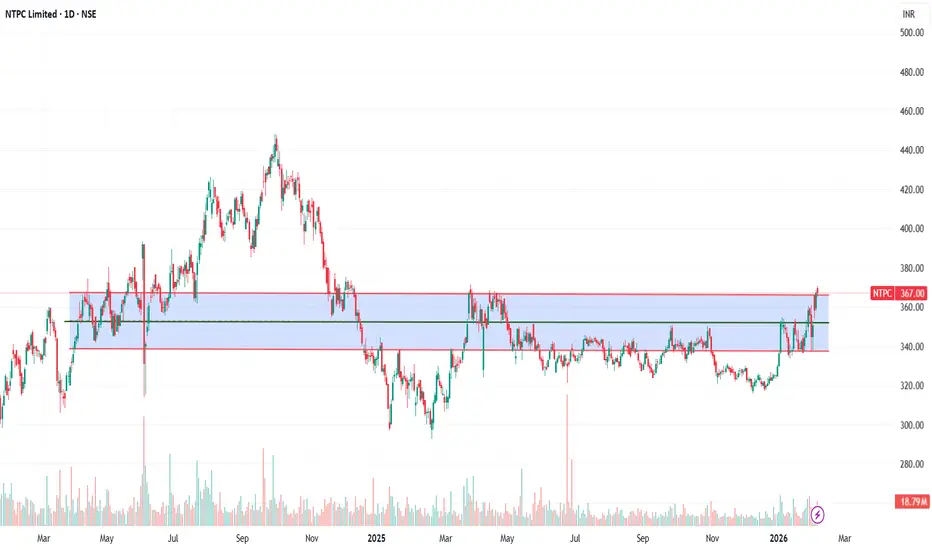
NTPC.. Moved outside the channel..NTPC.. Trying its level best to move.
Selling pressure in market pulled it back and retested the support.
Now things can be interesting..
Moved above this channel then first target can be somewhere around 370, the exact level from where it faced resistance today..
Second can be somewhere around
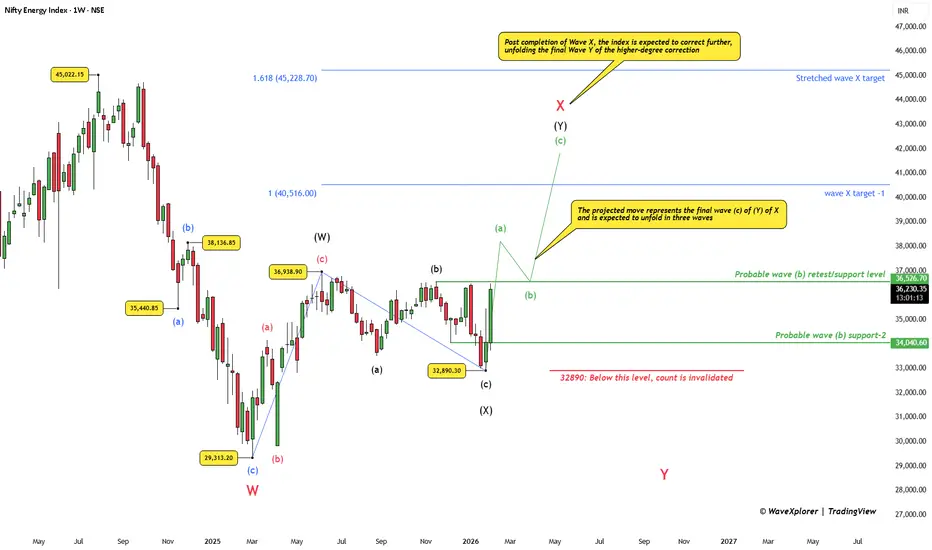
Nifty Energy: Final Bounce Before the Deeper CorrectionThe Nifty Energy Index continues to trade within a higher-degree corrective structure rather than a fresh impulsive uptrend.
The decline from the highs appears to have completed Wave W, followed by an ongoing recovery in Wave X.
In the near term, the structure allows for one more upside phase . A
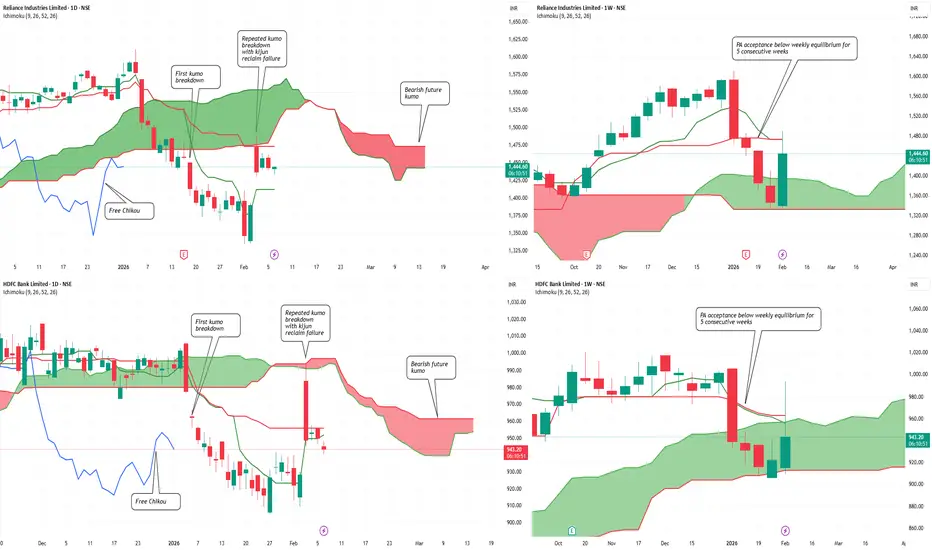
Dead Cat Bounce in Nifty? Heavyweights to Deliver The VerdictDead Cat Bounce in Nifty? Index Heavyweights to Deliver the Verdict Soon…
Both index heavyweights remain structurally weak despite the recent bounce.
On the daily timeframe, Reliance Industries and HDFC Bank have transitioned out of bullish Ichimoku regimes. Crucially, the second daily Kumo
Long term analysis of Tanla Platforms Ltd.Wrap up:-
As per chart of Tanla Platforms Ltd., it seems that correction in Tanla is over with a wxy pattern in major wave 2 and also, after breakout it has retested the support. Now, major wave 3 is about to start/started.
What I’m Watching for 🔍
As initial breakout is confirmed for a probabl

Understanding the Down Trend Line Breakout : Base chart GALLANTTUnderstanding the Down Trend Line Breakout : Base chart GALLANTT ISPAT Ltd
Introduction
Gallantt Ispat Limited, currently trading around 580.00 on its daily chart, has been moving below a persistent down trend line since August 2025. Recently, the stock has shown signs of strength by forming a doubl

JK Tyre & Industries Ltd – Weekly Chart Breakout WatchJK Tyre & Industries Limited is currently showing strong momentum, and the price action suggests that the stock may be approaching a fresh breakout above the ₹554 level.
Since this analysis is based on the weekly timeframe, the primary focus will be on a weekly breakout and weekly closing above

On the 1H chart, $BNB is forming a Head & ShouldersOn the 1H chart, CRYPTOCAP:BNB is forming a Head & Shoulders after a strong sell-off from the 900+ region.
Left Shoulder: ~785–790
Head: ~728 (marked low on chart)
Right Shoulder: ~770–775
Neckline / Supply Zone: 780–785
Current price is trading below the neckline, which keeps the structure

Varun Beverages: Formation Near Support | Multi-Target Study📄 Description
Varun Beverages is currently trading near a strong long-term support zone around ₹440–₹450, where price has formed a stable base after a prolonged correction.
The chart shows a descending trendline breakout attempt along with consolidation near Fibonacci support (0–0.22 zone), indica

See all editors' picks ideas
Smart Trader, Episode 03, by Ata Sabanci, Candles and TradelinesA volume-based multi-block analysis system designed for educational purposes. This indicator helps traders understand their current market situation through aggregated block analysis, volumetric calculations, trend detection, and an AI-style narrative engine.
━━━━━━━━━━━━━━━━━━━━━━━━━━━━━━━━━━━━━━━

Asset Drift ModelThis Asset Drift Model is a statistical tool designed to detect whether an asset exhibits a systematic directional tendency in its historical returns. Unlike traditional momentum indicators that react to price movements, this indicator performs a formal hypothesis test to determine if the observed d

Hyperfork Matrix🔱 Hyperfork Matrix 🔱 A manual Andrews Pitchfork tool with action/reaction propagation lines and lattice matrix functionality. This indicator extends Dr. Alan Andrews' and Patrick Mikula's median line methodology by automating the projection of reaction and action lines at equidistant intervals, cr

Arbitrage Matrix [LuxAlgo]The Arbitrage Matrix is a follow-up to our Arbitrage Detector that compares the spreads in price and volume between all the major crypto exchanges and forex brokers for any given asset.
It provides traders with a comprehensive view of the entire marketplace, revealing hidden relationships among d

Wyckoff Schematic by Kingshuk GhoshThe "Wyckoff Schematic" is a Pine Script indicator that automatically detects and visualizes Wyckoff Method accumulation and distribution patterns in real-time. This professional tool helps traders identify smart money movements, phase transitions, and critical market structure points.
Key Features

Volume Cluster Profile [VCP] (Zeiierman)█ Overview
Volume Cluster Profile (Zeiierman) is a volume profile tool that builds cluster-enhanced volume-by-price maps for both the current market window and prior swing segments.
Instead of treating the profile as a raw histogram only, VCP detects the dominant volume peaks (clusters) insid

DeeptestDeeptest: Quantitative Backtesting Library for Pine Script
━━━━━━━━━━━━━━━━━━━━━━━━━━━━━━━━━━
█ OVERVIEW
Deeptest is a Pine Script library that provides quantitative analysis tools for strategy backtesting. It calculates over 100 statistical metrics including risk-adjusted return ratios (Sharpe

Arbitrage Detector [LuxAlgo]The Arbitrage Detector unveils hidden spreads in the crypto and forex markets. It compares the same asset on the main crypto exchanges and forex brokers and displays both prices and volumes on a dashboard, as well as the maximum spread detected on a histogram divided by four user-selected percenti

Multi-Distribution Volume Profile (Zeiierman)█ Overview
Multi-Distribution Volume Profile (Zeiierman) is a flexible, structure-first volume profile tool that lets you reshape how volume is distributed across price, from classic uniform profiles to advanced statistical curves like Gaussian, Lognormal, Student-t, and more.
Instead of forcin

Multi-Ticker Anchored CandlesMulti-Ticker Anchored Candles (MTAC) is a simple tool for overlaying up to 3 tickers onto the same chart. This is achieved by interpreting each symbol's OHLC data as percentages, then plotting their candle points relative to the main chart's open. This allows for a simple comparison of tickers to tr

See all indicators and strategies
Community trends
Nykaa: Descending Trendline BreakoutNykaa respected the rising structure even during the correction and never lost its trend strength.
Price held the sloping support, absorbed selling pressure, and then gave a clean breakout above the key horizontal resistance around 277 with strong volume.
This move shows acceptance above resistanc
GRWRHITECH: Descending Triangle Breakout, Chart of the WeekDouble Bottom or Dead Cat Bounce? Why Garware's Next Move Could Make or Break Your Portfolio. From ₹5,378 to ₹2,600:How a 38% Profit Crash and 50% US Tariffs Brought This Market Leader to Its Knees, and what changed now? Let's Understand in the "Chart of the Week"
As per the Latest SEBI Mandate,

Suzlon Energy: Valuation Reset Done — Direction PendingBefore looking at the chart, it helps to understand what the business is doing.
Suzlon’s recent fundamentals suggest stabilization rather than stress . The company has returned to positive free cash flow , indicating improved cash generation and operating stability. Revenue continues to trend hi

#LICHSGFIN at 506. Nicely poised for a good move. #LICHSGFIN at 506. Decent financials. FIIs/DIIs have a decent stake which is by and large stable. Quarterly results on 31st. Technically the stock has finished sub wave 4 and is now trying to wind up sub wave-2 of primary -5 and start sub -3 of primary -5 for tgt 891. WTF chart is almost identical.

RELIANCE 1 Month Time Frame 📌 Latest Trading Price (market close Feb 6 2026): ₹1,450.85 on NSE/BSE.
📈 Key Resistance Zones (Upside)
₹1,455–₹1,460 — immediate technical resistance (pivot cluster)
₹1,470–₹1,480 — next barrier above recent highs seen in early Feb price swings
~₹1,500 — psychological resistance (round numbe

POWERGRID: Trend Reversal Indicators & Key LevelsThe stock of POWERGRID is showing signs of a potential trend reversal after an extended downtrend. Several technical factors across multiple timeframes support this shift in momentum.
The stock has recently managed to close above the 200-day EMA, a level widely monitored for assessing long‑term t

BUY TODAY SELL TOMORROW for 5%DON’T HAVE TIME TO MANAGE YOUR TRADES?
- Take BTST trades at 3:25 pm every day
- Try to exit by taking 4-7% profit of each trade
- SL can also be maintained as closing below the low of the breakout candle
Now, why do I prefer BTST over swing trades? The primary reason is that I have observed that

Positional or Long Term Opportunity in ITCGo Long @ 327.8 for Targets of 357, 377, and 423 with SL 309.45
Reasons to go Long :
1. On Weekly timeframe If we draw Fibonacci retracement from the recent swing low (A) to the swing high (B) then the stock took support from the 0.5 Fibonacci level.
2. In addition to this, the stock formed a Bul

Dead Cat Bounce in Nifty? Heavyweights to Deliver The VerdictDead Cat Bounce in Nifty? Index Heavyweights to Deliver the Verdict Soon…
Both index heavyweights remain structurally weak despite the recent bounce.
On the daily timeframe, Reliance Industries and HDFC Bank have transitioned out of bullish Ichimoku regimes. Crucially, the second daily Kumo
IEX: Stuck in the 'Coupling' CrosshairsIEX is currently a "headline-driven" stock. Despite reporting a record 13,050 MU trading volume in January 2026 (up 19.6% YoY), the share price remains suppressed. The primary culprit is the CERC’s Market Coupling directive, which threatens to dilute IEX’s 85-90% dominance in the Day-Ahead Market (D

See all stocks ideas
Feb 6
SHREECEMShree Cement Limited
Actual
77.22
INR
Estimate
94.27
INR
Today
GOLDIAMGoldiam International Limited
Actual
—
Estimate
—
Today
VSTTILLERSVST Tillers Tractors Limited
Actual
—
Estimate
—
Today
FILATEXFilatex India Ltd
Actual
—
Estimate
—
Today
UGROCAPUgro Capital Limited
Actual
—
Estimate
—
Today
MGLMahanagar Gas Ltd
Actual
—
Estimate
20.56
INR
Today
GANECOSGanesha Ecosphere Limited
Actual
—
Estimate
1.40
INR
Today
HARIOMPIPEHariom Pipe Industries Ltd.
Actual
—
Estimate
—
See more events
Community trends
The crypto has found its supportBitcoin CMP $70690
The beauty of looking at various asset classes is that they rise and fall together. In my view the correction in the crypto is over.
Elliott- The v waves within the C wave is done. Hence to me this correction is over.
Fib- The crypto reversed just shy away from the 59K whic
BITCOIN Bitcoin Liquidity Sweep Setup – Distribution in Progress?
Bitcoin is currently trading inside a clear upper liquidity zone after a strong impulsive recovery from the lows. Price has now made three attempts to break the upper supply area, but each push is showing weakening momentum.
🔎 What I’m Seei

#BTCUSDWhat’s Next in Bitcoin? 🚀💡
After completing its 5-wave bull run 📈, Bitcoin entered a corrective phase starting on October 3, 2025, which recently completed its A wave on February 5, 2026.
🔍 Breaking down the A wave:
1️⃣ Wave 1: Low formed on October 11
2️⃣ Wave 2: Flat correction completed on Octo

BITCOIN CRASH TO $40K INCOMING? Critical Levels You MUST Know!BITCOIN CRASH TO $40K INCOMING? Critical Levels You MUST Know!
Current Status: BTC forming Lower Lows & Lower Highs - Weakness Confirmed.
After breaking below $90K, Bitcoin tested sub-$70K as predicted, reaching a low of $59,809 yesterday before bouncing to $71,750. This volatility liquidated both

Bearish Continuation Setup After Dead-Cat Bounce (1H)
What the chart is saying:
Clear bearish trend: Price has been making lower highs and lower lows. The broader structure is decisively bearish.
Range breakdown: The blue box shows a consolidation range that broke to the downside, confirming continuation rather than accumulation.
Strong sell-off in

Bitcoin: Post-Impulse Correction Near the Golden RatioRead time: ~3–4 minutes
The Bigger Picture
Bitcoin completed a clean, non-overlapping 5-wave impulse from the cycle lows, respecting a well-defined rising channel. This structure suggests the broader trend remains intact, but every impulse must correct — and that phase is now underway.
Transi

Bitcoin 4H Chart Shows Exhaustion After Sharp Sell-Off Bitcoin has experienced a strong impulsive decline, breaking multiple short-term supports and accelerating downside momentum. After this sharp sell-off, price is now attempting a reaction from lower levels, suggesting temporary exhaustion from sellers.
🔍 What the Chart Is Showing
➤ Clear impulsi

ETH Reversal or just a pullback?CRYPTO:ETHUSD
Looking at the 4hr TF of ETH. it looks taking a minor pullback from the downward trend.
Yet it has to close Above $2620 to break the character of the current downtrend.
Highly likely it will chase this number successfully as more people are coming in with sentiment of buying the

BTC Weekly OB Bounce + Daily Displacement Long SetupBTC Weekly OB Respect + Daily Displacement Setup
BTC perfectly respecting Weekly Order Block (pink zone ~$62-63K) creates bullish HTF bias. Price bounced with higher lows, confirming institutional demand defense.
Trade Thesis
Weekly OB hold → Daily displacement above orange Daily OB (~$65-67K)

Bull markets don’t start with excitement. They start with doubtIn December 2020, #Bitcoin crossed $20,000.
No hype.
No celebration.
Most people said, “It’s a trap.”
Four months later,
CRYPTOCAP:BTC was trading near $64,000.
📌 Bull markets don’t start with excitement. They start with doubt.
📌 Bear markets don’t start with panic.
They start with confidence

See all crypto ideas
Bearish Pullback Into Resistance, Downside Target in FocusMarket Structure
Price previously made a strong impulsive drop, followed by a rounded bottom / corrective recovery.
That recovery looks corrective, not impulsive (overlapping candles, curved structure), suggesting a bearish continuation setup rather than a trend reversal.
Key Zones
Major Resista

Gold at a Make-or-Break Harmonic ZoneGold is approaching a critical harmonic completion area, where price action, Fibonacci geometry, and momentum structure are converging. This setup demands attention.
🧠 Market Structure Snapshot
Price has completed a well-defined X–A–B–C structure
The market is currently progressing through

XAUUSD Short Idea XAUUSD short idea, sell below harmonic level (below B) with a confirmation. target till the FVG or Ride it with a trailing SL.

Gold Breaks Falling Resistance– Structure Shift Signals PossibleGold has finally broken above the falling resistance trendline, and more importantly, the market structure has flipped. This is the key reason why breakout trades start working better after long corrections.
Earlier, price was respecting the falling trendline, but once sellers failed to push it low

be ready for gold crash i have seen an diversion in rsi of gold and before i have seen there was a big short position in gold so i also think gold need correction so be ready below red line.

XAUUSD/GOLD 1H SELL LIMIT PROJECTION 06.02.26XAUUSD – 1H Sell Limit Projection | 06.02.26
“In this one-hour XAUUSD analysis, gold is currently moving within a broader corrective structure after a strong bearish impulse.
Price is approaching a key descending trendline, where we can also observe a double top formation developing near the resis

XAUUSD – H1 Outlook: Buying InterestXAUUSD – H1 Outlook: Liquidity Build While Risk Premium Supports Gold | Lana ✨
Gold is holding firm after a clean rebound from the sell-side liquidity sweep, and the current price action suggests the market is now building structure rather than trending aggressively.
📌 Technical picture (SMC/flow-

GOLD Price Action Analysis | EMA 200 Resistance Zone Gold is currently trading near a major dynamic resistance zone formed by the 200 EMA on the H1 timeframe . After a strong impulsive move from the recent lows, price has retraced and is now approaching this critical level.
🔍 Technical Observations
Overall market structure is still corrective
Pr

XAUUSD (H2) – Liam's AnalysisXAUUSD (H2) – Liam View
Rally into supply | Volatility risk rising
Gold is rebounding from the 4550–4600 demand base, but the broader H2 structure still points to a selling environment. The current move higher looks corrective, driven by short covering and liquidity rotation rather than a confirmed

Gold PA Scalping FrameworkScanning XAUUSD to filter high-quality trade setups. No trades are forced—only structure-based opportunities.
Note: There may be a delay in this video due to upload processing time.
Disclaimer: FX trading involves high leverage and substantial risk, and losses can exceed your initial investment. Th

See all futures ideas
USDCAD | 1H Market Structure OutlookUSDCAD is currently trading within a well-defined short-term distribution range after engineering a strong impulsive rally from the late-January lows. The recent expansion into the 1.3700 handle appears to have tapped into a premium supply zone, where price printed rejection wicks, signaling the pre

EURUSD ANALYSIS OVER 15M CHARTEUR/USD remains under downside pressure, with UOB maintaining a bearish bias while highlighting 1.1750 as a key support level. A deeper move toward 1.1725 is currently seen as less likely, as long as price stays below the strong resistance zone near 1.1860.
Despite the broader downside risk, I’m **

EURAUD MULTI TIMEFRAME ANALYSIS Hi traders, this is the complete multi-time frame analysis for this pair. Please feel free to ask any questions in the comment section below. The entry will only be made if all strategy rules are met.

Expecting The Usdchf is preparing for sellside delivery *CHF more stronger than
dollar fundamentally,also it's running
all time low , filled
the weekl daily imbalance and my
expectations to Target liquidity below.
* Even if monthly flips it might go keep on n on lower
Why I did not above near the order block above the monthly breaker? Cause it's

Fall incoming? I don't think so.Hello traders!
Long time no see... With the Japanese elections just around the corner, there are certain speculations of an incoming fall. My analysis does not agree with that. I think JPY is heading for 159.500 buyside liquidity . Even if it is heading lower, it is highly unlikely that it goes no

USDCHF Is Not Weak – It’s Testing Support!USD/CHF is currently trading inside a well-defined rising channel, and the recent move lower looks more like a pullback into trend support rather than a breakdown.
For me, this is typical behavior in trending markets. Strong moves don’t continue in a straight line, price pulls back, tests support,

GBPUSD looks bearish for the next few sessions!!ICT Concepts:
- Price swept BSL in Daily timestamp
- IFVG creation on daily showing bearish sentiment
- Daily candle delivering out of CE of the IFVG
- FVG sitting in discount should attract price lower
- Previous breakout region and OB should be the next price targets as mentioned in the chart

See all forex ideas
Trade directly on Supercharts through our supported, fully-verified, and user-reviewed brokers.


