From Euphoria to Equilibrium The Market’s True PatternHello Mates, Hope everyone’s doing great and enjoying the charts so today let’s explore one of the most important market concepts that how an All-Time High gradually evolves into a fresh Support and Resistance cycle.
Understanding the Market’s Natural Rhythm--::
Every chart tells a story a story of enthusiasm, correction, recovery, and retest.
Price action moves in cycles, and one of the most powerful yet simple cycles is when a market makes an All-Time High, corrects into a Support Zone, and then forms a New Resistance before deciding its next direction.
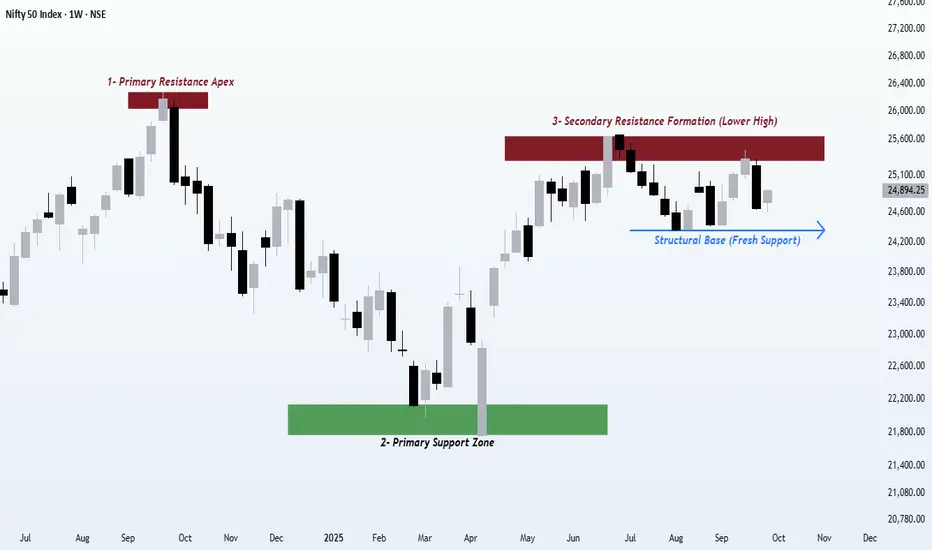
This NIFTY 50 weekly chart beautifully captures that structure a sequence every trader should recognize to understand market behavior with more clarity.
1️⃣ Major Swing High (The All-Time High)
At this stage, optimism dominates and new buyers rush in, assuming the trend will never end.
However, this is also where smart money begins distributing positions quietly.
You’ll often notice slowing momentum, smaller candle bodies, or divergence on oscillators.
This “All-Time High” is not just a price it’s the point where supply pressure starts building and emotional euphoria reaches its peak.
2️⃣ Primary Demand Zone (Support After the All-Time High)
As the correction begins, emotional traders exit while strong hands start building positions again.
The price eventually finds primary demand a zone that often aligns with previous breakout areas or major volume clusters.
This becomes a high-value area, where institutional accumulation quietly begins.
It represents balance after a phase of imbalance a healthy step in any structural cycle.
3️⃣ Secondary Supply Zone (Resistance After Support)
Once the support holds, the price rallies back and retests the previous breakdown region.
This forms a secondary supply zone, where earlier buyers might book profits and short-term traders look for reaction.
It’s a retest phase, where the market decides whether it wants to continue upward or stay range-bound. A breakout from here indicates renewed strength, while rejection can invite another leg of consolidation or retracement.
4️⃣ New Structural Base (Fresh Support)
Recently, we can observe a new higher base forming just below the resistance zone.
This area acts as a structural pivot — often referred to by professionals as:
Intermediate Demand Zone
Base Formation Area
Mid-Structure Support
Higher Low Support Zone
Why This Cycle Matters--::
Recognizing this evolution from All-Time High → Correction → Support → Retest → New Structural Base helps traders identify where they are in the price cycle instead of reacting emotionally and It builds a roadmap of liquidity flow and institutional intent.
No matter the timeframe or assets like stocks, forex, or crypto this structure repeats endlessly, forming the core rhythm of the market.
Key Takeaway--::
Price doesn’t move randomly. It evolves through phases of enthusiasm, fear, and reaccumulation and every level leaves footprints of intent.
Traders who learn to read these transitions stop chasing moves and start understanding the underlying structure of opportunity.
Regards- Amit Rajan
Support and Resistance
Why To Draw Before You Trade ?Hello fellow traders and respected members of the trading community, In a fast paced market dominated by automation and algorithms, we often forget the value of simply picking up a tool and drawing on our charts. Let’s revisit why this fundamental habit still holds the power to sharpen our edge and elevate our decision-making.
Why We Should Draw and Trade? Turning Charts Into Clarity
Introduction-:
In an age of auto-generated indicators, black-box algorithms, and AI-driven signals, many traders are drifting away from one of the most fundamental trading tools: manual chart drawing.
But what if the very act of drawing is not just an old habit—but a powerful trading edge?
This publication explores why actively drawing on charts and trading based on visual context can elevate your market understanding and execution like nothing else.
1. What Does It Mean to “Draw and Trade? Drawing isn’t just technical analysis it’s interactive thinking. When you draw, you're mapping the structure of the market using tools like
Trendlines
Support & Resistance zones
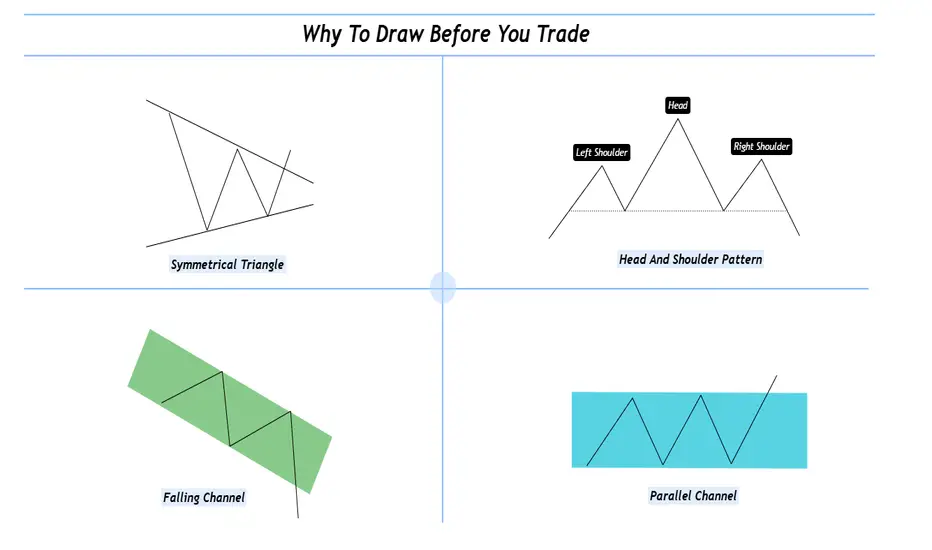
Chart Patterns (Head & Shoulders, Flags, Triangles, etc.)
Supply & Demand levels
Gaps, Fibonacci levels, and more
Once the chart is marked, you’re no longer entering trades blindly you’re entering with context, clarity, and confidence.
2. The Psychology Behind Drawing
Manual drawing engages your focus, discipline, and decision-making. You don’t just predict, you process and It forces you to slow down helping reduce impulsive trades. Drawing anchors your emotions and keeps you mindful. The act of drawing becomes a psychological filter—helping you trade from structure, not stress.
3. Why It Beats Indicator Only Trading?
Indicators are reactive. Drawing is proactive.
Here’s the difference:
Indicators show what already happened
Drawing lets you prepare for what could happen
You learn to-:
Anticipate breakouts, fakeouts, and reversals, Understand market structure and Develop your own strategy not depend on someone else's signal. In short you become the strategist, not just a follower.
4. The “Chart Time” Advantage
Just like pilots need flight hours, traders need chart hours. Drawing charts manually gives you those hours.
You start to see patterns that repeat and notice behavior shifts before they show on indicators. Build a visual memory of how the market moves and It’s this visual experience that separates analysts from traders.
5. Real-World Edge: Case Studies
Wyckoff Distribution: Mapping the structure—BC, AR, ST, UT, LPSY—helps anticipate smart money exits.
Gap Zones: Marking an old breakaway gap can help predict future rejection or support
Demand Zones + Fib Confluence: Drawing reveals high-probability reversal zones most indicators miss
Each drawing becomes a trade-ready story with logic and risk control.
6. From Drawing to Discipline
Drawing is not just prep it’s planning. You trade with a clear plan and pre-identified entry/exit zones this reduced emotional interference and It becomes your personal visual rulebook. No noise no randomness just structure driven action.
7. Final Thoughts: The Trader’s Mind vs. The Machine
Yes, AI and indicators are useful.
But your most powerful edge?
Your mind.
Your eyes.
Your experience sharpened through drawing.
If you want to evolve from a reactive trader to a consistent performer, here’s the golden rule:
Stop watching. Start drawing. Trade what you see, not what you hope.
I hope you will like this post, Thanks for giving your valuable time for reading.
Regards- Amit.
The Nuances of Trading : How to draw lines on chart (Examples)Let's Learn the Trading Together... I have started a new series of trading called #LNT (Learn the Nuances of Trading) where you are going to learn All the things which is going to help you to be a good trader.. (#TNT program)
Learning in Video : In This Video I have teach you how to draw Lines (Examples) ..
It is going to very helpful if you participate the challenges so that we can build a very good trading community..
It is my attempt to teach you the trading.. Hope you will like.
Disclaimer : It is my personal view as a trader and for educational purpose only. Equity market involves risk.
Please consult your financial adviser before taking any decision.

Learn the Nuances of Trading : How to draw lines on chart Let's Learn the Trading Together... I have started a new series of trading called #LNT (Learn the Nuances of Trading) where you are going to learn All the things which is going to help you to be a good trader..
Learning in Video : In This Video I have teach you how to draw Lines in different way ..
It is going to very helpful if you participate the challenges so that we can build a very good trading community..
It is my attempt to teach you the trading.. Hope you will like.
Disclaimer : It is my personal view as a trader and for educational purpose only. Equity market involves risk .
Please consult your financial adviser before taking any decision.

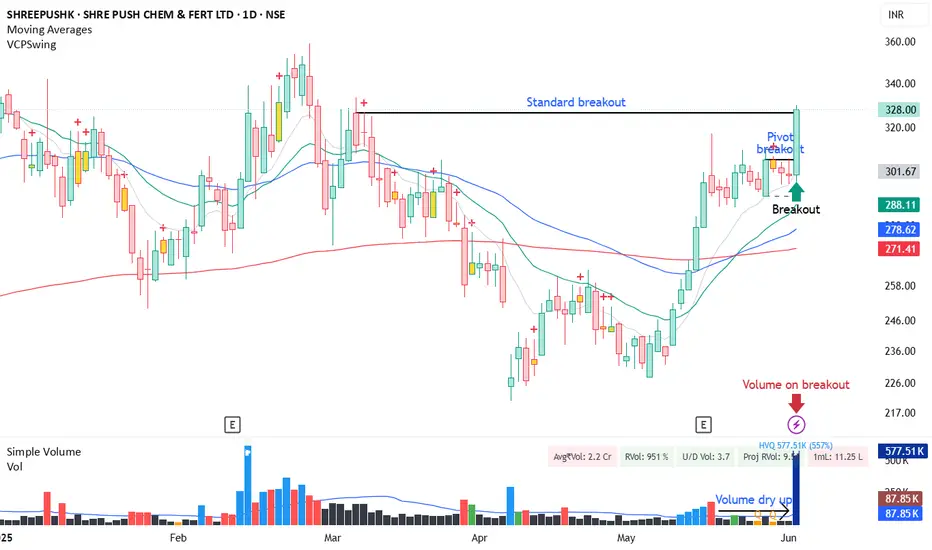
Difference between Pivot and Standard breakoutPivot:- When the stock consolidates for few days in tight range which is less than 8% for few days and volume dries up.
Standard Breakout:- When the stock breaks old resistance level.
DISCLAIMER: NOT INVESTED. This is only for educational purpose. I'm not a SEBI registered analyst.
How to Trade "Mitigation Blocks" – Secret Used by Big Boys!Hello Traders!
Today we’re diving into an advanced Smart Money Concept – the Mitigation Block . If you’ve ever wondered how institutional traders quietly manage their risk and re-enter trades with precision, this is it. Learning to identify and trade Mitigation Blocks can completely change how you see charts — and give you an edge most retail traders miss!
What is a Mitigation Block?
A Mitigation Block is formed when smart money (institutions, banks) enter a position, price reacts strongly, but later returns to the same zone to “mitigate” their risk or add more positions. This block acts as a powerful zone of support or resistance , depending on trend direction.
How to Identify a Mitigation Block
Look for Imbalance + Strong Reaction: A large impulsive candle followed by a return to the origin zone.
Price Fills the Fair Value Gap: Smart money wants to re-enter at the best price — this creates the mitigation block.
Previous Break of Structure: The block should follow a BOS (Break of Structure) that confirms a new trend.
How to Trade the Mitigation Block
Mark the Origin Candle Zone: Identify the candle or small range where the impulse began. This is your block.
Wait for Price to Return: When price comes back to that zone, look for entry confirmation (candlestick rejection, SMC confirmation, etc.).
Use Proper SL and RR: Place stop loss below/above the mitigation zone and target next liquidity level or BOS zone.
Rahul’s Tip
Most traders chase breakouts. Smart money plans for the pullback to mitigation zones. Be patient, wait for confirmation, and strike where big players do — not where the crowd is jumping in.
Conclusion
Mitigation Blocks are not just support/resistance — they are institutional footprints. Learn to spot them, understand the intent behind them, and you’ll start entering where the big boys load up.
Have you ever traded mitigation blocks before? Share your experience in the comments!

Not all lines are Trends: Post about proper Trendlines
Introduction-:
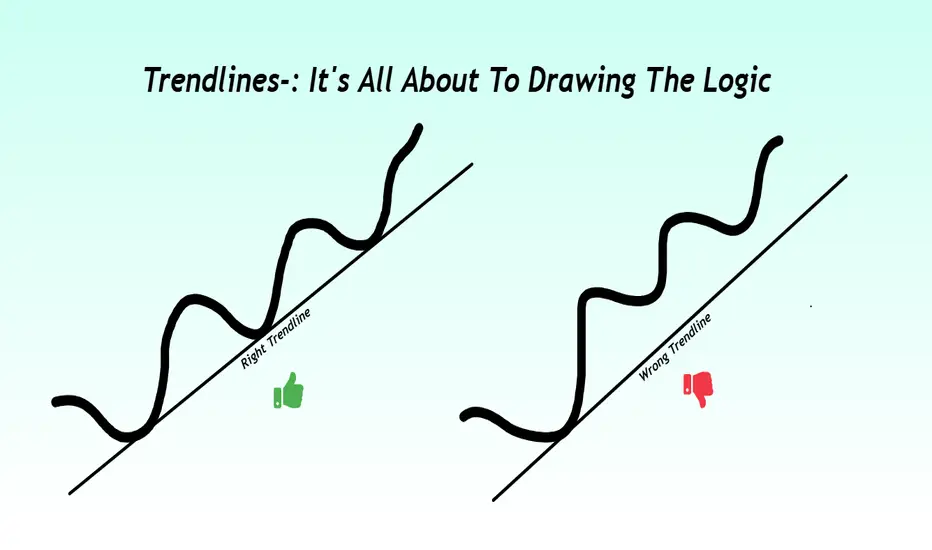
Trendlines are often the first tool traders learn and ironically, one of the most misused. Drawing a line between two swing points may look convincing, but that doesn’t make it meaningful. A right trendline is not just about connecting dots it’s about capturing the heartbeat of the market.
In this post we will learn how to draw high quality trendlines that align with price structure, reflect momentum, and provide reliable trade signals. Whether we are scalper, swing trader, or positional analyst, mastering this skill will bring more clarity and confidence to your chart reading.
1-:What Is a Trendline Really ?
A trendline isn't just a visual reference it’s a dynamic tool that reflects the direction and strength of a trend. Think of it as the price path of least resistance.
a) Identify areas of value for entry
b) Highlight potential reversal or breakout zones
c) Keep your analysis structured and disciplined
2-: Anatomy of a Right Trendline
a) Three Touches Minimum
A trendline with just two points is a projection. Once it gets a third touch or more, it becomes validated a level that other traders are likely watching too.
b) Wicks or Bodies Choose One, Use wicks when volatility is high or you're analyzing intraday charts and use bodies for cleaner structure in swing setups
Mixing both can distort your view so choose one and stick to it per chart.
c) Don’t Cut Through Candles, a forced line that slices through multiple candles is a biased line. Let the trendline hug swing points naturally without imposing your view on the market.
d) Respect the Slope, steep trendlines often mark emotional moves that don’t last. Shallow trendlines suggest controlled trends better for swing trades. Avoid extremes a flat or vertical line is usually unreliable.
3-: Timeframe Relevance
Always start with higher timeframes Daily or 4H to draw the main trendline. These longer-term lines attract more volume and institutional attention. Then shift to lower timeframes to refine your entries, keeping the higher-level structure in view.
4. Use Trendlines with Context for Better Accuracy, Trendlines become far more powerful when aligned with other tools, Some examples below.
Horizontal support and resistance can confirm trendline levels
Volume spikes can validate breakout or pullback setups
Divergence in RSI or MACD can signal weakening trend strength
Chart patterns like flags, triangles, or head-and-shoulders often form around key trendlines
The more layers of confirmation, the better your odds.
5-: Using Trendlines for Trading Decisions
a) Pullback Entry
Wait for price to touch the trendline and show a strong reaction (engulfing, pin bar, etc.). These setups offer high R:R with clear invalidation.
b) Break and Retest
A clean break below or above the trendline, followed by a retest, often marks trend continuation or reversal. Wait for confirmation before entering.
c) Logical Stop Placement
Place your stop-loss just outside the trendline’s opposite side. This approach is more rational than random pip buffers or fixed risk.
6-: Trendlines That Trap Traders
Not all breakouts are real. Sometimes price will breach a trendline just enough to trigger stops and then snap back so how to avoid the trap.
Don’t trust every breakout
Confirm with volume or candle structure
Watch for failure-to-follow-through patterns
Patience often reveals whether a move is genuine or manipulation.
Conclusion
The right trendline is not just a drawing it’s a tool that reflects the psychology of the market.
It helps you trade what the market is showing, not what you hope to see. Don’t draw lines to fit your bias. Let price action speak, and draw lines that the market itself respects.
Thanks for reading. If this added value, a like would be encouraging.
Regards- Amit.
Asian Session High-Low+India Market Opening Reaction–Must Know!
Hello Traders!
Most traders focus only on the Indian market’s open without realizing the hidden power of the Asian session highs and lows . The reaction around these levels during our market opening can provide a fantastic intraday setup! Today, I’ll show you how to use Asian session levels combined with Indian market open to catch clean trades .
Why Asian High-Low Levels Matter
Pre-Defined Support/Resistance:
Asian session high and low create important reference points even before India opens.
Liquidity Pools:
Big players often place orders around these zones — making them natural traps or breakout points.
Clear Bias for the Day:
Price reaction at these levels can hint whether the day will trend or stay sideways.
The Setup – Step-by-Step Guide
Step 1 – Mark Asian Session High & Low
→ Asian session = from 5:00 AM to 9:15 AM IST
→ Plot horizontal lines at the highest and lowest points.
Step 2 – Observe Price Behavior Near These Levels After India Opens
→ Rejection = Reverse (trade against breakout)
→ Break + Retest = Trend Continuation
Step 3 – Entry, Stop Loss & Target
→ Entry: After confirmation candle (like engulfing, pin bar) at Asian High-Low
→ SL: Few points beyond the high/low
→ Target: 1:2 or next major support/resistance zone
When to Avoid This Setup
Major Gap Up or Gap Down Days:
If the market opens far away from Asian levels, ignore.
High Volatility News Days:
Big news flow (RBI policy, US inflation data) can invalidate early session reactions.
Rahul’s Tip
“First 15-30 minutes after open are critical.” Patience is key — let the market show you if Asian High/Low will hold or break!
Conclusion
By combining Asian session highs and lows with opening reactions , you can trade with a plan instead of guessing. This setup works beautifully for Nifty, BankNifty, and major stocks with decent liquidity.
Have you ever tried tracking Asian session levels? Let’s discuss in the comments below!
If you found this post valuable, don't forget to LIKE and FOLLOW !
I regularly share real-world trading setups, actionable strategies, and learning-focused content — all from real trading experience, not theory. Stay connected if you're serious about growing as a trader!

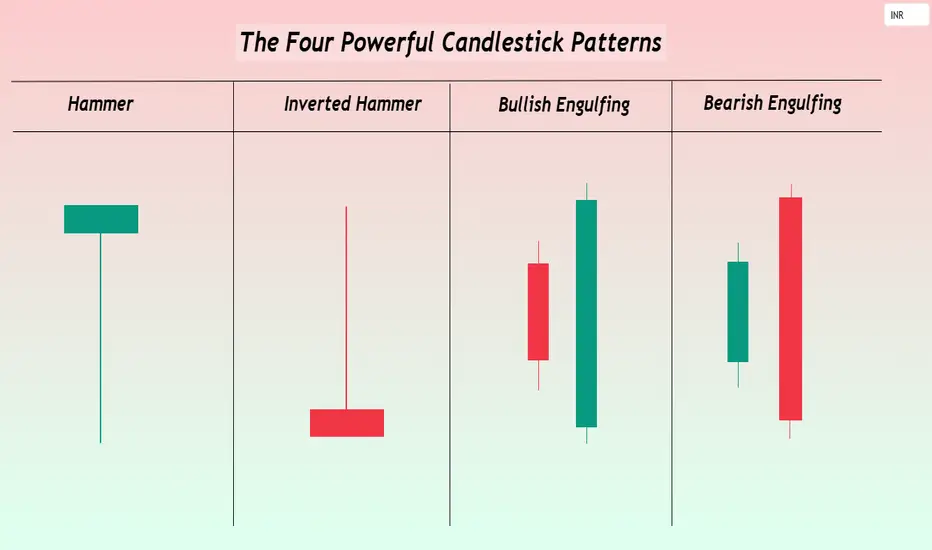
The Four Powerful Candlestick PatternsHello TradingView Community and Friends here I am sharing the four of the most powerful candlestick patterns every trader should know especially to the new entrants to technical analysis and that are-: Hammer, Inverted Hammer, Bullish Engulfing, and Bearish Engulfing.
These patterns are not just visual shapes they reveal critical shifts in market sentiment and offer high probability trading opportunities when interpreted correctly.
I hope this article adds real value to your trading journey. Feel free to share your thoughts and experiences in the comments, sharing below the Four Powerful Candlestick Patterns.
1-Hammer: The Bullish Reversal Indicator Structure and Appearance-:
A small real body located near the top of the price range.
A long lower wick that is at least twice the size of the body.
Little or no upper shadow.
Psychology-:
During the session, bears push the price significantly lower, but bulls step in aggressively, driving the price back near the open.
The result is a strong potential bottoming signal showing that buyers are regaining strength.
Trading Strategy-:
Most effective after a steep downtrend or during oversold conditions.
Confirmation is essential: the next candle should close above the Hammer’s high to validate the reversal. A prudent stop-loss can be placed just below the low of the Hammer.
2-Inverted Hammer: a Subtle Bullish Rreversal signal, Structure and appearance-:
A small real body located near the bottom of the trading range.
A long upper wick that is at least twice the size of the body.
Very little or no lower shadow.
Psychology-:
Buyers attempt to push prices higher during the session but face selling pressure.
However the very presence of buying pressure after a downtrend hints at underlying bullish interest starting to emerge.
Trading Strategy-:
Most useful after a strong downtrend when signs of exhaustion appear.
The confirmation is again crucial a strong bullish candle following the Inverted Hammer gives a higher probability setup.
Risk can be controlled by placing a stop-loss below the Inverted Hammer’s low.
3-Bullish Engulfing: Buyers Taking Over Structure and Appearance-:
A large bullish (green) candle that completely engulfs the previous small bearish (red) candle’s body.
Ideally, the bullish candle opens lower and closes higher than the previous candle’s range.
Psychology-:
Initial selling pressure is absorbed and reversed with strong buying momentum.
A complete shift in sentiment from bears to bulls is reflected in the engulfing candle.
Trading Strategy-:
Most powerful when appearing after a sustained downtrend or at key technical support levels.
Traders often enter on a break above the Bullish Engulfing candle’s high.
Volume confirmation higher than average during the pattern significantly strengthens the signal.
4-Bearish Engulfing: Sellers Seizing Control, Structure and Appearance-:
A large bearish (red) candle that fully engulfs the previous small bullish (green) candle’s body.
Ideally, the bearish candle opens higher and closes lower than the previous candle’s range.
Psychology-:
An initial bullish attempt is overwhelmed by aggressive selling pressure.
Bears decisively regain control, warning of a potential downside move.
Trading Strategy-:
Highly effective when occurring after an extended uptrend or near strong resistance zones.
Traders can initiate short positions on the break below the Bearish Engulfing candle’s low, with stops placed just above the pattern’s high.
Increased volume during the engulfing candle boosts the credibility of the reversal.
Key Techniques for Trading These Patterns Successfully-:
Always wait for confirmation a single candle is never enough subsequent price action is critical.
Volume matters- Candlestick signals accompanied by a surge in volume are generally more reliable.
Focus on key price zones- Patterns occurring near major support, resistance, or Fibonacci levels have a much higher success rate.
Risk management remains supreme- No pattern guarantees success. Appropriate stop-loss placement and calculated position sizing protect against false signals.
Conclusion-:
The Hammer, Inverted Hammer, Bullish Engulfing, and Bearish Engulfing patterns remain among the most trusted tools in a trader’s arsenal.
They capture critical moments when the balance of power between buyers and sellers shifts often leading to strong follow through moves.
However even the most powerful candlestick setups require patience, discipline, and proper confirmation.
By mastering these patterns and integrating them into a well rounded trading plan, traders can anticipate key market moves, time their entries better, and ride trends with greater confidence.
Focus on learning the language of price, and the markets will start speaking to you more clearly.
Hope you like this publication.
Best regards-Amit
The Market Speaks in the First Hour Learn to ListenDear TradingView Community and Fellow Traders, Wishing you all a focused and fulfilling trading journey. Each day in the market brings its own rhythm, and recognizing that early can make all the difference. In this piece, I’m sharing a concept that continues to shape my intraday approach, the First Hour Range. It’s a simple yet powerful framework that can offer clarity right from the start of the session.
Let’s explore how the first 60 minutes can set the tone for the entire trading day.
Body-:
The first hour of the trading session is one of the most dynamic and information-rich periods of the day. It lays the groundwork for what often becomes the day’s dominant trend, volatility structure, and psychological narrative. Whether you're a scalper, momentum trader, or swing trader analyzing intraday flow, the first hour can act as your primary map.
Understanding the First Hour Range-:
The First Hour Range is defined by the highest and lowest prices achieved during the first 60 minutes after market open. These two levels create a clear boundary that reflects the initial battle between buyers and sellers, often influenced by overnight global cues, news events, gap openings, and institutional order flow.
This range can be seen as a "price cage" a zone that either contains the price action for the rest of the session or is decisively broken to signal continuation or reversal.
Why Is This Range So Important?
High Volume and Volatility-: The opening hour is typically where the highest intraday volume occurs. This influx of participation leads to price discovery, as market participants react to overnight developments, pre-market news, and opening gaps.
Reference for Support and Resistance-: The high of the first hour acts as early resistance. The low acts as intraday support. If price breaks above or below this range later in the session, it’s often accompanied by strong follow-through, especially when confirmed with volume.
Bias Detection-: Traders can assess whether the session is likely to be trending or range-bound by observing how price behaves around the first hour range. A clean breakout and sustained move away indicates trend conviction. Repeated rejection from the edges hints at indecision or mean-reversion behavior.
Breakout Triggers-: Many intraday breakout strategies use the first hour range as a trigger zone. Long entries may be placed just above the high of the range, while short entries might be taken below the low. Traders often use volume spikes or candle confirmation (e.g., engulfing or Marubozu) for added conviction.
Fakeouts and Traps: On some days, price may breach the range high or low and then reverse back within it. This is known as a failed breakout or fakeout, often trapping aggressive breakout traders. For experienced traders, these traps can be lucrative countertrend setups with tight stop-loss placements.
Types of Market Days Based on First Hour Behavior
Trend Day-:
Price breaks out of the range early and continues in the direction of the breakout with minimal pullbacks. Look for rising volume and shallow retracements.
Range-Bound Day-:
Price stays within the range for most of the session, often forming a sideways consolidation. These are ideal for mean-reversion traders using oscillators or reversal patterns near the extremes.
Reversal Day-:
The initial breakout fails, and price reverses strongly in the opposite direction. Look for volume divergence or key reversal candlesticks like pin bars or bearish/bullish engulfing patterns.
Tips for Using the First Hour Range Effectively
Always mark the first hour high and low on your intraday chart, regardless of your trading style. It serves as a reference throughout the day.
Align higher timeframe bias (e.g., daily or 4-hour chart) with the breakout direction to improve probability.
Watch how price reacts at the range extremes. Wick rejections, reversal candles, or hesitation often precede strong counter moves.
In choppy markets, wait for a retest of the breakout level before entry this improves confirmation and reduces false signals.
Psychological Importance
The first hour is not just about price it’s about trader psychology. Emotional decisions, early fear or greed, profit-taking from overnight positions, and smart money manipulation all unfold during this time. Reading this layer helps you better anticipate the day’s rhythm.
Conclusion-:
The First Hour Range is a deceptively simple yet incredibly effective framework to assess market structure, trade opportunities, and risk zones. It’s a tool that adapts well to all kinds of markets equity indices, forex, commodities, or crypto.
Make it part of your daily routine. Observe how price respects or disrespects it. Use it to align your trades with market momentum or fade the crowd when the context favors reversals.
More often than not, the market whispers its intention in the first 60 minutes. The traders who are listening closely tend to ride ahead of the curve.
Best Regards- Amit

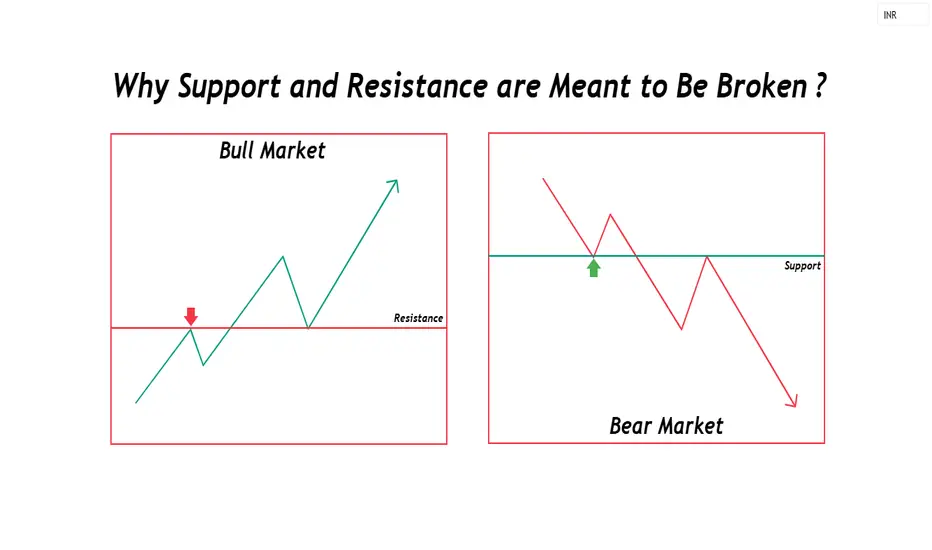
Why Support and Resistance are Meant to Be Broken ?Hello fellow traders! Hope you're all doing well. As we navigate the markets, it's crucial to remember that support and resistance are only temporary momentum and trend strength matter more. This article dives deep into how these levels break and how to position yourself smartly. Stay adaptive, trade with confidence, and let the market guide your decisions. Wishing you profitable trades ahead!
Support and Resistance Are Meant to Be Broken-:
Support and resistance levels are widely used in technical analysis, but one key truth often gets overlooked they exist to be broken. No matter how strong a level appears, the market will eventually decide its fate not us. The real edge lies in anticipating when these levels will fail and positioning accordingly.
No Resistance in a Bull Market, No Support in a Bear Market-:
A strong bull market disregards resistance; price keeps climbing as buying pressure overwhelms selling interest. Similarly, in a bear market, support levels fail as fear and liquidation take over. Instead of focusing on static levels, traders should shift their mindset toward momentum and trend strength.
Understanding the Nature of Support and Resistance-:
Support and resistance levels are areas where price has historically reversed or consolidated. They act as psychological zones where traders expect a reaction. However, these levels are not fixed barriers; they shift over time due to changes in market sentiment, liquidity, and institutional activity.
When traders treat support and resistance as rigid, they often fall into the trap of expecting price to react the same way every time it reaches these levels. This can lead to false confidence and poor risk management. Instead, traders should recognize that these zones are fluid and influenced by broader market conditions.
Why Support and Resistance Are Temporary-:
Markets are driven by supply and demand dynamics. What once acted as strong resistance in a bullish market often becomes a stepping stone for higher prices. Similarly, in a bear market, previous support levels eventually collapse, leading to further declines. Understanding this concept helps traders avoid the common mistake of assuming levels will hold indefinitely.
A classic example of this is the support-turned-resistance (or vice versa) principle. When a support level is broken, it often turns into resistance as traders who were once buyers at that level now see it as a place to exit positions. The same applies to resistance turning into support in an uptrend. These shifts happen due to changes in trader behavior and order flow dynamics.
The Illusion of Strong Support and Resistance-:
Many traders believe in so-called “strong” support and resistance levels, expecting price to reverse exactly at these points. However, the truth is that markets evolve, and sentiment shifts. Institutions and large traders do not rely on fixed levels; instead, they adjust based on liquidity zones, order flow, and momentum.
Consider how large institutions trade. They do not place all their orders at a single price level. Instead, they spread their orders over a liquidity range where they can execute large trades without causing excessive slippage. This means that what retail traders see as a “strong level” may just be a general area where larger players are accumulating or distributing positions.
How to Identify Breakouts Before They Happen-:
The difference between an average trader and an exceptional one is the ability to anticipate breakouts and breakdowns. Here’s how you can do it:
Volume Confirmation – A breakout with increasing volume is more reliable. If a resistance level is being tested repeatedly with rising volume, it signals strong buying interest.
Market Structure Shifts – A series of higher highs in an uptrend or lower lows in a downtrend signals a potential breakout.
Liquidity Traps – Watch for false breakouts where price quickly reverses, trapping retail traders before the real move begins.
News and Catalysts – Major events often trigger breakouts beyond key levels. Earnings reports, economic data, or geopolitical events can create strong momentum.
Break and Retest Strategy – Sometimes, after breaking a level, price retests it before continuing in the breakout direction. This is a strong confirmation signal.
Divergence and Momentum Indicators – Tools like RSI, MACD, or moving averages can help confirm whether a breakout has strength behind it.
Practical Trading Strategies
Breakout Trading
Identify key support and resistance levels using daily or weekly charts.
Wait for price to approach these levels with increasing volume.
Confirm the breakout using momentum indicators or a retest.
Enter after confirmation, setting stop-losses slightly below (for long positions) or above (for short positions) the breakout zone.
Range Trading-:
🔹If price is consolidating between support and resistance, trade within the range.
🔹Look for signs of rejection at key levels, such as long wicks or reversal patterns.
🔹Use oscillators like RSI to gauge overbought/oversold conditions.
🔹Trend Following
🔹Identify the prevailing trend using moving averages or higher highs/lows.
🔹Avoid counter-trend trades unless there is strong reversal confirmation.
🔹Let winners run by trailing stop-losses instead of exiting too early.
Psychological Aspect of Support and Resistance:
One of the biggest mistakes traders make is placing too much faith in these levels without considering market conditions. Emotional biases like fear and greed often cloud judgment. For example, if a trader repeatedly sees price bounce off a support level, they may hesitate to sell when a clear breakdown occurs. Conversely, traders who expect resistance to hold may short too early, only to get stopped out as price breaks higher.
To overcome these psychological traps-:
🔹Always trade with a plan and predefined risk-reward ratio.
🔹Be flexible and adapt to new market information.
🔹Understand that no level is guaranteed to hold indefinitely.
Conclusion-:
Support and resistance are useful tools, but they are not unbreakable barriers. The market’s direction ultimately determines whether a level holds or fails. The ability to read price action, volume, and sentiment will always be more powerful than relying solely on predefined levels.
Instead of asking, “Will this support hold?” start asking, “What happens when this support breaks?” That shift in perspective is what separates skilled traders from the rest.
Best wishes and happy trading!
Only 1 Setup You Need to Be Profitable!Hello Traders!
Are you tired of jumping from one strategy to another, hoping to find the perfect setup? The truth is – you don’t need 10 setups to succeed. In fact, mastering just ONE high-probability setup can make you consistently profitable. Simplicity brings focus, and focus builds consistency. Let’s explore how one solid trading setup can change your entire trading game.
Why One Setup is Enough to Win
Consistency Over Confusion: Mastering one setup removes the guesswork. You know exactly what to look for and how to execute.
Clarity in Execution: With one setup, entries, stop-loss, and targets become second nature – making your decision-making fast and confident.
Reduces Overtrading: You avoid taking random trades and focus only when your setup appears – increasing your win rate.
Data-Backed Confidence: Repeating one setup allows you to track its performance, build statistics, and trust your process.
Example: Trendline Breakout Setup (Just One Example)
Entry: Wait for price to break above a well-tested trendline with strong volume confirmation.
Stop-Loss: Place SL below the last swing low or candle that broke the trendline.
Target: Use measured moves or next key resistance as your target.
You can pick any setup – Breakout + Retest, Pullback to Moving Average, Support/Resistance Flip, etc. The point is: pick one setup and master it like a pro.
Conclusion
You don’t need hundreds of indicators or complex systems. One setup + proper risk management = profitability. The market rewards consistency, not complexity.
What’s your favorite setup that works for you? Comment below and let’s help each other grow!

Profitable Trading The defining feature of day trading is that traders do not hold positions overnight; instead, they seek to profit from short-term price movements occurring during the trading session.It can be considered one of the most profitable trading methods available to investors.
The Rule of 90 is a grim statistic that serves as a sobering reminder of the difficulty of trading. According to this rule, 90% of novice traders will experience significant losses within their first 90 days of trading, ultimately wiping out 90% of their initial capital.

Advance divergence Strong divergence is the most reliable type of divergence, often signaling a significant reversal. It occurs when the price makes a new high or low, but the indicator fails to do so, indicating weakening momentum.
Traders use divergence to assess the underlying momentum in the price of an asset, and for assessing the likelihood of a price reversal. For example, investors can plot oscillators, like the Relative Strength Index (RSI), on a price chart.

Technical trading Technical trading is a broader style that is not necessarily limited to trading. Generally, a technician uses historical patterns of trading data to predict what might happen to stocks in the future. This is the same method practiced by economists and meteorologists: looking to the past for insight into the future.

Option and Database trading Options data captures information on options contracts, including pricing and trading volumes, useful for investment strategies. Discover our guide and top options data providers. Options are a type of contract that gives the buyer the right to buy or sell a security at a specified price at some point in the future.

PCR in trading The Put-Call Ratio (PCR) is a popular technical indicator used by investors to assess market sentiment. It is calculated by dividing the volume or open interest of put options by call options over a specific time period. A higher PCR suggests bearish sentiment, while a lower PCR indicates bullish sentiment.

Option chain in trading Option chain is a chart that will give in-depth information related to all stock contracts available for Nifty stocks. The best thing about the option chain is that it provides valuable information about the current security value and how it will affect it in the long term.

Lecture for option trader Hammer & Hanging Man Patterns + Examples. 5min video.
Put Options: Buying vs. Selling. 3min video.
"Bread & Butter" Iron Condor Rules, POPs and Visuals. 4min video.
Instruments to trade Volatility. 10min video.
Strike Price - ITM ATM OTM. 7min video.
You can get started trading options by opening an account, choosing to buy or sell puts or calls, and choosing an appropriate strike price and timeframe. Generally speaking, call buyers and put sellers profit when the underlying stock rises in value. Put buyers and call sellers profit when it falls.

Advance divergence Seeing divergence increases profitability by alerting a trader to protect profits. Technical traders generally use divergence when the price moves in the opposite direction of a technical indicator.
Strong divergence is the most reliable type of divergence, often signaling a significant reversal. It occurs when the price makes a new high or low, but the indicator fails to do so, indicating weakening momentum.

Database tradingThere are four types of trading: day trading, position trading, swing trading, and scalping. Traders should pick one that suits them and figure out the risks and costs to trade safely. What is stock market trading?
Deutsche Bank in association with Sharekhan Ltd brings to you db TradePro, a unique platform for trading in shares online. A superior trading platform and multi-channel access are just two of the many benefits that Deutsche Bank customers enjoy by trading through db TradePro*.

market analysis in tradingThe goal of a market analysis is to determine the attractiveness of a market, both now and in the future. Organizations evaluate the future attractiveness of a market by gaining an understanding of evolving opportunities and threats as they relate to that organization's own strengths and weaknesses.
Market analysis refers to the process of analyzing financial markets. This process encompasses various types of analysis, often assigned to two categories, technical analysis and fundamental analysis.

option and database trading Options data captures information on options contracts, including pricing and trading volumes, useful for investment strategies. Discover our guide and top options data providers.
Options are a type of contract that gives the buyer the right to buy or sell a security at a specified price at some point in the future. An option holder is essentially paying a premium for the right to buy or sell the security within a certain time frame.
