Part 1 Ride The Big Moves Introduction to Option Trading
Option trading is a segment of the financial market that allows investors to buy and sell options—financial contracts that grant the right, but not the obligation, to buy or sell an underlying asset at a predetermined price before or on a specified date. Unlike stocks or commodities where ownership is transferred, options are derivatives, meaning their value derives from an underlying asset such as equities, indices, commodities, or currencies.
Options are widely used for hedging, speculation, and income generation. Traders use options to manage risk, enhance returns, and capitalize on market volatility. Global financial markets, including India’s NSE and BSE, have witnessed exponential growth in options trading due to their flexibility and strategic possibilities.
Types of Options
Options are primarily classified into two types: Call Options and Put Options.
Call Options
A call option gives the buyer the right to purchase the underlying asset at a specified price, called the strike price, before or on the option's expiration date. Investors buy calls if they anticipate the price of the underlying asset will rise.
Example: Suppose a stock is trading at ₹100, and an investor buys a call option with a strike price of ₹110. If the stock rises to ₹120, the investor can exercise the option, buy at ₹110, and sell at ₹120, gaining ₹10 minus the premium paid.
Put Options
A put option gives the buyer the right to sell the underlying asset at a specified strike price within a certain timeframe. Investors buy puts if they expect the price of the underlying asset to fall.
Example: A stock trades at ₹150. An investor buys a put option with a strike price of ₹140. If the stock drops to ₹130, the investor can sell it at ₹140, securing a ₹10 profit minus the premium.
Community ideas

Part 3 Institutional Trading Option Styles and Formats
Options come in various forms to suit different strategies:
Vanilla Options: Standard call and put options traded on exchanges.
Exotic Options: Options with complex structures, including barrier, digital, and Asian options.
LEAPS: Long-term options with expiration dates up to three years.
Participants in Option Trading
Option markets attract a range of participants:
Hedgers: Protect existing positions from adverse price movements.
Speculators: Seek to profit from directional price changes or volatility.
Arbitrageurs: Exploit price differences between markets or instruments.
Market Makers: Provide liquidity by quoting buy and sell prices for options.
Advantages of Option Trading
Option trading offers several benefits over traditional trading:
Leverage: Control large positions with smaller capital.
Flexibility: Wide range of strategies for bullish, bearish, and neutral markets.
Risk Management: Ability to hedge stock portfolios and limit losses.
Income Generation: Selling options (writing) generates premium income.
Speculation Opportunities: Capitalize on volatility without owning the underlying asset.

Part 2 Ride The Big Moves Key Option Terms
Understanding option trading requires familiarity with essential terms:
Underlying Asset: The security (stock, index, commodity, currency) on which an option is based.
Strike Price: The pre-decided price at which the underlying asset can be bought or sold.
Expiration Date: The date on which the option contract expires.
Premium: The price paid to purchase the option.
In-the-Money (ITM): Call options where the underlying price > strike price, and put options where the underlying price < strike price.
Out-of-the-Money (OTM): Call options where the underlying price < strike price, and put options where the underlying price > strike price.
At-the-Money (ATM): Strike price is equal or near the underlying asset’s price.
American vs European Options: American options can be exercised anytime before expiration; European options only on the expiration date.
Option Pricing
Option pricing is influenced by several factors. The Black-Scholes Model and Binomial Models are commonly used to calculate theoretical option prices. Major factors include:
Underlying Asset Price: Higher prices increase call option value and decrease put option value.
Strike Price: Determines profitability; the closer to the underlying price, the more valuable an option.
Time to Expiration: Longer duration generally increases option premiums due to higher uncertainty.
Volatility: Higher volatility increases the probability of profitable movements, raising option value.
Interest Rates: Affects the cost of carry and slightly influences options pricing.
Dividends: Expected dividends impact option value, especially for stocks.

Impact of Rupee-Dollar Exchange Rate on Indian StocksIntroduction
The stock market is a complex system where numerous factors—both domestic and global—interact to determine price movements. One such crucial factor is the exchange rate between the Indian Rupee (INR) and the US Dollar (USD). The Rupee-Dollar exchange rate plays a vital role because the US Dollar is the world’s reserve currency, the primary medium of global trade, and a benchmark for financial transactions worldwide.
In India, the economy is deeply interconnected with global trade, capital flows, and financial markets. Any change in the value of the Rupee against the Dollar has wide-ranging implications on businesses, investors, and the stock market. Companies that import raw materials or export finished goods, sectors like Information Technology (IT), Pharmaceuticals, Oil & Gas, Banking, Aviation, and even Foreign Institutional Investors (FIIs), are directly influenced by these fluctuations.
This essay explores in detail how the Rupee-Dollar exchange rate impacts Indian stocks, covering the theoretical background, sectoral influences, investor behavior, macroeconomic effects, and real-world case studies.
Understanding the Rupee-Dollar Exchange Rate
The exchange rate refers to how much one unit of a currency is worth in terms of another. In India, the exchange rate most closely tracked by investors is INR/USD—the number of Rupees required to buy one US Dollar.
If 1 USD = ₹80, it means that importing something worth $1 will cost ₹80 in India.
If the Rupee depreciates (falls in value), say 1 USD = ₹85, imports become more expensive, but exporters receive more Rupees for the same Dollar earnings.
If the Rupee appreciates (gains in value), say 1 USD = ₹75, imports become cheaper, but exporters earn fewer Rupees per Dollar.
This constant push-and-pull directly influences corporate profitability and, in turn, the stock market.
Why Does the Rupee Move Against the Dollar?
The exchange rate fluctuates due to a combination of domestic and global factors:
Demand & Supply of Dollars – If India imports more than it exports, demand for Dollars rises, weakening the Rupee.
Foreign Institutional Investment (FII) Flows – When FIIs invest in Indian equities, they bring in Dollars, strengthening the Rupee. Conversely, when they pull out, the Rupee weakens.
Interest Rate Differentials – Higher interest rates in the US attract global investors, increasing demand for Dollars.
Crude Oil Prices – India is heavily dependent on crude imports. Rising oil prices increase Dollar demand, weakening the Rupee.
Geopolitical Events – Wars, sanctions, and global economic slowdowns push investors toward the Dollar as a "safe haven."
Inflation & Growth Rates – Higher inflation in India compared to the US reduces the Rupee’s purchasing power.
These factors cause daily volatility in the Rupee-Dollar exchange rate, impacting stock prices.
The Link Between Exchange Rate and Stock Market
The Rupee-Dollar relationship influences stocks in three broad ways:
Corporate Earnings Impact – Companies that earn or spend in Dollars see changes in profitability.
Foreign Investor Behavior – FIIs track currency stability before investing in emerging markets like India.
Macroeconomic Sentiment – A stable Rupee improves confidence, while sharp depreciation raises concerns about inflation, current account deficit, and fiscal health.
Sector-Wise Impact of Rupee-Dollar Exchange Rate
1. Information Technology (IT) Sector
Indian IT companies like TCS, Infosys, Wipro, and HCL earn the majority of their revenue in Dollars by exporting software services to the US and Europe.
A weak Rupee is positive for IT stocks since they earn more Rupees for the same Dollar revenue.
Example: If Infosys earns $1 billion, at ₹80/USD revenue = ₹80,000 crore. If Rupee falls to ₹85/USD, revenue = ₹85,000 crore (without increasing actual Dollar earnings).
Impact: Rupee depreciation → IT stocks rally. Rupee appreciation → IT stocks face margin pressure.
2. Pharmaceutical Sector
Similar to IT, Pharma companies like Sun Pharma, Dr. Reddy’s, and Cipla export a large share of medicines to the US.
A weak Rupee boosts export revenues, but import costs (like Active Pharmaceutical Ingredients from China) may rise.
Impact: Net positive for export-oriented pharma firms, but mixed for those heavily dependent on imports.
3. Oil & Gas Sector
India imports over 80% of its crude oil needs, priced in Dollars.
A weak Rupee makes oil imports costlier, increasing input costs for companies like IOC, BPCL, HPCL.
This also impacts sectors like aviation, paints, fertilizers, and chemicals, which rely on crude derivatives.
Impact: Rupee depreciation hurts oil & gas and related sectors.
4. Aviation Industry
Airlines like IndiGo, SpiceJet, and Air India earn revenue in Rupees but pay for aircraft leases, maintenance, and fuel in Dollars.
A weak Rupee increases costs significantly, leading to lower margins.
Impact: Rupee depreciation is negative for aviation stocks.
5. Banking & Financial Services
Banks with significant foreign borrowings may face higher repayment costs when the Rupee falls.
However, if they hold Dollar assets, they benefit.
Investor sentiment in the financial sector often mirrors overall macroeconomic stability tied to currency movements.
6. Import-Oriented Companies
Sectors like electronics, automobiles, FMCG (raw materials), and chemicals rely on imports.
A weaker Rupee raises raw material costs, compressing margins unless passed on to consumers.
7. Export-Oriented Manufacturing
Sectors like textiles, gems & jewelry, and leather benefit from a weaker Rupee as global buyers pay in Dollars.
However, if raw materials are imported, the benefits get diluted.
Impact on Foreign Investors
Foreign Institutional Investors (FIIs) are among the biggest drivers of the Indian stock market.
Stable Rupee: Encourages FIIs to invest since currency risk is lower.
Weakening Rupee: Even if stock returns are strong, FIIs may lose money when converting Rupees back to Dollars.
Example: If Nifty rises 10% but the Rupee falls 8% against the Dollar, FIIs net only ~2% returns.
Sudden depreciation often triggers FII outflows, leading to stock market corrections.
Thus, exchange rate stability is as important as stock fundamentals in attracting foreign capital.
Macroeconomic Effects on Stock Market
Inflation: A weak Rupee increases import costs (oil, electronics, machinery), leading to inflation. High inflation reduces corporate margins and consumer demand, pressuring stocks.
Current Account Deficit (CAD): Higher import bills widen CAD, weakening investor confidence.
Government Fiscal Position: Subsidy burdens (fertilizers, fuel) rise with Dollar appreciation, impacting fiscal deficit and bond yields, indirectly affecting equities.
Monetary Policy: RBI may raise interest rates to defend the Rupee, impacting borrowing costs and stock valuations.
The Way Forward
India’s growing integration into the global economy ensures that the Rupee-Dollar dynamic will continue to influence stocks. Key trends to watch:
US Federal Reserve policies – Dollar movements globally.
Energy Transition – Reducing oil imports will lower currency vulnerability.
Boosting Exports – Government initiatives like PLI schemes strengthen export-led sectors.
RBI Interventions – Maintaining stability via forex reserves.
Conclusion
The Rupee-Dollar exchange rate is more than just a number—it’s a reflection of India’s economic health, trade balance, and global investor confidence. Its impact on the stock market is far-reaching:
Exporters like IT and Pharma gain from Rupee weakness.
Import-heavy sectors like oil, aviation, and FMCG suffer.
Investors—both domestic and foreign—adjust portfolios based on currency trends.
Macroeconomic stability is closely linked to exchange rate dynamics.
For stock market participants, understanding this relationship provides an edge in making informed investment decisions. In the long run, India’s structural reforms, increasing exports, and growing financial depth may reduce vulnerability to Rupee-Dollar volatility. Until then, every swing in the currency will continue to ripple across Dalal Street.
Emerging Sectors in India1. Information Technology & Digital Economy
India’s IT sector has been the backbone of its global image for decades. But the story is evolving. It’s no longer just about outsourcing or call centers; today, India is building entire digital ecosystems. Cloud computing, SaaS (Software as a Service), big data analytics, and cybersecurity are driving a new phase of IT growth.
The adoption of 5G, Artificial Intelligence (AI), and Internet of Things (IoT) is expanding opportunities for IT firms. With global businesses increasingly looking for digital transformation partners, Indian IT companies like Infosys, TCS, Wipro, and HCL are evolving from service providers into strategic partners.
Moreover, India’s digital economy is expected to reach $1 trillion by 2030, with growth driven by digital payments, e-commerce, and digital infrastructure.
2. Fintech & Digital Payments
India has become a global leader in digital payments. The success of UPI (Unified Payments Interface) is a case study for the world, processing billions of transactions every month. Startups like PhonePe, Paytm, BharatPe, and Razorpay are revolutionizing how money moves across the economy.
Beyond payments, fintech innovation includes:
Digital lending platforms
Insurtech solutions
WealthTech & robo-advisory
Blockchain-based financial services
Government initiatives like Jan Dhan Yojana, Digital India, and financial inclusion policies have enabled fintech adoption even in rural India. By 2030, India’s fintech industry could surpass $200 billion in revenues.
3. E-commerce & Online Marketplaces
E-commerce is one of the fastest-growing consumer-facing sectors. With the world’s largest youth population and rising internet penetration, platforms like Amazon, Flipkart, Meesho, and Nykaa are driving a retail revolution.
Key drivers:
Growing middle-class consumption
Rapid adoption of online grocery & fashion retail
Expansion of logistics and supply chain tech
Rise of social commerce & direct-to-consumer (D2C) brands
By 2030, India’s e-commerce market is projected to reach $350–400 billion, making it the third-largest in the world after China and the US.
4. Electric Vehicles (EVs) & Green Mobility
India’s transportation sector is undergoing a green transformation. With rising pollution levels and energy dependence on oil imports, electric mobility has become a national priority.
Key developments:
Government subsidies under FAME (Faster Adoption and Manufacturing of Hybrid and Electric Vehicles)
PLI scheme for EV batteries
Entry of global players like Tesla (expected)
Domestic innovation by Ola Electric, Ather Energy, and Tata Motors
EV adoption in two-wheelers, buses, and delivery fleets is picking up faster than passenger cars, given India’s cost-sensitive market. By 2030, EVs could form 30% of all vehicle sales in India.
5. Renewable Energy & Clean Tech
India is one of the world’s largest consumers of energy. To reduce fossil fuel dependency, the government has set ambitious renewable energy targets: 500 GW of renewable capacity by 2030.
Solar and wind power dominate, but new areas like green hydrogen, battery storage, and waste-to-energy are gaining attention. Companies like Adani Green, ReNew Power, and NTPC are spearheading massive renewable projects.
With global ESG (Environmental, Social, Governance) investments rising, India’s renewable energy sector could attract trillions in foreign investment over the next two decades.
6. Biotechnology & Healthcare Innovation
India’s pharmaceutical industry is already known as the “pharmacy of the world”, but biotechnology and healthcare innovation are expanding the sector further.
Emerging areas:
Gene therapy and personalized medicine
Biotechnology in agriculture and food security
Telemedicine and digital health platforms
Medical devices and diagnostics
Startups in health-tech (Practo, 1mg, PharmEasy) are bridging gaps in healthcare access. With rising health awareness and global demand, India’s biotech industry could reach $150 billion by 2025.
7. EdTech (Education Technology)
India has one of the largest student populations in the world, creating huge demand for quality education. EdTech platforms like Byju’s, Unacademy, Vedantu, and PhysicsWallah are transforming how students learn.
Key innovations:
Live online classes
AI-based personalized learning
Skill development & upskilling platforms
AR/VR-based immersive education
Though growth slowed after the pandemic boom, long-term demand for hybrid and skill-focused education will keep EdTech a strong emerging sector.
8. Agritech & Food Processing
Agriculture still employs 40% of India’s workforce, but productivity is low. Agritech startups are using AI, IoT, blockchain, and drones to modernize farming.
Examples:
DeHaat, Ninjacart (farm-to-market supply chains)
Stellapps (dairy tech)
AgroStar (input advisory & marketplace)
Meanwhile, food processing is gaining momentum, with India moving from raw produce to value-added exports. This sector could generate millions of jobs and boost farmers’ income significantly.
9. Space Technology & Satellite Services
India’s space sector, led by ISRO, is opening up to private players. With the success of Chandrayaan-3 and Aditya-L1, global attention is on India’s space tech.
Private startups like Skyroot, Agnikul Cosmos, and Pixxel are innovating in satellite launch services, earth observation, and space-based applications.
The government’s IN-SPACe policy and privatization efforts could turn India into a global hub for affordable space technology.
10. Artificial Intelligence, Robotics & Automation
AI and automation are transforming multiple industries, from finance to healthcare to manufacturing. India’s AI market is expected to reach $17 billion by 2027.
Applications include:
AI in customer service (chatbots, voice assistants)
Robotics in manufacturing and logistics
AI-driven medical imaging
Smart cities and predictive governance
Indian IT and startups are actively adopting AI tools, with government initiatives supporting skill development in this field.
Conclusion
India stands at a historic crossroads. The emerging sectors described above are not just industries – they represent the aspirations of a young, ambitious nation aiming for global leadership. With strong policy support, rapid digital adoption, and entrepreneurial energy, India is building the foundations of a $5–10 trillion economy.
While challenges remain, the direction is clear: India’s growth story will be powered by emerging sectors that combine innovation, sustainability, and inclusivity.

Consumer Price Index (CPI) in India1. Understanding the Consumer Price Index (CPI)
The CPI reflects the purchasing power of a country's currency by tracking price changes in a representative basket of goods and services. In India, the Ministry of Statistics and Programme Implementation (MoSPI) compiles the CPI using a base year of 2012. The index is categorized into several groups, including:
Food and Beverages: Comprising items like cereals, pulses, vegetables, fruits, and beverages.
Housing: Reflecting the cost of housing in urban areas.
Clothing and Footwear: Encompassing garments and footwear.
Fuel and Light: Including energy costs such as electricity and fuel.
Miscellaneous: Covering items like education, health, transport, and communication.
Each category has a specific weight in the overall CPI calculation, influencing its impact on the total inflation rate.
2. Recent Trends in India's CPI
July 2025: A Historic Low
In July 2025, India's CPI inflation rate fell to a remarkable 1.55%, the lowest since June 2017. This decline was primarily driven by a significant drop in food prices, with the Consumer Food Price Index (CFPI) turning negative at -1.76%. This marked the first instance of negative food inflation since January 2019
The Times of India
.
The breakdown of inflation rates by sector in July 2025 was as follows:
Rural Areas: Headline inflation at 1.18%, with food inflation at -1.74%.
Urban Areas: Headline inflation at 2.05%, with food inflation at -1.90%.
Combined (All India): Headline inflation at 1.55%, with food inflation at -1.76%
Statistics Ministry
.
These figures indicate a broad-based decline in inflation across both rural and urban sectors.
Factors Contributing to the Decline
Several factors contributed to the sharp decline in CPI inflation:
Base Effect: The high inflation rates in the previous year created a favorable base for comparison, amplifying the perceived decline in current inflation.
Falling Food Prices: A significant decrease in the prices of essential food items, including pulses, vegetables, and cereals, led to negative food inflation.
Stable Fuel Prices: The moderation in fuel prices helped contain overall inflationary pressures.
Government Policies: Measures such as the reduction in Goods and Services Tax (GST) rates on essential items provided relief to consumers and helped lower prices.
3. Sectoral Analysis of CPI Components
Food and Beverages
Food inflation plays a pivotal role in the overall CPI, given its substantial weight in the index. In July 2025, food inflation turned negative, with the CFPI at -1.76%. This was attributed to:
Abundant Harvests: Favorable monsoon conditions led to increased agricultural production, resulting in lower food prices.
Government Interventions: Policies aimed at ensuring food security and stabilizing prices contributed to the decline in food inflation.
Housing
Housing inflation remained relatively stable, with a slight decrease from 3.18% in June 2025 to 3.17% in July 2025. This stability reflects the consistent demand for housing in urban areas and the ongoing challenges in the real estate sector.
Clothing and Footwear
Inflation in this category remained subdued, aligning with the overall trend of reduced consumer spending and stable supply chains.
Fuel and Light
Fuel inflation saw a marginal increase from 2.55% in June 2025 to 2.67% in July 2025. While global oil prices remained volatile, domestic factors such as exchange rates and taxation influenced fuel prices.
Miscellaneous Categories
Education: Inflation in education services remained high at 4.00%, reflecting the increasing cost of private education and related services.
Health: Health inflation stood at 4.57%, driven by rising medical costs and healthcare services.
Transport and Communication: Inflation in this sector was 2.12%, influenced by fuel prices and transportation demand.
4. Regional Disparities in Inflation
Inflation rates varied across different states in India. For instance:
Kerala: Recorded a higher inflation rate due to increased demand and higher costs in urban centers.
Jammu & Kashmir: Experienced elevated inflation, partly due to logistical challenges and supply constraints.
Punjab and Karnataka: Saw moderate inflation rates, reflecting balanced supply and demand dynamics.
These regional disparities underscore the importance of localized economic policies to address specific inflationary pressures.
5. The Role of the Reserve Bank of India (RBI)
The RBI closely monitors CPI inflation as part of its monetary policy framework. The central bank aims to maintain inflation within a target range to ensure economic stability. In response to the declining inflation rates:
Interest Rates: The RBI kept the policy interest rate unchanged at 5.50% in its recent review, citing the benign inflation outlook
Reuters
.
Inflation Targeting: The RBI's flexible inflation targeting framework allows for adjustments in policy to respond to evolving economic conditions.
6. Implications for the Economy
The sharp decline in CPI inflation has several implications:
Consumer Purchasing Power: Lower inflation enhances consumers' purchasing power, potentially boosting demand for goods and services.
Monetary Policy: The RBI's accommodative stance may support economic growth, especially in sectors sensitive to interest rates.
Government Policies: The government may consider fiscal measures to sustain the inflationary trend and support economic recovery.
7. Challenges and Risks
Despite the favorable inflation scenario, several challenges persist:
Global Economic Uncertainties: Fluctuations in global commodity prices and geopolitical tensions can impact domestic inflation.
Supply Chain Disruptions: Ongoing supply chain issues may lead to price volatility in certain sectors.
Monsoon Variability: Dependence on monsoon for agricultural output makes food prices susceptible to climatic variations.
8. Future Outlook
Looking ahead, the CPI inflation trajectory will depend on:
Monsoon Performance: A normal monsoon is crucial for stable food prices.
Global Commodity Prices: Movements in global oil and commodity markets will influence domestic inflation.
Policy Interventions: Continued fiscal and monetary measures will play a role in managing inflation expectations.
Economists forecast that CPI inflation may remain within the RBI's target range in the near term, barring significant external shocks.
9. Conclusion
The Consumer Price Index serves as a vital barometer of economic health in India. The recent decline in CPI inflation reflects a combination of favorable domestic conditions and effective policy measures. However, sustained vigilance is necessary to address emerging challenges and ensure that inflation remains conducive to economic growth and stability.

India’s Growing Derivatives Market & Weekly Expiries1. Introduction
Financial markets act as the lifeblood of an economy, channelizing savings into productive investments. Within these markets, derivatives have emerged as a vital instrument for managing risk, enhancing liquidity, and providing opportunities for speculation and arbitrage. India, which once lagged behind developed economies in terms of derivatives trading, has today become one of the most vibrant derivative markets in the world.
A unique feature of India’s equity derivatives market is the introduction of weekly expiries, which has not only boosted participation but also changed trading patterns significantly. Weekly options, in particular, have become extremely popular, contributing to record-breaking turnover in Indian exchanges.
This essay explores the growth of India’s derivatives market, the mechanics of weekly expiries, their impact on market behavior, and what lies ahead for India in the global derivatives landscape.
2. Understanding Derivatives
Derivatives are financial contracts whose value is derived from an underlying asset such as equities, indices, commodities, currencies, or interest rates. The main types of derivatives include:
Futures – Contracts obligating the buyer to purchase or the seller to sell an asset at a future date at a predetermined price.
Options – Contracts that give the buyer the right, but not the obligation, to buy (Call) or sell (Put) the underlying asset at a set price before or on expiration.
Swaps – Agreements to exchange cash flows or other financial instruments, often linked to interest rates or currencies.
Forwards – Customized contracts similar to futures but traded over-the-counter (OTC).
Derivatives are used for:
Hedging risk against adverse price movements.
Speculation to profit from price volatility.
Arbitrage opportunities from price discrepancies across markets.
In India, the primary focus has been on exchange-traded derivatives, particularly index futures, stock futures, index options, and stock options.
3. Historical Evolution of Derivatives in India
The Indian derivatives market has grown in phases:
Pre-2000s: Derivatives trading was virtually non-existent, with forward contracts and informal hedging practices dominating.
2000: NSE introduced index futures, followed by stock futures and options. This marked the formal beginning of exchange-traded derivatives.
2001-2010: Rapid growth with increasing investor participation. Index options gained popularity, especially on Nifty 50.
2010-2015: Introduction of new products, including currency derivatives and commodity derivatives, deepened the market.
2016-Present: Weekly options expiries on Bank Nifty (later Nifty and FINNIFTY) fueled a new wave of retail and institutional interest.
Today, India ranks among the largest derivatives markets globally in terms of contracts traded, with a massive rise in retail participation driven by technology, mobile trading, and lower transaction costs.
4. Structure of India’s Derivatives Market
Key Exchanges
National Stock Exchange (NSE): Dominates equity derivatives trading with over 90% market share.
Bombay Stock Exchange (BSE): A smaller share but gaining traction through products like Sensex options.
MCX & NCDEX: Commodity derivatives platforms.
Key Products
Index Derivatives: Nifty 50, Bank Nifty, and FINNIFTY options are the most liquid.
Stock Derivatives: Futures and options on large-cap and mid-cap stocks.
Currency Derivatives: Dollar-Rupee and other currency pairs.
Commodity Derivatives: Gold, crude oil, agri commodities, etc.
Participants
Retail traders (rapidly growing, especially in weekly options).
Institutional investors (mutual funds, FIIs, insurance companies).
Hedgers (corporates and banks).
Speculators & arbitrageurs (seeking short-term opportunities).
5. Weekly Expiries in India: The Game Changer
What are Weekly Expiries?
Traditionally, derivatives contracts had monthly expiries. For example, Nifty options would expire on the last Thursday of every month. However, NSE introduced weekly expiries in 2016 for Bank Nifty options, later extending to Nifty 50 and FINNIFTY.
Bank Nifty Options: Expire every Thursday.
Nifty Options: Expire every Thursday (with monthly still available).
FINNIFTY Options: Expire every Tuesday.
Sensex Options (BSE): Expire every Friday.
This means traders now have contracts expiring almost every day of the week, providing more flexibility and opportunities.
Why Weekly Options Became Popular?
Low Premiums: Since weekly options have a shorter time to expiry, they trade cheaper, attracting retail traders.
Quick Turnover: Traders don’t have to wait an entire month; they can capture short-term moves.
High Liquidity: Bank Nifty and Nifty weekly options see some of the highest daily turnover in the world.
Speculative Opportunities: High leverage and volatility near expiry days create big profit (and loss) potential.
Hedging Short-Term Events: Earnings announcements, policy decisions, and global events can be hedged with weekly contracts.
6. Impact of Weekly Expiries on Indian Markets
Positive Impacts
Liquidity Surge: Weekly expiries brought unprecedented liquidity to Indian options markets.
Retail Participation: The affordability of weekly premiums made derivatives accessible to small traders.
Revenue for Exchanges: Explosive growth in contracts traded significantly increased exchange turnover.
Efficient Hedging: Corporates and institutions can hedge short-term risks more precisely.
Negative Impacts
Rise in Speculation: Retail traders often take excessive risks, leading to high losses.
Increased Volatility on Expiry Days: Option writers adjust positions aggressively near expiries, causing intraday swings.
Behavioral Issues: Many retail traders view weekly options as “lottery tickets,” leading to unhealthy trading habits.
Conclusion
India’s derivatives market has transformed from a fledgling sector in the early 2000s into a global leader in contract volumes. The introduction of weekly expiries revolutionized participation, making derivatives more accessible, liquid, and event-driven.
While weekly options have opened doors for small traders, they also bring higher risks due to speculation, volatility, and leverage. For India, the challenge lies in nurturing this growth while safeguarding investors through education, regulation, and innovation.
If managed well, India’s derivatives ecosystem will not only support domestic financial stability but also position the country as a leading hub for global derivatives trading.

Global Events Impacting Nifty & Sensex1. The Role of Globalization in Stock Markets
Before diving into specific events, it’s important to understand why global developments matter for India’s Nifty and Sensex.
Foreign Institutional Investors (FIIs):
FIIs are among the biggest drivers of India’s stock markets. Their decisions are often influenced by global risk appetite, interest rates abroad, and international events. If FIIs buy, markets rally. If they sell, markets often correct.
Trade and Commodities:
India is one of the largest importers of crude oil and commodities. Global supply chain issues, trade wars, or sanctions directly affect inflation, current account deficit, and corporate profitability, thereby impacting indices.
Currency Movements:
The rupee’s exchange rate against the U.S. dollar is heavily influenced by global factors. A stronger dollar can lead to FII outflows, while a weaker dollar generally benefits emerging markets like India.
Interconnected Economies:
A slowdown in the U.S., Europe, or China affects global demand. Since Indian companies export software, pharmaceuticals, textiles, and engineering goods globally, their revenues depend on world economic conditions.
This interconnectedness means that even if domestic fundamentals are strong, global shocks can influence Indian equity indices.
2. Global Monetary Policies and Interest Rates
One of the most consistent global factors that affect Nifty and Sensex is monetary policy decisions of major central banks, especially the U.S. Federal Reserve, the European Central Bank (ECB), and the Bank of Japan (BoJ).
U.S. Federal Reserve (The Fed):
The Fed’s interest rate decisions directly impact the flow of capital. When the Fed hikes rates, U.S. bonds become more attractive, leading to capital outflows from emerging markets like India. This often causes pressure on Nifty and Sensex. Conversely, rate cuts or dovish policies encourage FIIs to invest in Indian equities.
Quantitative Easing & Tightening:
During crises (like 2008 or COVID-19), central banks inject liquidity through QE. This “easy money” often flows into Indian markets, creating rallies. On the flip side, tapering or tightening leads to corrections.
Impact on Currency:
Interest rate hikes abroad strengthen the U.S. dollar, weakening the rupee. This affects import costs, inflation, and overall market sentiment.
Example:
In 2013, the U.S. Fed hinted at tapering its bond-buying program (“Taper Tantrum”). This led to a sharp fall in emerging markets, including India, with Sensex and Nifty witnessing major corrections.
3. Oil Prices and Energy Shocks
Crude oil is often called the “lifeblood” of the Indian economy because India imports nearly 80% of its crude requirements.
High Oil Prices:
Rising crude prices increase India’s import bill, fuel inflation, widen the current account deficit, and reduce corporate profitability. This usually leads to negative sentiment in Nifty and Sensex.
Falling Oil Prices:
Lower oil prices act like a tax cut for the Indian economy. They reduce inflation, boost consumer spending, and improve margins for companies. This often supports rallies.
Geopolitical Influence:
Events like tensions in the Middle East, OPEC+ production decisions, or sanctions on major oil-producing nations can cause volatility in global oil prices, which in turn directly impacts Indian markets.
Example:
In 2022, the Russia-Ukraine war pushed crude oil above $100 per barrel, leading to inflationary pressures and corrections in Indian equity indices.
4. Geopolitical Conflicts and Wars
Global conflicts often trigger risk-off sentiment, where investors move out of risky assets (like equities) into safe havens (like gold and U.S. bonds).
Wars:
Conflicts such as the Gulf War, U.S.-Iraq war, or Russia-Ukraine war lead to volatility in global markets. Sensex and Nifty often see short-term corrections.
Terrorist Attacks:
Events like 9/11 in the U.S. or terrorist incidents in Europe not only affect global travel and trade but also trigger immediate stock market panic worldwide, including India.
China-Taiwan Tensions:
As China is a major trading partner globally, tensions in Asia-Pacific also ripple into Indian equities.
Example:
During the 2022 Russia-Ukraine war, Indian markets corrected sharply in the initial phase due to fears of crude price spikes and FII outflows.
5. Global Economic Slowdowns and Recessions
Recessions in major economies affect Indian exports, global investor sentiment, and FII inflows.
2008 Global Financial Crisis (GFC):
Triggered by the collapse of Lehman Brothers and the U.S. housing bubble, this event led to a meltdown across global markets. Sensex fell from over 21,000 to below 9,000 within months.
European Debt Crisis (2010–12):
Concerns over Greece, Spain, and Italy’s debt led to global volatility. Indian indices too saw fluctuations during this period.
COVID-19 Pandemic (2020):
The pandemic caused global shutdowns, leading to a historic crash in March 2020 when Sensex lost over 13% in a single day. However, due to massive global stimulus, markets recovered sharply in the following months.
6. Global Trade Policies and Protectionism
Trade relations between major economies (especially the U.S. and China) influence global supply chains and investor sentiment.
U.S.-China Trade War:
When the U.S. imposed tariffs on Chinese goods, global markets saw volatility. India was indirectly affected as supply chains were disrupted, though some Indian sectors benefited (like electronics and chemicals).
WTO and Free Trade Agreements:
Global trade liberalization generally benefits Indian exporters. Protectionism, on the other hand, reduces global trade volume, impacting companies listed on Nifty and Sensex.
7. Global Technology Trends and Disruptions
Technology disruptions are global in nature, and India, being a hub for IT services, is directly impacted.
Silicon Valley and U.S. Tech Trends:
Since Indian IT companies earn most revenues from U.S. clients, any slowdown in U.S. tech spending impacts their stock prices, thereby dragging Nifty IT index and influencing the overall Nifty.
Global Cybersecurity Threats:
Large-scale cyberattacks (like the WannaCry ransomware) can impact IT companies and financial markets worldwide.
Artificial Intelligence & Automation:
Technological changes can reshape sectors globally, and Indian companies must adapt quickly.
8. Climate Change and Global Energy Transition
With the world moving towards sustainability, global policies like carbon taxes, ESG investing trends, and green energy transition directly affect Indian companies.
Global ESG Funds:
Many large funds now only invest in companies with strong ESG scores. This has influenced Indian companies listed on Nifty and Sensex to adapt.
Climate Disasters:
Global climate events like floods, hurricanes, and wildfires affect commodity supply chains, insurance costs, and investor sentiment worldwide.
Conclusion
Global events—whether economic, political, or social—have a direct and lasting impact on India’s Nifty and Sensex. In today’s interconnected financial system, Indian investors cannot ignore what happens across the world. From the U.S. Fed’s decisions to oil price shocks, geopolitical tensions, global recessions, or health pandemics, every event ripples into Dalal Street.
Yet, history shows that despite these ups and downs, India’s stock markets have grown over the long run, reflecting the resilience of its economy and corporate sector. For investors, the key is to stay informed, prepared, and disciplined, understanding that while global winds may shake the tree, the roots of India’s growth story remain strong.

Opportunities in PSU Stocks1. Historical Context of PSU Stocks in India
PSUs were originally created with the objective of building India’s industrial and economic base after independence. Since the private sector lacked resources and experience in heavy industries, the government stepped in to build enterprises in key sectors:
Oil & Gas: ONGC, IOC, HPCL, BPCL
Banking & Finance: SBI, PNB, BoB, LIC
Power & Energy: NTPC, NHPC, Power Grid, SJVN
Metals & Mining: Coal India, NMDC, Hindustan Copper
Engineering & Infrastructure: BHEL, NBCC, IRCON, RITES
Defense: HAL, BEL, BDL, Mazagon Dock
Initially, PSUs were seen as the backbone of the economy. Over time, inefficiencies, overstaffing, and political interference reduced their competitive edge. Private sector companies began to outperform them. This led to a long period where PSU stocks underperformed compared to private companies.
However, recent changes in government strategy, digital reforms, capital market participation, and global commodity cycles have shifted the outlook.
2. Why PSU Stocks are Back in Focus
Several factors have brought PSU stocks back into investor interest:
(a) Attractive Valuations
For many years, PSU stocks traded at low price-to-earnings (P/E) multiples compared to private peers. This made them undervalued despite strong fundamentals. Recent re-rating has unlocked opportunities.
(b) High Dividend Yields
PSUs are known for distributing high dividends, as the government is the largest shareholder and depends on dividend income. Some PSU stocks give 4%–10% annual dividend yield, making them attractive for long-term investors.
(c) Government Reforms & Disinvestment
The government has actively promoted disinvestment and privatization (e.g., Air India’s sale, BPCL privatization plans). This increases efficiency, improves market perception, and boosts stock prices.
(d) Revival in Core Sectors
Energy demand, infrastructure growth, and defense modernization are boosting PSU earnings. For example, Power Grid benefits from rising electricity demand, while HAL and BEL gain from India’s defense indigenization push.
(e) Improved Corporate Governance
Many PSUs have adopted better transparency, digital systems, and profit-focused strategies, reducing inefficiency and improving investor confidence.
3. Opportunities Across Different PSU Sectors
3.1. Banking & Financial PSUs
Key Players: SBI, PNB, BoB, Canara Bank, LIC, GIC, REC, PFC
Opportunity:
Public sector banks have cleaned up their balance sheets after years of bad loans (NPAs).
Credit growth is rising as the Indian economy expands.
SBI, the country’s largest bank, has become a strong wealth creator.
LIC, the insurance giant, is expanding beyond traditional markets and can benefit from India’s growing insurance penetration.
NBFCs like REC and PFC benefit from power sector financing demand.
Why Attractive: PSU banks trade at lower valuations than private banks but are witnessing strong earnings growth.
3.2. Oil & Gas PSUs
Key Players: ONGC, IOC, BPCL, HPCL, GAIL, Oil India
Opportunity:
India is heavily dependent on oil & gas imports, making PSUs critical players.
Rising energy demand ensures long-term growth.
GAIL’s gas distribution and pipeline network is expanding with the government’s push for a gas-based economy.
Strategic privatization of BPCL can unlock massive value.
Why Attractive: High dividend yields, global energy price cycles, and government support.
3.3. Power & Energy PSUs
Key Players: NTPC, NHPC, Power Grid, SJVN, Coal India
Opportunity:
India’s power demand is growing rapidly due to urbanization and industrialization.
NTPC is expanding into renewable energy.
Power Grid is a monopoly in transmission with stable cash flows.
Coal India benefits from being the largest coal producer in the world.
Why Attractive: Stable earnings, strong dividend payouts, and long-term demand visibility.
3.4. Defense PSUs
Key Players: HAL, BEL, BDL, Mazagon Dock, GRSE, Cochin Shipyard
Opportunity:
India is pushing for defense indigenization under the Atmanirbhar Bharat initiative.
Defense budget allocation is rising each year.
Export opportunities for Indian defense equipment are growing.
HAL and BEL are showing strong order books with multi-year growth visibility.
Why Attractive: Strategic importance, government support, and long-term contracts.
3.5. Infrastructure & Engineering PSUs
Key Players: BHEL, NBCC, IRCON, RITES, Engineers India
Opportunity:
India’s infrastructure push (roads, railways, housing, smart cities) benefits these companies.
IRCON and RITES are beneficiaries of railway modernization and export of rail technology.
NBCC plays a crucial role in government construction projects.
Why Attractive: Government-backed contracts, order book strength, and growth in infrastructure spending.
3.6. Metals & Mining PSUs
Key Players: NMDC, Hindustan Copper, MOIL, NALCO
Opportunity:
Commodity supercycles and rising demand for minerals (iron ore, copper, manganese, aluminum) benefit these PSUs.
NMDC is a low-cost iron ore producer, while NALCO is expanding aluminum production.
Electric vehicle (EV) growth increases demand for copper and aluminum.
Why Attractive: Global commodity upcycle, cost advantage, and strong government backing.
4. Key Strengths of PSU Stocks
Stable Business Models – Many PSUs enjoy monopolies or dominant positions in their industries.
Dividend Income – Attractive for long-term investors seeking passive income.
Government Support – Financial backing, bailout potential, and favorable policies.
Strategic Importance – PSUs play critical roles in defense, energy, and infrastructure.
Value Unlocking via Privatization – Upcoming privatizations can lead to stock re-rating.
5. Risks in PSU Stocks
While opportunities are strong, investors must be aware of risks:
Government Intervention – Policy decisions can affect profitability (e.g., fuel price controls for OMCs).
Competition from Private Sector – Private banks, energy companies, and defense startups pose challenges.
Global Commodity Price Volatility – Affects PSU metal, mining, and oil companies.
Disinvestment Delays – Political opposition or market conditions can slow privatization.
Efficiency Concerns – Despite improvements, some PSUs still face bureaucratic inefficiencies.
6. Investment Strategies in PSU Stocks
Dividend Investing – Focus on high-yield PSU stocks like Coal India, NTPC, Power Grid.
Value Investing – Buy undervalued PSUs trading at low P/E or P/B ratios.
Thematic Investing – Play sectors like defense indigenization (HAL, BEL) or renewable energy (NTPC, SJVN).
Disinvestment Opportunities – Monitor privatization candidates for potential re-rating.
Balanced Portfolio – Mix of stable dividend PSUs and growth-oriented defense/infra PSUs.
7. Outlook for PSU Stocks in India
The next decade could be transformational for PSU companies. Key trends driving growth:
India’s $5 trillion economy target will need massive energy, infrastructure, and defense spending.
Privatization push will unlock value and reduce inefficiencies.
Renewable energy expansion will benefit NTPC, NHPC, and SJVN.
Defense exports will grow as India becomes a global supplier.
Digitalization in PSU banks will improve competitiveness.
Foreign institutional investors (FIIs) and domestic investors are increasingly allocating capital to PSU stocks, indicating confidence in their long-term prospects.
Conclusion
PSU stocks in India are no longer “sleeping giants.” They have evolved into strong wealth-creating opportunities, backed by government reforms, improved efficiency, sectoral growth, and undervaluation compared to private peers.
Opportunities exist across multiple sectors: banking, energy, defense, infrastructure, and commodities. While risks remain in terms of government interference and competition, the overall outlook is positive.
For long-term investors, PSU stocks offer a unique combination of dividend income, stability, and growth potential. With India’s economic rise, PSU stocks can play a central role in wealth creation for investors who are willing to stay patient and selective.

Sustainable Finance in India1. Understanding Sustainable Finance
Sustainable finance is broadly defined as financing and investment decisions that take into account not only financial returns but also environmental and social impacts. The core objectives include:
Environmental Responsibility: Supporting initiatives that reduce carbon footprints, promote renewable energy, manage natural resources, and foster climate adaptation.
Social Inclusion: Financing projects that reduce inequality, provide affordable healthcare and education, and support marginalized communities.
Governance Accountability: Ensuring transparency, ethical conduct, and responsible corporate practices.
Sustainable finance is thus the backbone of green growth, which prioritizes ecological balance without compromising development.
2. Evolution of Sustainable Finance in India
The roots of sustainable finance in India can be traced back to the early 2000s, but momentum has significantly increased in the past decade.
2007: India’s first Corporate Social Responsibility (CSR)-linked financing practices gained attention.
2012: Securities and Exchange Board of India (SEBI) introduced mandatory Business Responsibility Reports (BRR) for top listed companies.
2015: The Indian government launched the National Electric Mobility Mission and issued guidelines on renewable energy investments.
2016 onwards: The rise of green bonds and increased global investor interest in India’s renewable energy projects.
2021: India announced the net-zero by 2070 pledge at COP26, creating a roadmap for sustainable financing needs.
2023: SEBI made Business Responsibility and Sustainability Reporting (BRSR) mandatory for top 1,000 listed companies.
This journey reflects India’s gradual integration of sustainability into mainstream finance.
3. Key Drivers of Sustainable Finance in India
Several factors have accelerated the growth of sustainable finance in India:
a) Climate Change Commitments
India has pledged to reduce carbon intensity of GDP by 45% by 2030 and achieve 50% renewable energy capacity by 2030. Financing these transitions requires sustainable investments.
b) Policy and Regulatory Push
Policies like Perform, Achieve, and Trade (PAT) scheme, Renewable Energy Auctions, and SEBI’s ESG reporting mandates have pushed companies to adopt sustainable practices.
c) Investor Preferences
Global and domestic investors are increasingly prioritizing ESG-compliant businesses, leading to a surge in green bonds, ESG mutual funds, and sustainability-linked loans.
d) Corporate Responsibility
Indian companies are realizing that long-term growth depends on environmental stewardship, resource efficiency, and social inclusivity.
e) International Influence
Institutions like the World Bank, Asian Development Bank, and IFC are channeling billions of dollars into India’s green energy and sustainable infrastructure projects.
4. Sustainable Finance Instruments in India
a) Green Bonds
Green bonds are debt instruments where proceeds are used exclusively for financing climate-friendly projects such as solar, wind, waste management, and sustainable transport.
India issued its first green bond in 2015 by Yes Bank.
As of 2023, India has raised over $20 billion through green bonds.
The government launched its first sovereign green bond in 2023 worth ₹16,000 crore.
b) ESG Funds
Mutual funds and asset managers in India are offering ESG-focused funds. As of 2023, ESG funds in India have assets under management (AUM) of over ₹12,000 crore.
c) Sustainability-Linked Loans (SLLs)
Banks and financial institutions are tying loan terms to borrowers’ ESG performance, incentivizing companies to meet sustainability targets.
d) Blended Finance
Combining public and private capital to fund projects like affordable housing, clean water, and renewable energy. This de-risks investments for private players.
e) Carbon Markets
India is developing a voluntary carbon credit market where businesses can trade carbon offsets. This provides a financial incentive for emission reductions.
f) Green Insurance
Insurance products designed to cover renewable energy projects and climate-related risks are gradually emerging.
5. Role of Regulators and Institutions
a) Securities and Exchange Board of India (SEBI)
Introduced BRSR reporting.
Regulates ESG fund disclosures to ensure transparency.
b) Reserve Bank of India (RBI)
Published a Discussion Paper on Climate Risk and Sustainable Finance (2022).
Encouraging banks to assess climate-related risks in lending.
c) Ministry of Finance
Issuing sovereign green bonds.
Partnering with international climate finance organizations.
d) Indian Banks and NBFCs
SBI, ICICI, and HDFC have launched green finance products.
Rural banks are financing solar pumps and microgrids.
e) International Agencies
The World Bank, ADB, and IFC are major contributors to India’s renewable energy financing.
6. Sectors Benefiting from Sustainable Finance
Renewable Energy: Solar, wind, biomass, and hydropower projects.
Electric Mobility: EV infrastructure, charging stations, and battery manufacturing.
Sustainable Agriculture: Organic farming, drip irrigation, and agri-tech solutions.
Green Buildings: Energy-efficient real estate and smart city projects.
Water and Waste Management: Recycling, sewage treatment, and waste-to-energy plants.
Healthcare and Education: Inclusive access to services for underprivileged communities.
7. Challenges Facing Sustainable Finance in India
Despite progress, India faces several hurdles:
Limited Awareness: Many investors and corporates are still unfamiliar with ESG principles.
Greenwashing Risks: Companies sometimes overstate sustainability claims to attract investments.
High Financing Costs: Green projects often involve higher upfront costs and long payback periods.
Regulatory Gaps: Lack of unified sustainability standards across industries.
Limited Domestic Capital: Heavy reliance on foreign investments for green finance.
Infrastructure Bottlenecks: Grid connectivity and storage challenges for renewable energy projects.
8. Case Studies of Sustainable Finance in India
a) ReNew Power
A leading renewable energy company that raised significant funding through green bonds, contributing to India’s solar and wind capacity.
b) State Bank of India (SBI)
Issued green bonds worth $650 million to fund renewable energy and electric mobility.
c) Government’s Sovereign Green Bonds (2023)
Proceeds allocated to solar energy projects, afforestation, and energy-efficient housing.
Conclusion
Sustainable finance is not just a trend in India—it is a necessity. With climate change posing existential risks, the integration of ESG principles into financial systems is essential for long-term stability and growth. India, as one of the world’s fastest-growing economies and a key player in global climate action, must continue to accelerate its sustainable finance journey.
The combined efforts of regulators, corporations, investors, and citizens will shape India’s financial ecosystem into one that is resilient, inclusive, and aligned with the United Nations Sustainable Development Goals (SDGs). From sovereign green bonds to ESG-driven investments, India is laying the foundation of a sustainable financial future that balances profit with purpose, growth with inclusivity, and development with environmental stewardship.

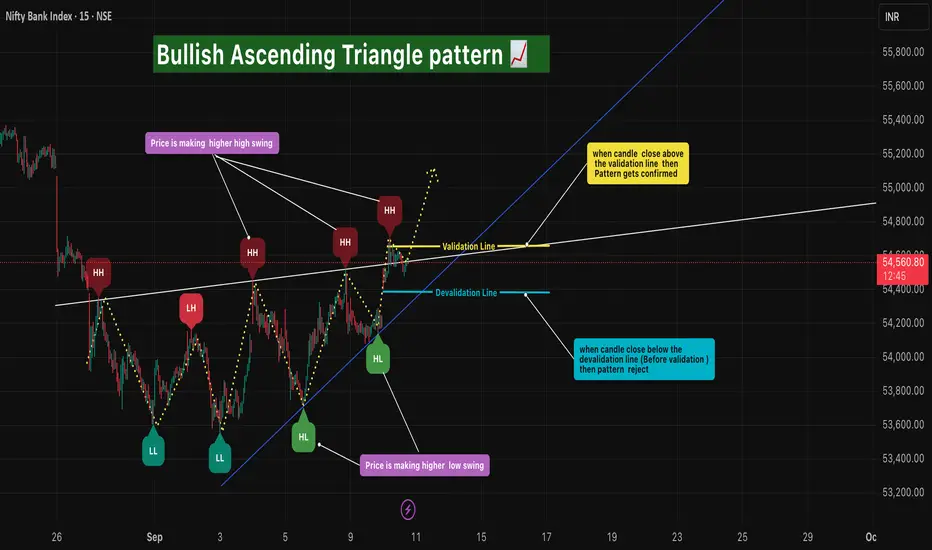
Bullish Ascending Triangle pattern🔎 Intro / Overview
The Bullish Ascending Triangle is a continuation pattern that signals strength in an uptrend 📈.
It forms as price creates Higher Highs and Higher Lows in sequence, compressing toward a breakout level.
This structure shows buyers stepping in at higher levels while sellers gradually weaken, often leading to a bullish breakout.
___________________________________________________________
📌 How to Use
Identify a prior uptrend → the base condition for Ascending Triangle.
Price consolidates by forming Higher Lows and retesting the same resistance level.
Validation → Mark the close of candle that break upper trend line
Devalidation → Swing Low ( when any candle break the upper trend line).
Entry → Confirmed only when price closes above the Validation level .
Stop Loss → Swing Low (Candle break the upper trend line ).
Target → Equal to the measured height of the triangle or 1R multiples.
___________________________________________________________
🎯 Trading Plan
Entry → On breakout close above Validation level.
Stop Loss → Swing Low (Candle break the upper trend line ).
Target → Conservative 1R, Moderate 2R,
Remaining lots → Trail using ATR, Fibonacci, or structural swing highs.
___________________________________________________________
📊 Chart Explanation
Price starts in an uptrend.
Forms a sequence of Higher Highs and Higher Lows .
Resistance holds flat at the top, forming the Ascending Triangle shape 🔺.
Breakout above the Higher High Validation line triggers entry ✅.
Swing Low = Devalidation ⛔.
Target 1 achieved 🎯, trailing used for further upside 🚀.
___________________________________________________________
👀 Observation
Works best as a continuation pattern in established uptrends.
A strong bullish breakout candle adds conviction.
Sideways/choppy markets may cause false breakouts → validation rules filter them.
Volume confirmation strengthens the setup.
___________________________________________________________
❗ Why It Matters?
Represents buyer dominance with sellers weakening over time.
Provides a clear breakout entry with strict SL and TP.
Helps traders capture trending moves while minimizing false signals.
Rule-based framework improves discipline and consistency.
___________________________________________________________
🎯 Conclusion
The Bullish Ascending Triangle Pattern is a reliable continuation signal for trend traders.
By combining Higher Highs, Higher Lows, and breakout confirmation, traders can enter with confidence, manage risk, and trail profits effectively.
🔥 Patterns don’t predict. Rules protect. 🚀
___________________________________________________________
⚠️ Disclaimer
📘 For educational purposes only.
🙅 Not SEBI registered.
❌ Not a buy/sell recommendation.
🧠 Purely a learning resource.
📊 Not Financial Advice.
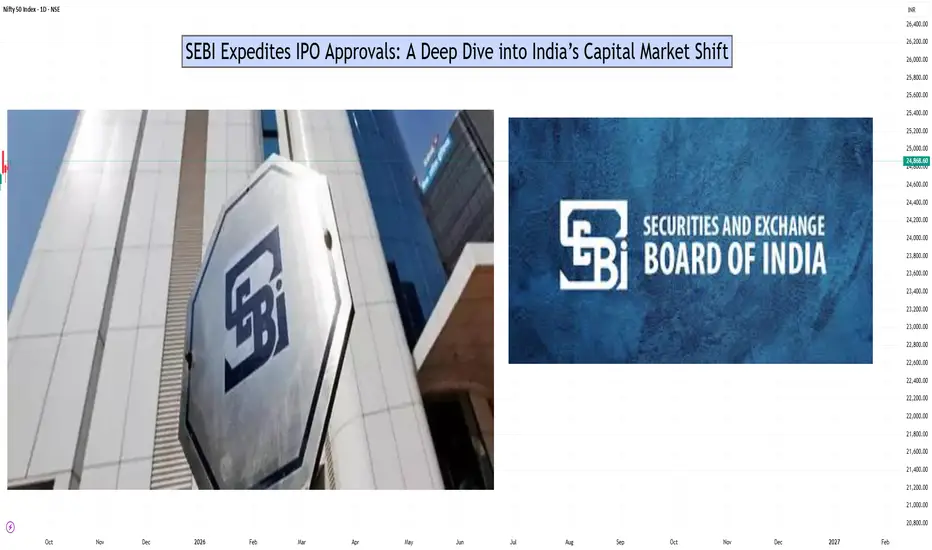
SEBI Expedites IPO Approvals: A Deep Dive into India’s Capital SEBI Expedites IPO Approvals: A Deep Dive into India’s Capital Market Shift
1. Introduction
The Securities and Exchange Board of India (SEBI) has recently undertaken a significant step—fast-tracking Initial Public Offering (IPO) approvals. Traditionally, IPO approval in India has been a lengthy process, often stretching to six months. But SEBI’s new measures aim to cut this time nearly in half, potentially bringing it down to three months or less.
This shift comes at a time when India’s equity markets are booming, with record levels of fundraising expected in 2025. After raising around $20.5 billion through IPOs in 2024, analysts predict that 2025 could surpass this figure. According to reports, $8.2 billion has already been raised so far in 2025, with an additional $13 billion in IPOs already approved and nearly ₹18.7 billion pending approval.
2. Why SEBI is Expediting IPO Approvals
Several factors are driving SEBI to accelerate the IPO pipeline:
Surging Investor Appetite
Indian retail participation in stock markets has seen an explosion in recent years.
Over 11 crore Demat accounts are active as of 2025, compared to just 3.6 crore in 2019.
More retail investors mean more demand for IPOs, making faster approvals essential.
Global Capital Flows
India is seen as one of the fastest-growing large economies.
With global investors diversifying away from China, India is attracting billions in Foreign Portfolio Investments (FPIs).
A streamlined IPO process will help India capture this liquidity flow before it moves elsewhere.
Boosting Startup Ecosystem
Unicorns like PhysicsWallah, Urban Company, and WeWork India are preparing for listings.
Startups require quicker capital-raising routes to compete globally.
Regulatory Efficiency and AI Adoption
SEBI is now deploying AI-powered document screening tools to check IPO filings.
This reduces human delays and allows faster compliance checks.
Collaboration with merchant bankers and exchanges has also been strengthened.
Record Fundraising Target
SEBI expects India to break the $20B mark again in 2025, possibly setting an all-time record.
Expedited approvals are central to making this happen.
3. How the New Approval System Works
Traditionally, IPO approvals involved multiple manual steps:
Filing of Draft Red Herring Prospectus (DRHP).
SEBI reviews disclosures, company financials, risk factors, and governance.
Queries are raised with the company, leading to back-and-forth communication.
Final approval takes 4–6 months.
Now under the fast-track mechanism:
AI Pre-Screening: Automated checks scan filings for missing data, compliance issues, and inconsistencies.
Concurrent Review: Instead of sequential reviews, SEBI, merchant bankers, and exchanges review documents simultaneously.
Time-Bound Queries: Companies are given strict deadlines to respond to SEBI’s queries.
Standardization: Risk disclosure formats and governance checks are now standardized across sectors.
This is expected to cut approval timelines by 40–50%.
4. IPO Pipeline for 2025
Some big-ticket IPOs in the pipeline include:
PhysicsWallah (₹3,820 crore) – Edtech unicorn expanding into AI-driven education.
Urban Company – Already raised ₹854 crore from anchor investors; IPO opening soon.
LG Electronics India – Large consumer electronics brand targeting India’s growing tech-savvy population.
WeWork India – Despite global challenges, the Indian arm remains profitable and expansion-focused.
Credila Financial Services – Education loan subsidiary of HDFC, a high-demand financial segment.
The SME IPO market is equally hot with listings like Goel Construction debuting at a 15% premium and Prozeal Green Energy getting SEBI approval.
5. Benefits of Faster IPO Approvals
For Companies
Quicker access to capital for expansion.
Ability to capitalize on favorable market sentiment without delays.
Reduced costs of prolonged regulatory processes.
For Investors
More frequent and diverse IPO opportunities.
Increased transparency due to standardized disclosures.
Higher liquidity as more firms enter the public market.
For Indian Markets
Strengthened image of India as an investment hub.
Alignment with global best practices (US SEC and Hong Kong’s IPO process are faster).
Improved global competitiveness for Indian startups.
6. Risks and Challenges
Speed vs. Quality
Faster approvals must not compromise on due diligence.
Weak companies slipping through could hurt investor trust.
Market Saturation
Too many IPOs in a short span could lead to oversupply, reducing listing gains.
Retail Investor Overexposure
Retail investors may flock to IPOs without understanding fundamentals, increasing risk of losses.
Global Volatility
Geopolitical tensions, US interest rate decisions, or oil price shocks can derail IPO plans.
7. Global Context
Globally, IPO markets have been mixed:
US Markets: Tech IPOs are recovering but still face valuation pressure.
China: Tighter regulations have slowed down IPO fundraising.
Middle East: Saudi Arabia and UAE continue to see large IPOs in energy and infrastructure.
In this scenario, India is positioning itself as a global IPO leader, especially in the tech and services sector.
8. Investor Strategy for 2025 IPOs
For investors, the IPO rush creates both opportunities and challenges. Some strategies include:
Focus on Fundamentals
Look for companies with strong financials, governance, and growth potential.
Avoid IPOs driven purely by hype.
Anchor Investor Signals
Strong anchor participation (like Urban Company’s ₹854 Cr funding) signals institutional confidence.
Sector Plays
Edtech, Renewable Energy, Fintech, and Consumer Services are hot sectors.
Traditional sectors like construction and manufacturing are also showing resilience.
Listing Gains vs. Long-Term Holding
Some IPOs (like Goel Construction SME) deliver quick listing pops.
Larger IPOs (like PhysicsWallah, Urban Company) may be better for long-term growth.
9. Case Study: Urban Company IPO
Urban Company is a prime example of SEBI’s faster approval ecosystem.
Filed DRHP earlier in 2025.
Received SEBI approval within 12 weeks.
Raised ₹854 crore from anchors before IPO launch.
Price band set at the higher end, reflecting strong demand.
Market analysts project strong long-term growth given India’s rising demand for home services.
This showcases how SEBI’s new process benefits both issuers and investors.
10. Conclusion
SEBI’s decision to expedite IPO approvals is a game-changer for India’s financial markets. By cutting approval times, using AI-driven compliance, and standardizing processes, SEBI is creating a faster, more transparent, and investor-friendly IPO environment.
With major companies like PhysicsWallah, Urban Company, Neilsoft, and Prozeal entering the market, and regulatory support from SEBI, 2025 is poised to be a record-breaking year for IPO fundraising in India.
However, investors must balance enthusiasm with caution—choosing fundamentally strong IPOs, monitoring global market conditions, and avoiding blind bets driven by hype.
In essence, SEBI’s move reflects India’s ambition to emerge as a global capital-raising hub, connecting domestic growth stories with global capital at unprecedented speed and scale.
Part 4 Institutional TradingAdvantages of Option Trading
Leverage: Small premium controls large exposure.
Flexibility: Can profit in any market—up, down, or sideways.
Risk Management: Limited risk for buyers.
Income Generation: Option writing provides steady cash flow.
Risks of Option Trading
Despite advantages, options carry risks:
Time Decay: Options lose value as expiry approaches.
Volatility Risk: Changes in implied volatility can hurt positions.
Liquidity Risk: Some options may not have enough buyers/sellers.
Unlimited Risk for Writers: Option sellers face theoretically unlimited losses.
Options vs Futures
Many confuse options with futures. Key differences:
Futures: Obligation to buy/sell at expiry.
Options: Right, not obligation.
Futures: Unlimited risk both ways.
Options: Buyers’ risk limited to premium.

Part 4 Trading Master ClassParticipants in Option Markets
There are four key participants in option trading:
Buyers of Calls – Bullish traders.
Sellers of Calls (Writers) – Bearish or neutral traders, earning premium.
Buyers of Puts – Bearish traders.
Sellers of Puts (Writers) – Bullish or neutral traders, earning premium.
Each of these participants plays a role in keeping the options market liquid.
Option Pricing: The Greeks
Option pricing is not random—it is influenced by multiple factors, commonly represented by the Greeks:
Delta: Measures how much the option price changes when the underlying asset moves ₹1.
Gamma: Measures how much Delta itself changes when the underlying moves.
Theta: Measures time decay—how much the option loses value daily as expiration approaches.
Vega: Measures sensitivity to volatility changes.
Rho: Sensitivity to interest rate changes.
For traders, Theta and Vega are the most crucial, since time decay and volatility play massive roles in profits and losses.

Part 2 Trading Master ClassKey Terms in Option Trading
Before diving deeper, let’s understand the language of option traders.
Premium: The price paid to buy an option.
Strike Price: The price at which the option holder can buy (call) or sell (put) the asset.
Expiration Date: The last date on which the option can be exercised.
In-the-Money (ITM): When exercising the option would be profitable.
Out-of-the-Money (OTM): When exercising the option would not be profitable.
At-the-Money (ATM): When the underlying price equals the strike price.
Intrinsic Value: The amount of profit if the option were exercised immediately.
Time Value: The portion of the option premium that reflects the time left until expiration.
Example: If a stock is trading at ₹100 and you buy a call option with a strike price of ₹90 for ₹15 premium, the intrinsic value is ₹10 (100 – 90), and the remaining ₹5 is time value.
How Option Trading Works
Let’s look at a simple example:
Stock XYZ is trading at ₹200.
You buy a call option with a strike price of ₹210 for ₹5 premium.
The option expires in one month.
Scenario 1: Stock rises to ₹230
Intrinsic Value = ₹20 (230 – 210).
Profit = ₹20 – ₹5 (premium) = ₹15 per share.
Scenario 2: Stock stays at ₹200
Intrinsic Value = 0.
Loss = ₹5 (premium paid).
This shows the beauty of options: limited risk (premium paid) but unlimited upside in case of calls.

Part 1 Trading Master ClassIntroduction
In the world of financial markets, traders and investors have many instruments to express their views, manage risks, or speculate on price movements. One of the most fascinating and versatile instruments is the option contract. Options trading, when understood deeply, opens the door to countless strategies—ranging from conservative income generation to high-risk speculative plays with massive upside.
Unlike traditional stock trading, which is relatively straightforward (buy low, sell high), option trading introduces multiple layers of complexity: time decay, volatility, strike prices, premiums, and Greeks. Because of this, beginners often feel intimidated, while experienced traders consider options an art form—something that requires both science and psychology.
This guide will take you step by step into the world of option trading, covering what options are, how they work, key terminology, strategies, risks, advantages, and real-life use cases. By the end, you’ll have a full 360-degree view of this powerful trading instrument.
What Are Options?
An option is a type of financial derivative contract. Its value is derived from an underlying asset such as a stock, index, currency, or commodity.
An option gives the buyer the right, but not the obligation, to buy or sell the underlying asset at a predetermined price (called the strike price) before or on a specified date (called the expiration date).
There are two basic types of options:
Call Option – Gives the buyer the right to buy the underlying asset at the strike price.
Put Option – Gives the buyer the right to sell the underlying asset at the strike price.
So, if you think the price of a stock will rise, you might buy a call option. If you think it will fall, you might buy a put option.

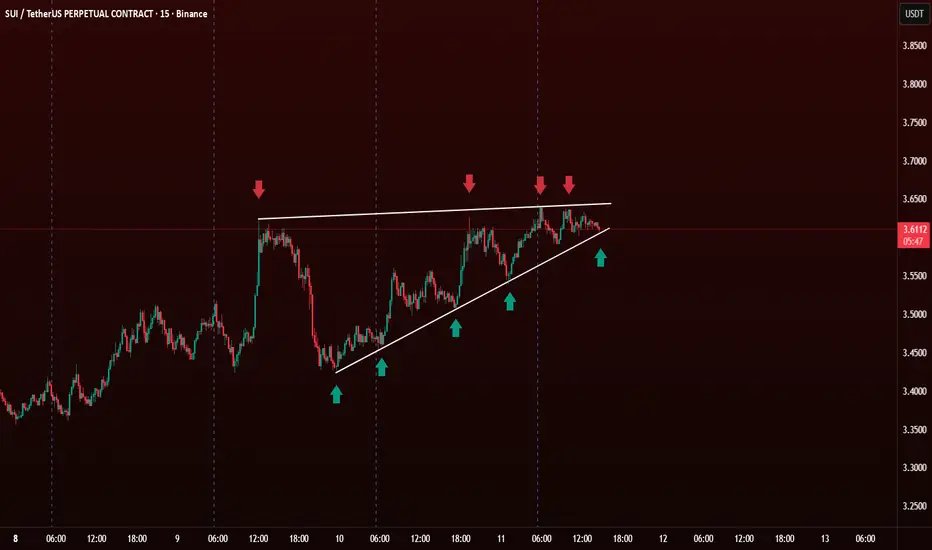
Ascending Triangle Pattern in Technical Analysis The Ascending Triangle is a bullish continuation pattern. It forms when the price creates higher lows (🔼) while facing consistent resistance at the same horizontal level (🔴).
🧐 How to Identify It
Flat Resistance Line 🔴
Price hits the same level multiple times and gets rejected.
This creates a horizontal line on top.
Rising Support Trendline 🔼
Each dip forms a higher low, indicating buying pressure.
Connect the swing lows with a rising trendline 📈.
📊 How to Trade It
Entry : Breakout Entry: Enter when price breaks and closes above the resistance line with high volume 💥.Conservative traders wait for a retest of the breakout zone (resistance becomes support).
Target : Measure the height of the triangle and project it upward from the breakout point.
Example: If triangle height = $0.30, add $0.30 above breakout.
Stop Loss : Below the last higher low 🔽 Or slightly below the triangle support trendline 📉
BINANCE:SUIUSDT.P
How to Close a Losing Trade?Cutting losses is an art, and a losing trader is an artist.
Closing a losing position is an important skill in risk management. When you are in a losing trade, you need to know when to get out and accept the loss. In theory, cutting losses and keeping your losses small is a simple concept, but in practice, it is an art. Here are ten things you need to consider when closing a losing position.
1. Don't trade without a stop-loss strategy. You must know where you will exit before you enter an order.
2. Stop-losses should be placed outside the normal range of price action at a level that could signal that your trading view is wrong.
3. Some traders set stop-losses as a percentage, such as if they are trying to make a profit of +12% on stock trades, they set a stop-loss when the stock falls -4% to create a TP/SL ratio of 3:1.
4. Other traders use time-based stop-losses, if the trade falls but never hits the stop-loss level or reaches the profit target in a set time frame, they will only exit the trade due to no trend and go look for better opportunities.
5. Many traders will exit a trade when they see the market has a spike, even if the price has not hit the stop-loss level.
6. In long-term trend trading, stop-losses must be wide enough to capture a real long-term trend without being stopped out early by noise signals. This is where long-term moving averages such as the 200-day and moving average crossover signals are used to have a wider stop-loss. It is important to have smaller position sizes on potentially more volatile trades and high risk price action.
7. You are trading to make money, not to lose money. Just holding and hoping your losing trades will come back to even so you can exit at breakeven is one of the worst plans.
8. The worst reason to sell a losing position is because of emotion or stress, a trader should always have a rational and quantitative reason to exit a losing trade. If the stop-loss is too tight, you may be shaken out and every trade will easily become a small loss. You have to give trades enough room to develop.
9. Always exit the position when the maximum allowable percentage of your trading capital is lost. Setting your maximum allowable loss percentage at 1% to 2% of your total trading capital based on your stop-loss and position size will reduce the risk of account blowouts and keep your drawdowns small.
10. The basic art of selling a losing trade is knowing the difference between normal volatility and a trend-changing price change.

Short-Term and Long-Term TradingPart 1: Understanding Short-Term Trading
What is Short-Term Trading?
Short-term trading involves buying and selling financial instruments within a short time frame to capture smaller price fluctuations. These trades can last from a few seconds to a few weeks but rarely longer.
Traders use technical analysis, price action, and market news rather than focusing deeply on a company’s fundamentals. The idea is to profit from volatility rather than waiting for long-term growth.
Timeframes of Short-Term Trading
Scalping – Trades last seconds to minutes; small profits but many trades daily.
Day Trading – Positions opened and closed within the same trading day; no overnight risk.
Swing Trading – Holding for days to weeks to capture short-term price swings.
Momentum Trading – Riding strong trends until momentum fades.
Characteristics of Short-Term Trading
High frequency of trades
Technical charts used more than company financials
Requires constant monitoring of markets
Profits are often smaller per trade but accumulate over time
High leverage and risk compared to long-term investing
Advantages of Short-Term Trading
Quick Profits – Traders don’t have to wait years to see results.
Opportunities in Any Market Condition – Can profit in bull or bear markets.
No Overnight Risk (Day Trading) – Avoids surprises from global events.
Leverage Benefits – Small capital can control larger positions.
Active Engagement – Ideal for people who enjoy the excitement of markets.
Disadvantages of Short-Term Trading
High Transaction Costs – Brokerage, taxes, and fees eat into profits.
Stress and Time-Intensive – Requires discipline and constant attention.
High Risk of Losses – One mistake can wipe out multiple small gains.
Emotionally Draining – Fear and greed can influence decisions.
Less Focus on Fundamentals – Ignoring fundamentals may cause big losses if markets turn unexpectedly.
Part 2: Understanding Long-Term Trading (Investing)
What is Long-Term Trading?
Long-term trading, often referred to as investing, is about buying and holding assets for months, years, or even decades. Investors rely on fundamental analysis—studying financial statements, industry trends, and company management—to pick strong assets that will grow over time.
The goal is not quick profit but wealth creation through compounding returns, dividends, and capital appreciation.
Timeframes of Long-Term Trading
Position Trading – Holding for weeks to months based on fundamentals and macro trends.
Buy and Hold Investing – Keeping assets for years regardless of short-term volatility.
Value Investing – Buying undervalued assets with long-term growth potential.
Growth Investing – Focusing on companies with strong future prospects.
Characteristics of Long-Term Trading
Low frequency of trades
Fundamental analysis is the primary tool
Requires patience and discipline
Dividends and compounding play a major role in returns
Can survive short-term market volatility
Advantages of Long-Term Trading
Wealth Building Through Compounding – Small returns grow significantly over years.
Less Stress – No need to monitor markets every second.
Lower Costs – Fewer trades mean fewer fees.
Tax Efficiency – In many countries, long-term capital gains are taxed lower than short-term.
Riding Big Trends – Capturing multi-year bull runs can be very profitable.
Disadvantages of Long-Term Trading
Slow Results – Wealth takes years to accumulate.
Requires Patience – Not suitable for people seeking instant results.
Market Crashes Hurt – Long-term holders can see portfolios drop significantly during downturns.
Opportunity Cost – Money locked in assets can’t be used for other opportunities.
Emotional Rollercoaster – Watching markets swing for years requires strong psychology.
Part 3. Strategies in Short-Term Trading
1. Scalping Strategy
Aim: Capture very small price movements.
Tools: 1-minute and 5-minute charts, high liquidity stocks, tight stop-loss.
2. Day Trading
Enter and exit within the same day.
Relies on intraday volatility, news-based moves.
3. Swing Trading
Hold for a few days to weeks.
Uses candlestick patterns, support-resistance, moving averages.
4. Breakout Trading
Buying when prices cross resistance or selling when they break support.
5. Momentum Trading
Enter trades in the direction of strong volume-backed trends.
Part 4: Strategies in Long-Term Trading
1. Value Investing
Buy undervalued companies and hold until true value is realized.
Famous example: Warren Buffett.
2. Growth Investing
Focus on companies with strong future revenue and earnings growth.
Examples: Tech giants like Apple, Tesla, Infosys.
3. Dividend Investing
Buy companies with stable dividend payouts for regular income.
4. Index Investing
Invest in entire indexes (like Nifty 50, S&P 500) for broad exposure.
5. Position Trading
Hold for months based on fundamentals and macroeconomic conditions.
Psychology of Short-Term vs Long-Term
Short-Term Trader’s Psychology
Must control fear and greed.
Needs quick decision-making.
Overtrading is a big risk.
Long-Term Investor’s Psychology
Requires patience during market downturns.
Must avoid panic selling.
Focus on compounding rather than daily fluctuations.
Risks in Both Approaches
Risks in Short-Term Trading
Over-leverage
Market manipulation & sudden moves
Emotional stress
High losses from small mistakes
Risks in Long-Term Trading
Company going bankrupt
Decades of underperformance in certain sectors
Inflation eroding returns
Long wait for profits
Which Approach is Better?
The answer depends on personality, capital, and goals:
If you want fast action, can handle stress, and enjoy charts, short-term trading might suit you.
If you want wealth creation, passive growth, and peace of mind, long-term investing is better.
Many successful market participants combine both—short-term trading for active income and long-term investing for wealth creation.
Conclusion
Both short-term and long-term trading are powerful methods to make money in financial markets, but they cater to different mindsets. Short-term trading is like sprinting—fast, exciting, but exhausting. Long-term trading is like marathon running—slow, steady, and rewarding in the end.
The best approach isn’t about choosing one over the other, but about understanding your risk tolerance, goals, and personality. Some people thrive in fast-paced day trading, while others prefer sitting tight with long-term compounding investments.
In the end, successful traders and investors know one golden truth: discipline and consistency matter more than time horizon.

Option Trading Strategies1. Understanding Options Basics
Before diving into strategies, it’s important to understand the fundamental building blocks of options.
1.1 What Are Options?
Options are financial contracts that give the buyer the right, but not the obligation, to buy or sell an underlying asset at a predetermined price (strike price) before or on a specific date (expiry).
Call Option: Right to buy the asset.
Put Option: Right to sell the asset.
1.2 Key Terms
Premium: Price paid to buy the option.
Strike Price: Agreed-upon price for exercising the option.
Expiration Date: The last day the option is valid.
In-the-Money (ITM): Option has intrinsic value.
Out-of-the-Money (OTM): Option has no intrinsic value.
At-the-Money (ATM): Strike price is equal to the current market price.
1.3 Why Trade Options?
Leverage: Control large positions with small capital.
Hedging: Protect a portfolio from adverse moves.
Income Generation: Earn through option writing.
Speculation: Bet on market direction or volatility.
2. Broad Categories of Option Strategies
Option strategies are generally grouped based on market outlook:
Bullish Strategies – Profit when prices rise.
Bearish Strategies – Profit when prices fall.
Neutral Strategies – Profit when prices move sideways.
Volatility-Based Strategies – Profit from expected changes in volatility.
3. Bullish Option Strategies
When traders expect the underlying asset to rise, they can use the following strategies:
3.1 Long Call
Setup: Buy a call option.
Outlook: Strongly bullish.
Risk: Limited to the premium paid.
Reward: Unlimited upside.
Example: Stock at ₹100, buy a call at ₹105 for ₹3. If stock rises to ₹120, profit = ₹12.
3.2 Bull Call Spread
Setup: Buy a call at a lower strike, sell another at a higher strike.
Outlook: Moderately bullish.
Risk: Limited to net premium paid.
Reward: Capped at the difference between strikes minus premium.
Example: Buy ₹100 call for ₹5, sell ₹110 call for ₹2 → Net cost ₹3. Max profit = ₹7.
3.3 Bull Put Spread
Setup: Sell a put at a higher strike, buy a put at a lower strike.
Outlook: Bullish to neutral.
Risk: Limited to strike difference minus net premium.
Reward: Premium received.
Example: Stock at ₹100, sell ₹100 put at ₹6, buy ₹90 put at ₹3 → Net credit ₹3.
4. Bearish Option Strategies
For traders expecting price declines:
4.1 Long Put
Setup: Buy a put option.
Outlook: Strongly bearish.
Risk: Limited to premium paid.
Reward: Large downside profit.
Example: Stock ₹100, buy ₹95 put at ₹4. If stock drops to ₹80, profit = ₹11.
4.2 Bear Put Spread
Setup: Buy a higher strike put, sell a lower strike put.
Outlook: Moderately bearish.
Risk: Limited to net premium.
Reward: Strike difference minus premium.
4.3 Bear Call Spread
Setup: Sell a call at lower strike, buy a call at higher strike.
Outlook: Bearish to neutral.
Risk: Limited to difference between strikes minus premium.
Reward: Net premium received.
5. Neutral Strategies
When traders expect little price movement:
5.1 Iron Condor
Setup: Combine bull put spread and bear call spread.
Outlook: Expect low volatility.
Risk: Limited.
Reward: Premium collected.
Example: Sell ₹95 put, buy ₹90 put, sell ₹105 call, buy ₹110 call. Profit if stock stays between ₹95–₹105.
5.2 Iron Butterfly
Setup: Sell ATM call and put, buy OTM call and put.
Outlook: Very low volatility.
Risk/Reward: Limited.
Example: Stock at ₹100, sell ₹100 call and put, buy ₹95 put and ₹105 call.
5.3 Short Straddle
Setup: Sell ATM call and put.
Outlook: Expect no major move.
Risk: Unlimited.
Reward: Premium received.
5.4 Short Strangle
Setup: Sell OTM call and put.
Outlook: Neutral to slightly volatile.
Risk: Unlimited.
Reward: Premium received.
Practical Tips for Traders
Always start with simple strategies like covered calls and protective puts.
Understand the Greeks before attempting advanced strategies.
Trade liquid options (high volume, narrow spreads).
Backtest strategies before live trading.
Avoid overleveraging.
Conclusion
Option trading strategies open up a universe of opportunities far beyond simple stock investing. Whether a trader expects bullish rallies, bearish drops, or calm sideways markets, there is a strategy tailored to that scenario. From basic calls and puts to complex spreads and iron condors, the key is understanding risk, reward, and probability.
Success in options trading is not about predicting the market perfectly, but about managing trades with discipline, applying the right strategy for the market condition, and mastering risk management. For beginners, starting with conservative strategies builds confidence. For advanced traders, options provide powerful ways to optimize portfolios and capitalize on volatility.
The Future of Trading in India1. Evolution of Trading in India – A Brief Context
Before we talk about the future, it’s important to understand how far India has come.
Pre-1990s: Physical shares, long settlement cycles (T+14), insider networks, and lack of transparency.
1990s reforms: Liberalization, NSE’s electronic trading, SEBI’s regulatory oversight, and screen-based trading.
2000s: Growth of F&O (Futures & Options), dematerialization of shares, introduction of commodities and currency derivatives.
2010s: Rise of algo trading, mobile trading apps, intraday retail participation, weekly expiries, and increasing global fund flows.
2020s: Post-COVID retail boom, discount brokers like Zerodha and Groww democratizing access, explosion in derivatives volumes, and surge in SIPs and mutual fund penetration.
This trajectory shows that India’s trading market has not only caught up with global peers but is now innovating at its own pace.
2. Key Drivers Shaping the Future of Trading in India
a) Digital Penetration and Fintech Boom
India has the world’s second-largest internet user base and one of the cheapest data costs globally. This means that even in small towns, traders can access real-time markets through smartphones. Apps like Zerodha, Upstox, Angel One, and Groww are onboarding millions of new users every year.
b) Demographics
Over 65% of India’s population is below 35 years. This young, tech-savvy generation is more comfortable with risk, online platforms, and experimenting with trading.
c) Regulatory Support
SEBI has been tightening rules to ensure transparency, margin requirements, and investor protection. This gives credibility to Indian markets and attracts foreign investors.
d) Globalization
India is being integrated into global indices (MSCI, FTSE, etc.), which means more foreign fund flows. Also, global geopolitical shifts are making India a preferred investment destination.
e) Technology
Artificial Intelligence, Machine Learning, Big Data analytics, Blockchain, and Algorithmic Trading are going to redefine how trades are executed, analyzed, and managed.
3. Future of Stock Market Trading in India
a) Retail Participation Will Continue to Explode
Currently, around 10–12% of Indians invest in stock markets, compared to over 50–60% in the US. This gap indicates massive potential for growth. With increasing financial literacy, better apps, and more disposable income, retail participation could double in the next decade.
b) Rise of Passive Investing and ETFs
While active trading will continue, more Indians will start investing through Exchange-Traded Funds (ETFs) and index funds as they seek stable, long-term returns. The growth of Nifty and Sensex ETFs is just the beginning.
c) Weekly and Daily Expiries
The popularity of weekly options will expand. Exchanges may even introduce daily expiries, mirroring global trends, which will increase intraday volatility and attract short-term traders.
d) Integration of Global Markets
Indian traders may soon get seamless access to trade US stocks, global commodities, and even international ETFs through domestic broker platforms.
4. Future of Derivatives Trading in India
a) Options Mania Will Expand Further
The future of derivatives trading will be dominated by options. With low capital requirements, retail investors are already driving record F&O volumes. NSE is among the largest derivatives markets in the world, and this trend will accelerate.
b) New Products
We can expect products like volatility indices (India VIX derivatives), sector-specific options, and more currency/commodity pairs.
c) AI-Driven Strategies
Algo trading will no longer be restricted to institutions. With cheaper cloud computing and APIs provided by brokers, retail traders will also use machine learning-based strategies.
d) Increased SEBI Scrutiny
To balance risk, SEBI may tighten margin rules further, introduce stricter disclosures, and limit speculative retail blow-ups.
5. Role of Technology in the Future of Trading
a) AI and Predictive Analytics
Traders will use AI to analyze massive amounts of market data, predict price trends, and execute strategies with precision.
b) Algorithmic Trading for All
Currently, algo trading is dominated by institutions. In the future, retail algos will become mainstream, with drag-and-drop strategy builders.
c) Blockchain and Tokenization
Trading of tokenized assets—fractional ownership of real estate, art, or even stocks—on blockchain networks will become possible in India once regulations evolve.
d) Real-Time Risk Management
Advanced systems will allow traders to manage portfolio risk dynamically, with real-time alerts and auto-hedging.
6. Future Regulations and Policies
T+1 and Beyond: India already has T+1 settlement. The next move could be instant settlements using blockchain.
Investor Protection: SEBI will likely mandate stronger disclosure norms, AI-based surveillance to catch manipulation, and education programs.
Crypto Regulation: Once a clear framework is set, crypto exchanges may integrate with traditional stock brokers, creating a unified trading ecosystem.
Capital Controls Relaxation: India may slowly allow easier foreign participation and cross-border trading.
7. Retail Traders vs. Institutional Players
Retail Boom: Short-term retail speculation in F&O will remain strong.
Institutional Dominance: Mutual funds, sovereign wealth funds, and foreign institutions will continue driving long-term capital inflows.
Future Balance: Retail will dominate derivatives, while institutions will dominate cash markets.
8. Commodities and Currency Trading
Gold and Silver: India, being a large consumer, will see more hedging and speculative participation in precious metals.
Energy: As India grows, trading in crude oil, natural gas, and electricity futures will expand.
Currency Trading: With India becoming a global manufacturing hub, currency hedging in INR/USD, INR/JPY, INR/CNY will grow. Eventually, the Indian Rupee could become a global trading currency.
Challenges Ahead
Over-Speculation: Retail traders blowing up accounts in options.
Regulatory Delays: Slow response to crypto, tokenization, and new products.
Tech Risks: Cybersecurity threats and system outages.
Global Shocks: Geopolitical events, Fed policies, or oil shocks impacting India’s markets.
Conclusion
The future of trading in India is a mix of opportunity and responsibility. The next two decades will witness:
Retail explosion, with millions of new traders joining.
Technological disruption, led by AI, algos, and blockchain.
New asset classes, from crypto to carbon credits.
Deeper global integration, making India a key player in world finance.
Yet, risks of speculation, lack of financial literacy, and regulatory bottlenecks remain. The winners of this new trading era will be those who combine discipline, knowledge, and adaptability with the right use of technology.
In short, India’s trading future is not just about more trades—it’s about more intelligent, inclusive, and globally connected trading.

Zero Day Trading1. Introduction to Zero Day Trading
In financial markets, speed and precision matter more than ever. Traders constantly seek opportunities where small movements in price can be turned into significant profits. One of the most fascinating evolutions in recent years is Zero Day Trading, often associated with Zero Days to Expiry (0DTE) options trading.
Zero Day Trading refers to ultra-short-term strategies where positions are opened and closed within the same trading day, often involving instruments that expire on the very day of trade. Unlike traditional swing trading or long-term investing, zero day trading is about capturing intraday price moves with maximum leverage and minimal holding time.
In U.S. markets, this has become particularly popular with S&P 500 index options (SPX, SPY, QQQ), which now expire daily. Similarly, Indian traders have embraced weekly and intraday expiry moves in indices like Nifty and Bank Nifty. The attraction is simple: high potential returns in a very short time. The risk, however, is equally high.
2. Evolution of Zero Day Trading
To understand zero day trading, we need to look at how derivatives evolved:
Early Options Market (1970s-1990s): Options were mostly monthly, giving traders weeks to manage positions.
Weekly Options (2010s): Exchanges introduced weekly expiry options, giving traders more flexibility and volume.
Daily Expiry Options (2022 onwards in the U.S.): SPX and other major indices introduced daily expiries, opening the door for 0DTE strategies.
India’s Adoption: NSE moved from monthly → weekly → multiple expiries, especially in Bank Nifty, where Thursday expiries became legendary for intraday option scalping.
This evolution reflects the shift toward high-frequency and event-driven trading, where institutions and retail traders alike exploit very short-term market movements.
3. What Exactly is 0DTE?
Zero Days to Expiry (0DTE) options are contracts that expire on the same trading day.
If today is Wednesday, and an index option has a Wednesday expiry, then by afternoon it becomes a 0DTE option.
Traders either buy or sell these contracts, knowing that by the end of the day, the option will be worthless unless in-the-money.
This creates a unique environment:
Theta (time decay) works at lightning speed.
Gamma (sensitivity to price changes) is extremely high.
A small move in the underlying index can multiply option values several times—or wipe them out entirely.
4. Key Characteristics of Zero Day Trading
Ultra-Short Time Frame: Positions may last minutes or hours, rarely overnight.
Leverage: Options allow control of large positions with relatively small capital.
High Gamma Exposure: Small price changes in the index can cause rapid gains/losses.
Event Sensitivity: Economic announcements, Fed speeches, inflation data, or earnings can trigger wild 0DTE moves.
Scalping Nature: Many traders use scalping strategies, booking small but quick profits multiple times.
5. Instruments Used in Zero Day Trading
Index Options (SPX, SPY, QQQ, Nifty, Bank Nifty): Most common due to liquidity and daily expiries.
Futures Contracts: Some use micro and mini futures for short bursts of trading.
High-Beta Stocks: Occasionally, traders use zero-day strategies in single-stock options (like Tesla, Apple).
Event-Driven ETFs: ETFs that respond to volatility (like VIX-related products).
6. Popular Strategies in Zero Day Trading
(a) Long Straddle / Strangle
Buying both a Call and a Put at the same strike (or nearby).
Profits if the index makes a big move in either direction.
Useful on days of economic announcements (CPI, FOMC).
(b) Short Straddle / Strangle
Selling both Call and Put, betting the index will stay range-bound.
Collects premium but has unlimited risk if the market moves sharply.
Popular among professional traders with hedges.
(c) Directional Scalping
Using price action or volume profile to take intraday calls or puts.
Very risky but rewarding with tight stop losses.
(d) Iron Condors and Butterflies
Defined-risk, range-bound strategies.
Traders sell multiple options around a narrow range expecting expiry near that zone.
(e) Gamma Scalping by Institutions
Institutions hedge short 0DTE positions dynamically.
This constant hedging often creates volatility patterns in the market.
7. Risk Management in Zero Day Trading
Risk is the biggest factor in zero day strategies:
Stop Loss: Essential due to explosive moves.
Position Sizing: Never over-leverage; small size prevents blow-ups.
Event Awareness: Avoid naked selling before major announcements.
Hedging: Advanced traders hedge short positions with futures or long options.
Capital Allocation: Professionals usually risk 1-2% per trade, retail traders often overexpose.
8. Psychology of Zero Day Traders
Zero day trading requires a unique mindset:
Discipline: Greed can wipe out accounts quickly.
Emotional Control: Handling quick gains and losses calmly.
Patience for Setup: Not every market day is good for 0DTE.
Rapid Decision Making: No time for overthinking.
Many compare 0DTE trading to professional poker, where probability, money management, and psychology dominate.
9. Advantages of Zero Day Trading
No Overnight Risk: Positions end same day.
High Potential Profits: Leverage can yield 5x–10x in hours.
Frequent Opportunities: Daily expiries mean setups every day.
Flexibility: Both range-bound and trending days can be traded.
Liquidity in Major Indices: Institutions ensure tight spreads.
10. Disadvantages of Zero Day Trading
High Risk of Total Loss: Options can go to zero within hours.
Slippage & Spreads: Rapid moves can cause bad fills.
Emotional Stress: Extremely fast-paced, mentally draining.
Overtrading Temptation: Daily opportunities encourage compulsive trading.
Institutional Edge: Market makers often have better risk models than retail.
Conclusion
Zero Day Trading is the cutting edge of modern financial speculation. It combines speed, leverage, and risk in a way no other strategy does. While institutions thrive using models and hedging, retail traders often get caught in the emotional whirlwind.
The key takeaway: 0DTE trading is not for everyone. It can provide extraordinary profits, but it requires discipline, knowledge, risk management, and emotional stability. For those who master it, it offers daily opportunities in global markets. For those who underestimate it, it can destroy capital just as fast.
Zero Day Trading represents the ultimate test of trading skill, discipline, and psychological strength—a true reflection of how modern markets are evolving.
Trade Market Reports1. What Are Trade Market Reports?
A trade market report is essentially a data-driven analysis document that captures and interprets trade-related activities in a specific domain. These reports can be categorized into:
International Trade Reports – Cover exports, imports, tariffs, trade balances, and bilateral/multilateral agreements.
Domestic Trade Reports – Focus on regional or sectoral trade activity within a country.
Financial Market Trade Reports – Analyze equity, commodities, currency, derivatives, and bond trading activities.
Sector-Specific Trade Reports – Cover industries such as energy, agriculture, metals, technology, healthcare, or logistics.
They typically include quantitative data (charts, tables, graphs) and qualitative analysis (interpretation, forecasts, risks, and opportunities).
2. Purpose and Importance
Trade market reports serve multiple purposes:
Decision Support: Businesses use them to decide entry/exit in markets.
Risk Management: Traders use them to hedge against volatility.
Policy Making: Governments rely on them for tariffs, subsidies, and trade agreements.
Forecasting: Investors assess future demand and price movements.
Transparency: Provides clarity in otherwise opaque markets.
For example, if a steel trade report shows falling global demand due to construction slowdown, steel companies may reduce production, and governments may adjust import duties.
3. Components of Trade Market Reports
A typical trade market report includes:
Executive Summary – Key findings and highlights.
Market Overview – Description of the market, key players, and historical context.
Trade Flow Analysis – Import-export data, trade balances, trade routes.
Price Trends – Historical price movements and future projections.
Demand-Supply Analysis – Drivers, restraints, and consumption patterns.
Regulatory Environment – Tariffs, trade policies, compliance frameworks.
Competitive Landscape – Profiles of top companies, market share.
Forecasts – Projections for growth, opportunities, risks.
Appendix/Data Sources – Methodology, definitions, references.
4. Types of Trade Market Reports
A. By Geography
Global Reports – e.g., WTO trade outlook, IMF reports.
Regional Reports – EU trade analysis, ASEAN trade updates.
Country Reports – India’s Foreign Trade Policy reports, US ITC reports.
B. By Sector
Commodity Trade Reports – Oil, gold, agricultural products.
Industry Trade Reports – Pharmaceuticals, IT services, automobiles.
Financial Market Reports – Stock exchanges, forex trading volumes.
C. By Frequency
Daily Reports – Stock exchange summaries, commodity updates.
Weekly/Monthly Reports – RBI forex reserves data, shipping freight updates.
Quarterly/Annual Reports – WTO annual trade report, World Bank updates.
5. Sources of Trade Market Reports
Government Agencies – Ministry of Commerce (India), US ITC, Eurostat.
International Organizations – WTO, IMF, UNCTAD, World Bank.
Private Research Firms – McKinsey, Deloitte, Fitch, S&P.
Exchanges – NSE, BSE, CME, LME (London Metal Exchange).
Customs/Logistics Data Providers – Import/export tracking firms.
News & Media – Bloomberg, Reuters, Financial Times.
6. Methodologies Used in Trade Market Reports
Trade market reports rely on a mix of:
Quantitative Methods – Statistical models, regression analysis, econometrics.
Qualitative Methods – Expert interviews, surveys, case studies.
Forecasting Models – Time series, AI/ML-based demand prediction.
Benchmarking – Comparing performance with peers or competitors.
Scenario Analysis – What-if scenarios based on global events (e.g., war, sanctions).
For example, an oil market report may use econometric modeling to predict crude oil demand under three scenarios: normal growth, global recession, or geopolitical crisis.
7. Importance of Trade Market Reports in Financial Trading
Stock Markets – Help in sector rotation strategies.
Forex Trading – Currency reports help predict exchange rate trends.
Commodity Trading – Provide demand-supply balance insights.
Bond Markets – Show macroeconomic stability and trade deficit impacts.
Example: If India’s trade deficit widens sharply, the rupee may depreciate, influencing forex traders and equity investors.
8. Trade Market Reports in India
In India, trade market reports are vital due to its fast-growing economy and heavy dependence on both exports (IT, pharma, textiles) and imports (oil, electronics, gold). Key sources include:
Directorate General of Foreign Trade (DGFT) – Policy-related reports.
Reserve Bank of India (RBI) – Forex, reserves, balance of payments.
Ministry of Commerce & Industry – Monthly export-import data.
EXIM Bank – Research papers on trade financing.
Private Firms – CRISIL, ICRA, CARE Ratings.
9. Global Trade Market Reports – Examples
WTO World Trade Report – Annual global trade trends.
IMF World Economic Outlook – Macroeconomic and trade projections.
UNCTAD Trade & Development Report – Trade and investment focus.
OPEC Oil Market Report – Petroleum production and pricing.
Baltic Dry Index Reports – Global shipping and freight costs.
10. Challenges in Trade Market Reporting
Data Reliability – Developing nations often lack accurate trade data.
Timeliness – Delayed reports reduce decision-making value.
Bias & Interpretation – Private firms may publish biased reports.
Global Uncertainty – Sudden geopolitical shifts (sanctions, wars) make forecasts less reliable.
Overload of Information – Too many reports can confuse stakeholders.
Conclusion
Trade market reports are essential knowledge tools in the modern economy. They help different stakeholders—from policymakers to traders—make informed decisions. In an era of global uncertainty, with shifting supply chains, geopolitical tensions, and financial market volatility, trade market reports provide the clarity, foresight, and actionable insights needed to stay competitive.
Whether it is a daily commodity report for a trader, a sectoral report for a company, or a global trade outlook for policymakers, these reports bridge the gap between raw data and actionable intelligence.
In the future, as AI-driven real-time reporting becomes mainstream, trade market reports will become even more predictive, personalized, and crucial in shaping global commerce.
