Technical Analysis (TA) and Fundamental Analysis (FA) in Trading1. Introduction to Market Analysis
Financial markets, whether stocks, forex, commodities, or cryptocurrencies, are highly dynamic. Prices fluctuate due to supply and demand, investor sentiment, macroeconomic factors, corporate performance, and global events. To navigate this volatility, traders and investors use analysis methods to predict future price movements and identify profitable opportunities.
The two main methods are:
Fundamental Analysis (FA): Focuses on the intrinsic value of an asset by evaluating economic, financial, and qualitative factors.
Technical Analysis (TA): Focuses on historical price and volume data to predict future price movements using charts and technical indicators.
While both have their strengths and weaknesses, many successful traders use a combination of both to make informed decisions.
2. Fundamental Analysis (FA)
2.1 Definition
Fundamental Analysis is the study of a company’s financial health, economic conditions, and other external factors to determine the intrinsic value of a stock or asset. The goal is to identify whether an asset is overvalued, undervalued, or fairly priced in the market.
2.2 Key Principles
Intrinsic Value: The true worth of a company or asset based on fundamentals, not just the market price.
Long-Term Perspective: FA is generally used by investors looking for long-term investments rather than short-term trading.
Economic Influence: Macroeconomic factors, industry trends, and geopolitical events influence the value of assets.
2.3 Components of Fundamental Analysis
Fundamental Analysis involves two main components:
2.3.1 Quantitative Analysis
This involves analyzing measurable data from financial statements and economic reports. Key metrics include:
Revenue and Earnings: Revenue indicates the total income generated, while earnings reflect the net profit.
Earnings Per Share (EPS): Shows profitability on a per-share basis.
Price-to-Earnings (P/E) Ratio: Compares the stock price to its earnings. A high P/E may indicate overvaluation.
Debt-to-Equity Ratio (D/E): Measures financial leverage and risk.
Return on Equity (ROE): Indicates how effectively a company uses shareholders’ equity to generate profit.
Cash Flow Analysis: Evaluates liquidity and the ability to meet obligations.
2.3.2 Qualitative Analysis
This involves assessing non-numerical factors that affect a company’s long-term performance, including:
Business Model: Understanding how a company makes money and its competitive advantage.
Management Quality: Leadership effectiveness impacts growth and profitability.
Industry Trends: Assessing the growth potential and competitive landscape.
Brand Strength and Market Position: Strong brands often command pricing power.
Regulatory Environment: Government policies can affect operations and profitability.
2.4 Steps in Fundamental Analysis
Macro Analysis: Examine global and national economic conditions.
Industry Analysis: Evaluate the sector or industry trends and competitors.
Company Analysis: Analyze financial statements, management, and business strategies.
Valuation: Use models like Discounted Cash Flow (DCF), Price-to-Earnings (P/E), or Price-to-Book (P/B) to estimate intrinsic value.
Decision Making: Compare intrinsic value to current market price to determine buy, hold, or sell.
2.5 Advantages of Fundamental Analysis
Provides a long-term perspective.
Helps investors make informed decisions based on real company performance.
Can identify undervalued opportunities for significant gains.
2.6 Limitations of Fundamental Analysis
Time-consuming and requires detailed research.
Market prices can remain irrational for extended periods.
Not suitable for short-term trading due to market volatility.
3. Technical Analysis (TA)
3.1 Definition
Technical Analysis is the study of past market data—primarily price and volume—to forecast future price movements. Unlike FA, it does not focus on a company’s intrinsic value but on market behavior and trends.
3.2 Key Principles
Technical Analysis is based on three core assumptions:
Price Discounts Everything: All available information (fundamentals, sentiment, news) is already reflected in the market price.
Prices Move in Trends: Markets follow trends (uptrend, downtrend, or sideways), and these trends can be identified and traded.
History Tends to Repeat Itself: Price patterns and market psychology often repeat due to human behavior.
3.3 Tools of Technical Analysis
Technical Analysis relies on charts, indicators, and patterns:
3.3.1 Price Charts
Line Chart: Connects closing prices over time.
Bar Chart: Shows open, high, low, and close prices (OHLC).
Candlestick Chart: Visual representation of OHLC with patterns indicating market sentiment.
3.3.2 Technical Indicators
Indicators are mathematical calculations based on price and volume to identify trends, momentum, and reversals.
Common Indicators:
Moving Averages (MA): Smooth out price data to identify trends.
Relative Strength Index (RSI): Measures overbought or oversold conditions.
Moving Average Convergence Divergence (MACD): Detects momentum and trend changes.
Bollinger Bands: Identify volatility and potential reversal points.
Volume Indicators (OBV, VWAP): Confirm price movements with volume activity.
3.3.3 Chart Patterns
Patterns indicate potential market movements:
Trend Continuation Patterns: Flags, pennants, and triangles suggest ongoing trends.
Reversal Patterns: Head and shoulders, double tops/bottoms signal trend changes.
Candlestick Patterns: Doji, hammer, engulfing, shooting star indicate short-term reversals.
3.3.4 Support and Resistance
Support: Price level where demand is strong enough to prevent further decline.
Resistance: Price level where selling pressure prevents price from rising.
Identifying these levels helps traders set entry, exit, and stop-loss points.
3.4 Steps in Technical Analysis
Select the Asset and Timeframe: Choose the market and timeframe (intraday, daily, weekly, monthly).
Analyze Trend: Determine if the market is in an uptrend, downtrend, or sideways.
Identify Key Levels: Locate support, resistance, and breakout zones.
Apply Indicators: Use momentum, volume, and trend indicators to confirm signals.
Plan Entry and Exit: Decide when to enter or exit trades based on risk management.
3.5 Advantages of Technical Analysis
Works in any market with historical data.
Suitable for short-term and intraday trading.
Helps identify precise entry and exit points.
Can be automated using algorithmic trading.
3.6 Limitations of Technical Analysis
Ignores underlying fundamentals.
Requires discipline and practice to interpret correctly.
May produce false signals in volatile markets.
4. Integrating FA and TA
Many successful market participants combine both methods to maximize profits:
FA to Choose the Asset: Identify fundamentally strong stocks for long-term investment.
TA to Time the Market: Use technical signals to decide when to buy or sell.
For example:
A stock may be fundamentally undervalued (FA).
TA can identify the right entry point when the price hits a key support level.
Similarly, FA can help avoid fundamentally weak stocks that may temporarily rise due to technical momentum.
5. Practical Tips for Traders and Investors
Know Your Style: Long-term investors benefit more from FA, while short-term traders rely on TA.
Risk Management: Always set stop-loss levels and manage trade size.
Stay Updated: Monitor economic news, earnings reports, and global events.
Combine Analysis: Using FA and TA together can reduce risk and improve accuracy.
Continuous Learning: Markets evolve, so stay updated on new tools and strategies.
6. Conclusion
Both Fundamental Analysis (FA) and Technical Analysis (TA) are essential tools for navigating financial markets. FA provides the foundation for understanding the true value of assets, while TA offers insights into price trends, momentum, and market psychology. While FA is best suited for long-term investments, TA is invaluable for timing trades and short-term opportunities. By understanding and integrating both approaches, traders and investors can make informed decisions, minimize risk, and increase their chances of consistent success in the dynamic world of financial markets.
Community ideas
How Smart Liquidity Shapes Price Movements1. Understanding Liquidity in Trading
Liquidity refers to how easily an asset can be bought or sold without causing a significant change in its price. In a highly liquid market, a trader can enter or exit a position quickly at the desired price. In illiquid markets, even small orders can create sharp price movements.
High liquidity: Stocks like Apple, Amazon, or Nifty 50 stocks.
Low liquidity: Small-cap stocks or exotic cryptocurrencies.
Liquidity affects price stability, volatility, and order execution. Traders often think price moves purely based on supply and demand, but liquidity tells the deeper story: prices move where liquidity exists.
2. Who Controls Smart Liquidity?
Smart liquidity is usually controlled by:
Institutional investors: Banks, hedge funds, mutual funds.
Market makers: Entities that provide liquidity by continuously quoting buy and sell prices.
High-frequency trading (HFT) firms: Using algorithms to detect and exploit liquidity.
Large retail players with significant capital.
These participants often have more information, better technology, and strategic motives, enabling them to move markets subtly without causing abrupt price swings.
Key point: Smart liquidity is not random; it is strategically placed where it can create maximum impact on price.
3. Types of Liquidity
Understanding liquidity types is essential for spotting smart money activity:
a) Visible Liquidity
Orders you can see in the order book. For example:
Limit orders displayed at certain price levels.
Market depth showing buy/sell interest.
b) Hidden Liquidity
Orders that are not visible to the general market. This can include:
Iceberg orders: Large orders split into smaller visible chunks.
Hidden institutional positions built slowly to avoid moving price drastically.
c) Imbalance Liquidity
Occurs when buy orders far exceed sell orders (or vice versa). Smart money exploits these imbalances by pushing prices to areas where retail stops are placed.
4. How Smart Liquidity Moves Prices
Smart liquidity shapes price movements through accumulation, manipulation, and distribution:
a) Accumulation
Smart money accumulates positions at low prices without triggering panic or retail selling.
This is often seen in a consolidation phase or a “range” where prices appear to be moving sideways.
Retail traders often miss this because there is no clear breakout yet.
Example:
A stock trades between ₹100–₹105. Smart money gradually buys large quantities at ₹100–₹102. Price doesn’t rise immediately because selling pressure absorbs the buying, but once accumulation is sufficient, a breakout occurs.
b) Manipulation
Smart money intentionally creates liquidity traps to force retail traders into making mistakes.
This includes stop-hunting, where price briefly dips below support levels to trigger stop-loss orders, providing liquidity for smart money to buy.
Example:
Price of a currency pair is at 1.3450, and many retail traders have stop-loss at 1.3440. Smart money pushes price to 1.3438, triggering retail stops, and then price rises as smart money has acquired positions at lower levels.
c) Distribution
Once positions are large enough, smart money starts selling into strength.
Retail traders often buy late, thinking the uptrend is endless, providing liquidity for smart money to exit.
Example:
After a strong uptrend, institutional traders start selling gradually around ₹120–₹125 while retail traders keep buying. Eventually, the stock reverses, leaving late buyers trapped.
5. Recognizing Smart Liquidity Zones
Smart money typically operates around key price levels. Recognizing these zones helps traders anticipate future movements.
a) Support and Resistance Levels
These are areas where price historically reacts.
Smart liquidity is often hidden just beyond these levels (e.g., a stop-loss cluster).
b) Liquidity Pools
Liquidity pools are areas with a concentration of pending orders.
Smart money often targets these pools to acquire or offload large positions without creating abrupt volatility.
c) Order Book Analysis
Watching the depth of market (DOM) and level 2 order book can reveal where liquidity resides.
Sudden appearance or disappearance of large orders often signals smart money activity.
6. Smart Liquidity in Trend Formation
Price trends are not purely driven by news or fundamentals. They are largely engineered by liquidity flows:
Uptrend: Smart money absorbs selling pressure at lower levels and pushes price upward when liquidity dries out.
Downtrend: Smart money sells gradually into rallies while retail buys impulsively.
Sideways trends: Smart money accumulates or distributes positions while retail chases minor price movements.
7. Tools and Techniques to Detect Smart Liquidity
a) Volume Analysis
Unusual spikes in volume often indicate smart money activity.
Clues: High volume at support/resistance without significant price movement suggests accumulation or distribution.
b) Candlestick Patterns
Long wicks often show liquidity sweeps (stop-hunting) by smart money.
Patterns like pin bars and inside bars around key levels are often liquidity-driven.
c) Market Structure
Smart liquidity targets weak points in market structure: swing highs/lows, breakouts, and fake breakouts.
Recognizing these allows traders to anticipate reversals or continuations.
d) Footprint and Order Flow Charts
Advanced tools that track real-time buy/sell imbalances.
Helps traders see where institutional orders are entering/exiting.
8. Liquidity and Stop-Hunting
Stop-hunting is one of the most famous tactics of smart liquidity:
Retail traders place stops near obvious levels.
Smart money triggers these stops to create temporary volatility.
Once stops are triggered, price moves in the intended direction as smart money executes trades.
Example:
Stock support at ₹50.
Retail stops at ₹49.80.
Price dips to ₹49.78, triggers stops → liquidity provided → smart money buys → price rises.
Conclusion
Smart liquidity is the invisible hand that shapes price movements in every market. While retail traders often focus on visible price action, smart liquidity analysis allows you to understand why price moves, not just where. By identifying accumulation, distribution, stop-hunting, and liquidity zones, traders can align their strategies with the forces driving the market.
The most successful traders don’t fight smart money—they follow liquidity, entering when smart money enters and exiting when it exits. Understanding smart liquidity isn’t just a technical skill; it’s a market intuition built through observation, patience, and practice.
Price is a reflection of liquidity, and liquidity is the language of smart money. Master this language, and you can navigate markets with greater confidence, precision, and profitability.

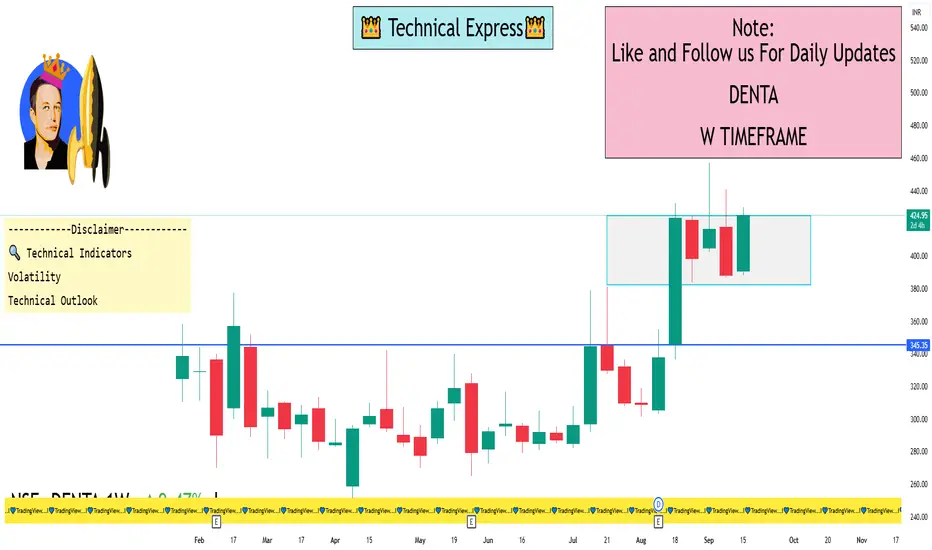
DENTA 1 Week View📈 1-Week Performance Snapshot
Current Price: ₹426.65
Week’s High/Low: ₹429.70 / ₹409.65
Weekly Change: Approximately −6.12%
📊 1-Month and 3-Month Trends
1-Month Change: +24.43%
3-Month Change: +41.61%
📉 1-Year Overview
52-Week High: ₹457.00
52-Week Low: ₹251.25
Current Price: ₹426.65
1-Year Return: Approximately +70%
🔍 Technical Indicators
Volatility: Weekly volatility stands at 8%, higher than 75% of Indian stocks, indicating relatively higher price fluctuations
Technical Outlook: Based on moving averages and other indicators, the daily buy/sell signal is currently a Strong Buy
💡 Summary
Despite a slight dip over the past week, Denta Water and Infra Solutions Ltd continues to exhibit strong growth, with significant gains over the past month and year. The stock's higher volatility suggests active trading interest, and the positive technical indicators may appeal to investors looking for momentum opportunities.
Currency Derivatives & INR VolatilityPart 1: Understanding Currency Derivatives
1.1 What are Currency Derivatives?
Currency derivatives are financial contracts whose value is derived from the exchange rate of one currency against another. They allow market participants to lock in, hedge, or speculate on future currency movements.
For example:
An Indian importer of crude oil may use a USD/INR futures contract to protect themselves from the risk of a weakening rupee.
A trader may buy options on USD/INR expecting volatility around an RBI policy announcement.
1.2 Types of Currency Derivatives
1.2.1 Currency Forwards
A forward contract is a customized agreement between two parties to exchange a certain amount of currency at a future date at a fixed exchange rate. In India, forwards are widely used by corporates with genuine foreign exchange exposure.
1.2.2 Currency Futures
Futures are standardized contracts traded on exchanges like NSE or BSE. For example, USD/INR futures allow participants to buy or sell US Dollars at a future date at a predetermined price. Futures provide transparency, liquidity, and are regulated by SEBI.
1.2.3 Currency Options
Options give the buyer the right (but not the obligation) to buy or sell currency at a predetermined rate before a specific date. They are powerful tools for hedging uncertain outcomes. For instance, an exporter expecting USD payments may buy a put option to safeguard against INR appreciation.
1.2.4 Currency Swaps
Swaps involve exchanging principal and interest payments in different currencies. They are often used by companies or governments borrowing abroad to manage currency and interest rate risks.
Part 2: The Dynamics of INR Volatility
2.1 What is INR Volatility?
INR volatility refers to fluctuations in the value of the Indian Rupee against other currencies. It can be measured using indicators like standard deviation of returns, implied volatility from options, or volatility indices.
For example:
If USD/INR moves from 83.20 to 84.10 within a week, that 90-paisa move reflects volatility.
2.2 Causes of INR Volatility
2.2.1 Trade Deficit & Balance of Payments
India imports more than it exports, especially crude oil. A rising trade deficit often puts downward pressure on INR.
2.2.2 Capital Flows (FII/FPI Investments)
Large inflows of foreign capital strengthen INR, while sudden outflows (like during global risk-off events) weaken it.
2.2.3 Interest Rate Differentials
If US interest rates rise while Indian rates remain steady, investors may prefer USD assets, leading to INR depreciation.
2.2.4 Global Commodity Prices
A surge in oil prices increases India’s import bill, weakening INR. Conversely, stable or falling prices support INR.
2.2.5 Geopolitical Tensions & Global Uncertainty
Events like wars, sanctions, or global financial crises drive investors to safe-haven assets like the USD, increasing INR volatility.
2.2.6 Domestic Policies & RBI Intervention
The Reserve Bank of India (RBI) frequently intervenes in the forex market to prevent sharp swings. However, such interventions cannot fully eliminate volatility.
2.3 Measuring INR Volatility
Historical Volatility (HV): Based on past exchange rate movements.
Implied Volatility (IV): Derived from option prices, showing expected future volatility.
Rupee Volatility Index (INR VIX): Similar to equity VIX, a market measure of expected volatility in INR.
Part 3: The Role of Currency Derivatives in Managing INR Volatility
3.1 Hedging Through Derivatives
Currency derivatives help corporates, banks, and individuals manage the risks of adverse INR movements.
Importers: Hedge against INR depreciation (higher cost of imports).
Exporters: Hedge against INR appreciation (reduced export earnings).
Investors: Hedge foreign equity/debt portfolio risks.
3.2 Speculation & Arbitrage
Apart from hedging, derivatives also attract traders who speculate on short-term INR movements. Arbitrageurs exploit price differences between spot, futures, and options markets.
3.3 Corporate Case Example
Suppose an Indian IT company expects $100 million in revenue in 3 months. If INR strengthens from 83 to 81, revenue in INR terms falls by ₹200 crore. By using a USD/INR forward contract, the company can lock in the rate and secure predictable cash flows.
3.4 Risk Management in Banks
Banks are major participants in currency derivative markets. They manage client exposure while also using derivatives to balance their own positions. RBI regulations ensure banks don’t take excessive speculative risk.
Part 4: Regulatory Framework in India
4.1 Role of RBI & SEBI
RBI: Regulates over-the-counter (OTC) forex derivatives.
SEBI: Regulates exchange-traded derivatives (ETDs).
4.2 Exchange-Traded Currency Derivatives in India
Launched in 2008, currency futures and options on exchanges like NSE, BSE, and MCX-SX have grown rapidly. Contracts are available in USD/INR, EUR/INR, GBP/INR, JPY/INR, and cross-currency pairs.
4.3 RBI’s Intervention Policy
RBI often uses its reserves to prevent extreme INR volatility, but avoids pegging INR to a fixed rate. This “managed float” system balances stability and flexibility.
Part 5: Impact of INR Volatility
5.1 On Businesses
Importers: Weaker INR increases costs of raw materials.
Exporters: Stronger INR reduces competitiveness abroad.
SMEs: Smaller firms often lack hedging mechanisms, making them more vulnerable.
5.2 On Investors
Equity Investors: INR depreciation hurts foreign investors’ returns, leading to outflows.
Debt Investors: Currency risk affects bond investments, especially government securities.
5.3 On the Economy
Inflation: Weaker INR makes imports expensive, adding to inflation.
Growth: Currency instability affects trade, investment, and financial confidence.
Forex Reserves: RBI may need to use reserves to stabilize INR, impacting balance sheet strength.
Part 6: Opportunities & Challenges
6.1 Opportunities
Deepening of Currency Markets: Growing participation increases liquidity and efficiency.
New Instruments: Cross-currency derivatives (e.g., EUR/USD in India) expand opportunities.
Retail Participation: Rising awareness allows individuals to hedge or invest.
6.2 Challenges
Speculative Excesses: Over-leverage by traders can cause instability.
Regulatory Restrictions: Limited participation compared to global FX markets.
Information Asymmetry: SMEs and retail participants lack knowledge on hedging tools.
Conclusion
Currency derivatives and INR volatility are two sides of the same coin in India’s financial landscape. The rupee, being influenced by domestic and international factors, will always experience fluctuations. These fluctuations, if unmanaged, can disrupt businesses, trade, and investment.
Currency derivatives provide a structured way to manage risks, offering corporates, banks, and investors tools to hedge exposure while also opening avenues for speculation and arbitrage. However, their effectiveness depends on proper usage, regulatory oversight, and awareness among participants.
In the long run, as India’s economy expands, INR’s role in global finance will increase. With it, the need for efficient currency derivative markets will only grow. Proper risk management, coupled with regulatory prudence, can turn volatility from a threat into an opportunity, ensuring stability and growth in India’s financial ecosystem.
Part 8 Trading master ClassWhy Trade Options?
Options are popular because of their flexibility. They can serve multiple purposes:
Hedging (Insurance)
Just like insurance, options protect against downside risk.
Example: Buying a put option to protect your stock holdings.
Speculation (Profit from Price Movements)
Traders use options to bet on direction, volatility, or even stability of prices.
Income Generation
Selling covered calls or cash-secured puts generates steady premium income.
Leverage
Options allow large exposure with smaller capital compared to stocks.
How Options Work: Pricing
Option pricing is complex, but two main values exist:
Intrinsic Value → Difference between stock price and strike (if favorable).
Time Value → Extra value based on time left till expiry and expected volatility.
Example:
Stock = ₹1,000
Call strike = ₹950, Premium = ₹70
Intrinsic = ₹1,000 – ₹950 = ₹50
Time Value = ₹20
Options Market Structure
The options market involves:
Buyers of Options – Limited risk (premium), unlimited potential reward.
Sellers (Writers) of Options – Limited reward (premium), potentially high risk.
Exchanges (like NSE in India, CBOE in US) – Standardized contracts.
Clearing Corporations – Ensure smooth settlement, reduce counterparty risk.

Part 7 Trading master ClassIntroduction to Options Trading
Financial markets offer countless opportunities for investors and traders to grow wealth. Among them, options trading stands out as one of the most versatile, powerful, and misunderstood tools. Options can help protect a portfolio from risk, generate extra income, or allow a trader to speculate on price movements with limited upfront capital.
At its core, options trading is about making calculated decisions on probabilities — the probability of a stock rising, falling, or staying stable. While stocks represent ownership in a company, options are contracts that give special rights tied to those stocks (or other assets).
Before diving deep, remember this: options are not inherently risky. Misuse of options is risky. With the right understanding, options can be a trader’s best friend.
Basics of Options
What is an Option?
An option is a financial contract that gives the buyer the right (but not the obligation) to buy or sell an underlying asset (like a stock, index, or commodity) at a predetermined price (strike price) before or on a certain date (expiry date).
Two main types exist:
Call Option → Right to buy the underlying at strike price.
Put Option → Right to sell the underlying at strike price.
The buyer pays a fee, known as the premium, to acquire this right.
Example:
Stock: Reliance Industries trading at ₹2,500
You buy a Call Option with strike ₹2,600, expiring in 1 month, premium ₹50.
If Reliance rises to ₹2,700 before expiry:
You can buy at ₹2,600, sell at ₹2,700, and profit (₹100 – ₹50 = ₹50 per share).
If Reliance stays below ₹2,600:
The option expires worthless, and you lose only the premium (₹50).
Key Terms
Strike Price → Fixed price at which option can be exercised.
Expiry Date → Last date to exercise the option.
Premium → Cost of buying the option.
Lot Size → Minimum quantity per option contract.
In the Money (ITM) → Option has intrinsic value.
Out of the Money (OTM) → Option has no intrinsic value.
At the Money (ATM) → Strike price is close to current market price.

Part 2 Ride The Big MovesIntroduction to Options
Option trading is a sophisticated financial strategy that allows investors to hedge, speculate, or generate income in financial markets. Unlike buying a stock or a commodity directly, trading options gives you the right, but not the obligation, to buy or sell an underlying asset at a predetermined price within a specific time period.
The concept of options is not new. Options have been used for centuries to hedge risks and manage investments. In modern financial markets, options are widely used by retail investors, institutional investors, and professional traders because they provide flexibility, leverage, and strategic opportunities that are not available in traditional stock trading.
An option derives its value from the underlying asset, which can be a stock, commodity, index, currency, or ETF. Because options have time-limited value, they are classified as derivatives, meaning their price depends on the price movement of the underlying asset.
Key Terminology
Understanding option trading requires familiarity with basic terms:
Underlying Asset: The security or instrument on which the option is based. For example, Apple stock for an Apple options contract.
Strike Price: The predetermined price at which the option can be exercised.
Expiration Date: The date when the option contract expires. After this date, the option is worthless if not exercised.
Premium: The price paid to buy the option. Think of it as the cost of the “insurance” provided by the option.
In-the-Money (ITM): A call option is ITM when the stock price is above the strike price; a put option is ITM when the stock price is below the strike price.
Out-of-the-Money (OTM): Opposite of ITM. Call options are OTM when the stock price is below the strike price, and put options are OTM when the stock price is above the strike price.
At-the-Money (ATM): When the stock price equals the strike price.

Algorithmic Trading: Speed, Strategy, and Smarter Decisions1. What is Algorithmic Trading?
Algorithmic trading is the process of using computer programs to execute trades automatically, based on a defined set of rules regarding timing, price, quantity, and other market conditions.
For example:
A trader may write an algorithm that automatically buys 500 shares of a stock if its 50-day moving average crosses above the 200-day moving average (a common technical signal).
Another algorithm might sell if prices drop 2% within a few seconds, limiting losses.
At its core, algorithmic trading eliminates emotional decision-making and replaces it with data-driven, rule-based execution.
2. Evolution of Algorithmic Trading
Early 1970s – Birth of electronic trading with NASDAQ and the introduction of order-routing systems.
1980s – Program trading emerged, where large institutions executed block trades using computers.
1990s – Internet and electronic communication networks (ECNs) allowed direct market access (DMA).
2000s – Rise of high-frequency trading (HFT), leveraging millisecond and microsecond execution.
2010s onwards – Machine learning, AI-driven predictive analytics, and global adoption of algo trading.
Today, in major markets like the US, nearly 70–80% of equity trades are executed by algorithms, making them the backbone of financial ecosystems.
3. Speed: The Core of Algorithmic Trading
Speed is not just a feature of algo trading—it is its soul.
3.1 Why Speed Matters
Financial markets move in fractions of a second. Opportunities to exploit inefficiencies or arbitrage may disappear in microseconds. Humans simply cannot react fast enough.
For instance:
In high-frequency trading (HFT), firms compete to execute trades faster than rivals.
A one-millisecond advantage in order execution can mean millions of dollars in profit.
3.2 Infrastructure for Speed
Colocation Services: Traders rent space inside exchange data centers so their servers sit physically close to the market, reducing latency.
Fiber-optic & Microwave Networks: Firms invest heavily in faster communication channels to shave microseconds off transmission times.
Low-Latency Software: Specialized coding in C++ or FPGA chips ensures minimal delay in algorithm execution.
3.3 Benefits of Speed
Rapid reaction to news or price movements.
Ability to capture tiny spreads across multiple markets.
Efficient order execution with minimal slippage.
3.4 Risks of Speed
However, speed can backfire. Events like the 2010 Flash Crash, where the Dow Jones plunged nearly 1000 points within minutes due to automated sell orders, show how excessive speed can destabilize markets.
4. Strategy: The Brain of Algorithmic Trading
While speed provides the muscle, strategy provides the brain. A trading algorithm is only as effective as the strategy it executes.
4.1 Types of Algorithmic Trading Strategies
Trend-Following Strategies
Use moving averages, momentum indicators, and breakouts.
Example: Buy when the 50-day moving average crosses above the 200-day moving average.
Arbitrage Strategies
Exploit price differences of the same asset across markets.
Example: Buying a stock on NYSE and simultaneously selling it on NASDAQ at a higher price.
Market-Making Strategies
Place simultaneous buy and sell orders to capture the bid-ask spread.
Commonly used by broker-dealers and liquidity providers.
Statistical Arbitrage (StatArb)
Relies on mathematical models to identify mispricings among correlated securities.
Example: Pair trading, where one buys one stock and shorts another correlated stock.
Event-Driven Strategies
Capitalize on events such as earnings announcements, mergers, or geopolitical news.
Algorithms scan news feeds and social media to react instantly.
Execution-Based Strategies
Focus on minimizing costs when executing large orders.
Examples: VWAP (Volume Weighted Average Price) and TWAP (Time Weighted Average Price).
4.2 Backtesting and Optimization
Before deployment, algorithms are rigorously backtested on historical data to measure profitability, risk, and robustness. Optimization helps refine parameters to adapt to different market conditions.
4.3 Customization
Traders can customize strategies depending on their goals:
Institutional investors use execution algorithms to minimize costs.
Hedge funds deploy arbitrage and statistical models.
Retail traders may automate swing or momentum strategies.
5. Smarter Decisions: The Intelligence of Algorithmic Trading
The next frontier in algo trading is not just speed and predefined strategies, but smart, adaptive decision-making.
5.1 Data-Driven Trading
Algorithms now ingest massive datasets beyond traditional market prices:
Social media sentiment (Twitter, Reddit).
Macroeconomic indicators.
Alternative data like satellite images, shipping data, and credit card transactions.
5.2 Artificial Intelligence and Machine Learning
Machine Learning Models: Identify hidden patterns in market behavior.
Natural Language Processing (NLP): Read and interpret financial news in real time.
Reinforcement Learning: Algorithms learn from trial-and-error in simulated markets to optimize strategies.
5.3 Risk Management Automation
Algorithms automatically place stop-loss orders, hedge exposures, and rebalance portfolios, ensuring smarter risk-adjusted decisions.
5.4 Human + Machine Collaboration
The best results often come when human intuition meets machine precision. Traders set the vision and risk appetite, while algorithms handle execution and monitoring.
6. Advantages of Algorithmic Trading
Efficiency – Faster execution with minimal errors.
Consistency – Eliminates emotional biases like fear and greed.
Liquidity – Enhances market depth through continuous order flow.
Cost Reduction – Reduces transaction costs for large trades.
Scalability – Algorithms can monitor thousands of securities simultaneously.
7. Challenges and Risks
Market Volatility – Algorithms can amplify panic during sudden downturns.
Overfitting in Backtests – Strategies may work on past data but fail in live markets.
Regulatory Scrutiny – Concerns over fairness, manipulation, and systemic risk.
Technology Dependence – Outages or glitches can lead to massive losses.
Crowded Trades – When too many algorithms follow the same logic, opportunities vanish.
Conclusion
Algorithmic trading represents the natural evolution of finance in the digital age. Its three pillars—speed, strategy, and smarter decisions—have made markets more efficient, competitive, and data-driven.
Yet, like any powerful tool, it requires caution, oversight, and responsibility. The goal is not just to trade faster or smarter, but to ensure markets remain fair, stable, and accessible.
As technology continues to evolve, algorithmic trading will become even more intelligent, integrating AI, alternative data, and quantum computing. In this future, the winners will not be those who merely chase speed, but those who design strategies rooted in smart, adaptive decision-making—where humans and machines collaborate to unlock the true potential of financial markets.
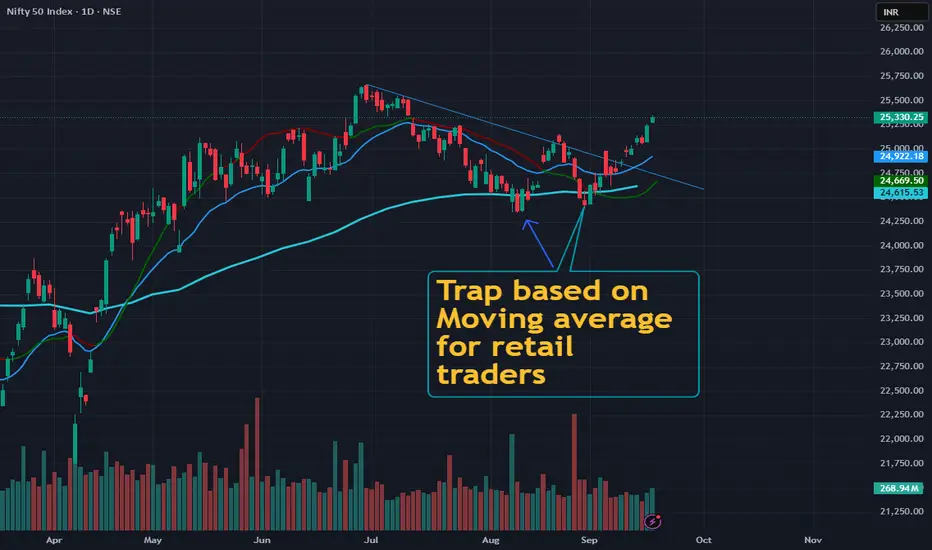
Why Most Traders Stay Average: The Comfort Trap[ Most traders treat moving averages like magic buy/sell buttons.
That’s not how professionals think .
A moving average is a map of trend + structure, not a trading signal.
❌ The Retail Mistake
Buying when price crosses above
Selling when price crosses below.
Blindly trusting “golden cross” or “death cross.”
👉 Result: Whipsaws, fake entries, frustration.
✅ The Pro Mindset
Trend filter: Are we in uptrend (above MA), downtrend (below MA), or chop (whipsaw around MA)?
Dynamic support/resistance: Does price respect the MA and bounce, or reject and break?
Mean reversion tool: If price stretches too far from the MA, expect it to snap back.
📊 In this NIFTY 50 chart:
April–June → Price rode the 50MA upward (dynamic support).
July–Aug → Price broke below → MA flipped into resistance.
Now → Price reclaiming above → shows buyers regaining control.
🎯 How You Can Use This
Use a 20/50/200 MA to filter trend → trade in the direction of bias.
Use MAs as areas of interest, not entry triggers. Wait for price reaction.
Don’t predict → let context confirm.
👉 Moving averages don’t predict. They contextualize.
Stop asking them for signals. Start using them as maps.
💡 Save this. Follow for daily trader mindset + real education — no fluff.
Divergence SecretsLong Straddle
Setup: Buy 1 Call + Buy 1 Put (same strike & expiry).
When to Use: Expect huge volatility but uncertain direction.
Logic: Profit if stock makes big move either way.
Example: Stock at ₹100. Buy Call 100 for ₹4 + Put 100 for ₹4 (total ₹8). If stock goes to ₹115, Call worth ₹15 (profit ₹7). If stock goes to ₹85, Put worth ₹15 (profit ₹7). Loss if stock stays near ₹100.
Long Strangle
Setup: Buy Out-of-the-Money Call + Buy Out-of-the-Money Put.
When to Use: Expect big move but cheaper than Straddle.
Logic: Profitable in strong moves but needs bigger movement than Straddle.
Example: Stock at ₹100. Buy Call 105 for ₹3 + Put 95 for ₹3. Total cost ₹6. Profit only if stock moves above 111 or below 89.
Bull Call Spread
Setup: Buy Call at lower strike + Sell Call at higher strike.
When to Use: Moderately bullish.
Logic: Reduces cost compared to naked Call.
Example: Stock ₹100. Buy Call 100 for ₹5, Sell Call 110 for ₹2. Net cost ₹3. Max profit = ₹7 (if stock > ₹110).
Bear Put Spread
Setup: Buy Put at higher strike + Sell Put at lower strike.
When to Use: Moderately bearish.
Logic: Cheaper than long Put.
Example: Stock ₹100. Buy Put 100 for ₹5, Sell Put 90 for ₹2. Net cost ₹3. Max profit = ₹7 (if stock < ₹90).
Iron Condor
Setup: Sell Out-of-the-Money Call Spread + Sell Out-of-the-Money Put Spread.
When to Use: Expect sideways movement with low volatility.
Logic: Earn premium as long as stock stays in range.
Example: Stock ₹100. Sell 90 Put, Buy 85 Put, Sell 110 Call, Buy 115 Call. Net premium collected ₹4. Profit if stock stays between 90–110.
Butterfly Spread
Setup: Buy 1 Call (low strike) + Sell 2 Calls (middle strike) + Buy 1 Call (high strike).
When to Use: Expect very low volatility, price near middle strike.
Logic: Profits if stock stays near center strike.
Example: Stock ₹100. Buy Call 95 for ₹7, Sell 2 Calls 100 for ₹4 each, Buy Call 105 for ₹2. Net cost = ₹1. Max profit at ₹100 = ₹4.
Collar Strategy
Setup: Buy stock + Buy Put + Sell Call.
When to Use: Want to protect downside while capping upside.
Logic: Provides range-bound protection.
Example: Stock ₹100. Buy Put 95 for ₹3, Sell Call 110 for ₹3. Net zero cost. Loss limited below ₹95, profit capped above ₹110.
Calendar Spread
Setup: Sell short-term option + Buy long-term option (same strike).
When to Use: Expect stock to remain stable short-term but move long-term.
Logic: Benefit from time decay in near-term option.
Example: Stock ₹100. Sell 1-month Call 100 for ₹3, Buy 3-month Call 100 for ₹6. Net cost ₹3.

PCR Tradng StrategiesTypes of Options Strategies
Options strategies can be classified based on complexity and purpose:
A. Basic (Beginner) Strategies
Covered Call
Protective Put
Long Call / Long Put
B. Intermediate Strategies
Bull Call Spread
Bear Put Spread
Collar Strategy
Straddle and Strangle
C. Advanced (Professional) Strategies
Butterfly Spread
Iron Condor
Calendar Spread
Ratio Spreads
Diagonal Spreads
Each of these strategies has its own setup, payoff diagram, and risk–reward profile. Let’s explore the most important ones.
Popular Options Strategies Explained with Examples
Covered Call
Setup: Buy stock + Sell Call option (same stock).
When to Use: Mildly bullish or neutral view.
Logic: You earn premium from the call while holding stock. If stock rises, gains are capped at strike price.
Example: Stock at ₹100. Buy stock and sell a Call at strike ₹110 for ₹5. If stock goes to ₹115, your profit is capped at ₹15 (₹10 from stock + ₹5 premium). If stock stays flat, you still keep the ₹5 premium.
Protective Put
Setup: Buy stock + Buy Put option.
When to Use: Bullish but want downside protection.
Logic: Works like insurance—limits potential loss if stock falls.
Example: Stock at ₹100. Buy stock + Put at strike ₹95 for ₹3. If stock drops to ₹80, your loss is capped (you can sell at ₹95).

Option Trading Introduction to Options Trading Strategies
Options trading is one of the most versatile areas of financial markets. Unlike buying and selling stocks directly, options allow traders to take advantage of different market conditions—whether bullish, bearish, neutral, or highly volatile. An option is essentially a financial contract that gives the buyer the right, but not the obligation, to buy (Call option) or sell (Put option) an underlying asset at a predetermined price (strike price) within a certain time (expiry).
While options can be used for speculation, hedging, or income generation, their real power lies in combining them into strategies. A strategy is nothing but a structured position involving one or more options (and sometimes the underlying asset) to create a favorable risk–reward setup.
Why are strategies important? Because trading options without a plan is risky—premiums decay, volatility shifts, and market direction can change suddenly. With the right strategy, a trader can limit losses, protect gains, and even profit when the market doesn’t move much.
This is why professional traders, institutions, and hedge funds rely on well-designed options strategies to manage risk and generate consistent returns.
Why Strategies Are Needed in Options
Options are unique compared to equities or futures. While buying a stock means unlimited upside and downside exposure, options introduce time decay (theta), volatility risk (vega), and sensitivity to price changes (delta). Without strategies, a trader might:
Lose money despite being directionally correct.
Face unlimited risk when shorting naked options.
Fail to take advantage of sideways or volatile markets.
For example: Suppose you are bullish on a stock trading at ₹100. You buy a Call at strike ₹105 for ₹5. If the stock moves to ₹110, you gain ₹5. But if it just stays at ₹100 till expiry, you lose the entire premium—even though your view wasn’t wrong about stability. This is why strategies like spreads, straddles, and condors exist—they help fine-tune payoffs.
Thus, option strategies allow you to customize risk and reward as per your market outlook.

Part 2 Support and Resistance Advantages of Options Trading
Leverage: Control a large position with limited capital.
Hedging: Protect stock holdings from adverse movements.
Flexibility: Multiple strategies for different market conditions.
Income Generation: Sell options for premium income.
Speculation: Profit from both rising and falling markets.
Market Dynamics and Participants
Options markets involve diverse participants:
Retail Traders – Individual investors trading for speculation or hedging.
Institutional Traders – Hedge funds, mutual funds, and banks use options for portfolio strategies.
Market Makers – Ensure liquidity by continuously quoting bid-ask prices.
Regulators – SEBI in India, SEC in the US, maintain fair and transparent trading practices.
Options trading occurs in exchanges like NSE, BSE, CBOE, offering standardized contracts. Indian markets primarily trade in equity options and index options.
Practical Tips for Options Trading
Start Small – Begin with limited capital while learning strategies.
Understand Greeks – They help manage risk and strategy adjustments.
Focus on Liquid Options – Avoid thinly traded contracts for better execution.
Use Stop Loss and Risk Management – Limit losses in volatile markets.
Monitor Time Decay – Be aware of how options lose value as expiration nears.
Combine Strategies – Mix calls, puts, and spreads for hedging or speculation.
Stay Updated on Market News – Earnings, policy changes, and global events impact volatility.

Part 1 Support and Resistance Option Trading Strategies
Options are highly versatile, allowing traders to implement strategies for bullish, bearish, or neutral markets. Some key strategies include:
a) Basic Strategies
Long Call – Buy a call option expecting price rise.
Long Put – Buy a put option expecting price fall.
Covered Call – Own the underlying stock and sell a call for income.
Protective Put – Own the stock and buy a put for downside protection.
b) Intermediate Strategies
Straddle – Buy both call and put with the same strike to profit from volatility.
Strangle – Buy out-of-the-money call and put to capture larger moves.
Bull Call Spread – Buy a lower strike call and sell a higher strike call to reduce premium.
Bear Put Spread – Buy a higher strike put and sell a lower strike put to limit risk.
c) Advanced Strategies
Iron Condor – Sell an out-of-the-money call and put while buying further OTM options to limit loss; profits in low volatility.
Butterfly Spread – Use multiple calls/puts to profit from minimal movement.
Calendar Spread – Sell a near-term option and buy a long-term option to profit from time decay differences.
Risk and Reward in Options
Options provide leverage, meaning a small price movement can result in substantial gains or losses. Understanding risk is crucial:
For Buyers
Maximum loss is the premium paid.
Potential profit can be unlimited (for calls) or substantial (for puts).
For Sellers (Writers)
Maximum loss can be unlimited if uncovered (naked) calls.
Premium received is the maximum gain.
Key Risks
Time decay (Theta) erodes value.
Volatility risk (Vega) can reduce option price.
Liquidity risk if the option is thinly traded.

Part 2 Candle Stick Pattern Types of Options
There are two primary types of options:
a) Call Options
Gives the holder the right to buy an underlying asset at a specified strike price.
Investors buy calls when they expect the underlying asset price to rise.
Example: If stock ABC is trading at ₹100 and you buy a call with a strike price of ₹110, you profit if ABC rises above ₹110 plus the premium paid.
b) Put Options
Gives the holder the right to sell an underlying asset at a specified strike price.
Investors buy puts when they expect the underlying asset price to fall.
Example: If stock XYZ is trading at ₹200 and you buy a put with a strike price of ₹190, you profit if XYZ falls below ₹190 minus the premium paid.
Option Pricing and Valuation
Option pricing is crucial in determining potential profits and risks. Two main components influence the price of an option:
a) Intrinsic Value
For a call option: Current Price – Strike Price
For a put option: Strike Price – Current Price
Intrinsic value is zero if the option is out-of-the-money.
b) Time Value
Time value depends on:
Time to Expiry: Longer time increases the premium.
Volatility: Higher volatility increases the likelihood of profitable movements.
Interest Rates: Small effect on option premiums.
Dividends: Impact options on dividend-paying stocks.
c) Black-Scholes Model
Widely used for European-style options pricing.
Formula incorporates current stock price, strike price, time to expiration, volatility, and risk-free rate.
d) Greeks
Measures the sensitivity of option prices to various factors:
Delta: Sensitivity to the underlying asset price.
Gamma: Rate of change of delta.
Theta: Time decay effect.
Vega: Sensitivity to volatility.
Rho: Sensitivity to interest rate changes.

Part 1 Candle Stick Pattern Introduction
Options trading is one of the most versatile and powerful instruments in the financial markets. Unlike traditional stock trading, options allow traders and investors to gain exposure to an asset's price movements without actually owning the asset. Options belong to the derivatives family because their value derives from an underlying asset, such as stocks, indices, commodities, currencies, or ETFs.
Options trading has become increasingly popular in India, the United States, and global markets due to its flexibility, potential for leveraged profits, and ability to hedge risks. Investors use options for speculation, income generation, and risk management, making it a crucial tool in modern portfolio strategies.
Basics of Options
An option is a contract that gives the holder the right, but not the obligation, to buy or sell an underlying asset at a predetermined price on or before a specific date. This differentiates options from futures, where both parties are obligated to execute the contract.
Key terms in options trading:
Underlying Asset: The stock, index, commodity, or currency on which the option is based.
Strike Price: The price at which the option holder can buy (call) or sell (put) the underlying asset.
Expiry Date: The date on which the option contract expires.
Premium: The cost of buying an option, paid by the buyer to the seller.
Intrinsic Value: The difference between the current price of the underlying and the strike price, if favorable to the option holder.
Time Value: The extra value based on the time remaining until expiration and expected volatility.
In-the-Money (ITM), At-the-Money (ATM), Out-of-the-Money (OTM): Terms used to describe an option’s profitability status.
Options provide flexibility, allowing investors to profit from rising, falling, or sideways markets, depending on the chosen strategy.

PSU vs Private Banks: Investment Battle1. Banking Landscape in India
India’s banking sector is unique, blending legacy government-run institutions with modern, technology-driven private entities. As of 2025, there are:
Public Sector Banks (PSBs): 12 major banks, including SBI, Punjab National Bank, Bank of Baroda. Government holds a majority stake.
Private Sector Banks: Around 20 significant players, including HDFC Bank, ICICI Bank, Axis Bank, and Kotak Mahindra Bank.
Foreign Banks: Limited presence, serving niche segments.
Regional Rural Banks and Cooperative Banks: Focused on rural and agricultural lending.
PSUs historically had a social mission, prioritizing financial inclusion and rural credit, sometimes at the cost of profitability. Private banks, by contrast, prioritize efficiency, profitability, and innovation, targeting urban and retail segments. This sets the stage for the ongoing investment debate between the two.
2. Understanding PSU Banks
History and Role
PSU banks have roots in the post-independence era, where the government sought to consolidate fragmented banks and direct credit toward nation-building projects. The nationalization of 14 major banks in 1969, followed by six more in 1980, created the PSU banking system we see today. The objective was to:
Expand banking access to rural areas.
Fund agriculture, small businesses, and priority sectors.
Ensure financial stability during economic challenges.
Strengths of PSU Banks
Government Backing: Full support in crises, ensuring deposit safety.
Wide Reach: Extensive branch networks, especially in rural India.
Trust and Stability: Legacy institutions like SBI enjoy strong brand recognition.
Policy Benefits: Preferential government deposits and funding.
Weaknesses of PSU Banks
High NPAs (Non-Performing Assets): Historically, poor credit appraisal led to stressed assets.
Operational Inefficiency: Legacy systems, bureaucracy, and slow decision-making.
Lower Profitability: ROE and NIM often lag private peers.
Limited Innovation: Digital adoption and customer experience often lag private banks.
3. Understanding Private Banks
Emergence and Growth
Private banks gained prominence post-liberalization (1991), focusing on urban and semi-urban markets. HDFC Bank (1994) and ICICI Bank (1994) pioneered private sector banking with modern technology, efficient risk management, and customer-centric products.
Strengths of Private Banks
Higher Profitability: Strong ROE, better margins, and lean operations.
Innovation: Digital banking, mobile apps, and AI-driven solutions.
Asset Quality: Lower NPAs due to stricter credit appraisal.
Brand and Service: Emphasis on customer experience and retail lending.
Weaknesses of Private Banks
Limited Rural Reach: Focus on profitable urban segments, neglecting rural credit.
Dependence on Retail Credit: Vulnerable to interest rate fluctuations and economic cycles.
Higher Competition: Niche banks face intense competition from both PSUs and fintechs.
4. Investor Perspective
Dividend vs Growth Investing
PSU Banks: Often provide stable dividends due to government support, appealing to income-focused investors.
Private Banks: Focus on growth; dividends may be lower but capital appreciation is higher.
Risk vs Return Profile
PSU banks are lower-risk in terms of deposit safety but higher operational and credit risk.
Private banks offer higher returns but are more exposed to economic cycles and market volatility.
Long-Term vs Short-Term Outlook
Long-term investors may benefit from PSU reforms and privatization, while private banks continue to grow due to market share gains and digital adoption.
5. Regulatory & Policy Support
RBI Oversight: Capital adequacy, NPAs, and risk management regulations apply to all banks.
Government Reforms: Privatization plans and capital infusion for PSU banks aim to improve competitiveness.
Priority Sector Lending: PSUs are mandated, private banks have optional compliance with targets.
6. Future Outlook
Digital Disruption
Private banks are adopting AI, fintech partnerships, and advanced analytics faster, potentially widening the performance gap.
Credit Demand
India’s growth trajectory (targeting a $5 trillion economy) ensures rising credit demand. Both PSU and private banks will benefit, but private banks may gain market share in retail and SME segments.
PSU Revival
With government reforms, improved risk management, and digitization, PSUs could become more efficient, making them attractive for long-term value investors.
Private Expansion
Private banks continue to expand in semi-urban and rural markets, leveraging technology to offer competitive products.
Conclusion: The Investment Battle
The battle between PSU and private banks is essentially a trade-off between safety, stability, and growth:
PSU Banks: Suitable for risk-averse investors seeking dividends and potential long-term gains from reforms.
Private Banks: Suitable for growth-focused investors seeking high returns and digital innovation exposure.
Balanced Portfolio Approach: Combining both can provide a mix of stability, income, and growth potential.
The investment choice depends on individual risk appetite, investment horizon, and market outlook. PSU banks represent legacy, government backing, and potential undervaluation, while private banks symbolize efficiency, innovation, and growth. Understanding these dynamics is critical for investors navigating India’s complex banking sector.

Commodities & MCX Gold-Silver Trading: A Complete Guide1. Introduction to Commodity Markets
Commodities have been the backbone of trade for centuries. They represent raw materials or primary agricultural products that can be bought, sold, and exchanged. Commodity markets are essential because they provide a platform for producers, consumers, and investors to manage price risks, discover prices transparently, and facilitate investment opportunities.
Globally, commodities are divided into two main types:
Hard Commodities – Naturally mined resources like gold, silver, crude oil, and copper.
Soft Commodities – Agricultural products such as wheat, coffee, sugar, and cotton.
In India, the commodities market has evolved significantly, moving from physical trade in traditional markets to electronic platforms where futures contracts are traded. Among these, gold and silver have gained prominence due to their dual role as both an investment asset and a hedge against inflation.
2. Evolution of Commodity Trading Globally & in India
Commodity trading has a long history, dating back to ancient civilizations where merchants and farmers would trade goods in local bazaars. In the modern era, commodity exchanges were established in Europe and the United States to provide standardization, transparency, and regulated trading.
In India, organized commodity trading began in the 19th century with local exchanges, but it gained structure with the Multi Commodity Exchange (MCX) in 2003. The MCX enabled electronic trading, introduced standardized contracts, and attracted institutional and retail investors alike. Today, India has several commodity exchanges, but MCX remains the most popular platform for trading gold, silver, and other metals.
3. What is MCX (Multi Commodity Exchange)?
The Multi Commodity Exchange of India (MCX) is India’s largest commodity derivatives exchange. It provides a regulated platform for trading futures contracts in metals, energy, and agricultural commodities. MCX’s key features include:
Transparency: Real-time prices are displayed, ensuring price discovery.
Liquidity: High trading volume allows investors to enter and exit positions efficiently.
Standardization: Contracts have defined lot sizes, expiry dates, and quality specifications.
Risk Management: Use of margins and clearing mechanisms protects both buyers and sellers.
MCX has become a gateway for both domestic and global traders to participate in India’s commodities market, particularly in precious metals like gold and silver.
4. Gold & Silver as Commodities
Gold and silver are unique commodities. They are not just raw materials but also financial assets. Globally, they are recognized as stores of value and act as hedges during times of economic uncertainty.
Gold: Primarily used in jewelry, electronics, and as an investment instrument. Central banks also hold gold reserves as a financial security measure.
Silver: Used in industrial applications (electronics, solar panels, medical instruments) and jewelry. Silver is more volatile than gold due to its dual role as both an industrial metal and a store of value.
The prices of these metals are influenced by global demand-supply dynamics, currency movements, interest rates, and geopolitical events.
5. Factors Driving Gold & Silver Prices
Several factors impact gold and silver prices in the MCX market:
Global Economic Conditions: During economic uncertainty, gold and silver attract investors as safe-haven assets.
US Dollar Strength: Gold and silver are priced in USD globally; a strong dollar often depresses their prices.
Inflation: Precious metals act as a hedge against inflation, driving demand during rising price levels.
Interest Rates: Higher interest rates make non-yielding assets like gold less attractive.
Industrial Demand: Silver prices are more sensitive to industrial usage compared to gold.
Geopolitical Tensions: Conflicts and crises boost demand for safe-haven metals.
6. Gold-Silver Ratio in Trading
The gold-silver ratio represents the amount of silver needed to buy one ounce of gold. It is a key tool for traders:
High ratio: Indicates silver is undervalued relative to gold, potentially a buying opportunity.
Low ratio: Suggests silver is expensive relative to gold, signaling a potential sell or hedge.
MCX traders often use this ratio to make pair trades, hedging one metal against the other to minimize risk while capitalizing on market trends.
7. How MCX Gold & Silver Contracts Work
MCX offers futures contracts for gold and silver. A futures contract is an agreement to buy or sell a specified quantity of metal at a predetermined price on a future date.
Gold Contracts: Standard lot sizes of 1 kg.
Silver Contracts: Standard lot sizes of 30 kg.
Contracts are traded electronically on MCX, and prices fluctuate based on market demand, global metal prices, and domestic factors.
8. Trading Mechanisms (Spot vs Futures)
There are two main trading methods in gold and silver:
Spot Market: Immediate delivery of physical gold/silver at current market price. Mostly used by jewelers and industrial buyers.
Futures Market: Traders speculate on future price movements without owning physical metals. Futures are more popular among investors seeking leverage and hedging opportunities.
MCX focuses on futures trading, allowing participants to profit from both rising and falling markets through buying (long) or selling (short) positions.
9. Risks & Challenges in Commodities Trading
While gold and silver trading is lucrative, it carries risks:
Market Volatility: Precious metal prices can swing sharply.
Leverage Risk: High margins amplify both gains and losses.
Liquidity Risk: Less liquid contracts may be harder to exit at desired prices.
Regulatory Risk: Changes in taxation, import duties, or trading rules can affect profits.
Global Dependence: Prices are influenced by global events beyond domestic control.
Risk management through stop-loss orders, position sizing, and diversification is essential for MCX traders.
10. Conclusion
Gold and silver trading on MCX represents a dynamic intersection of investment, speculation, and hedging. These metals are not just financial instruments but are deeply intertwined with global economic conditions, currency movements, and geopolitical developments.
By understanding contract specifications, trading mechanisms, price drivers, and risk management, traders can navigate the complex world of MCX commodities effectively. While risks exist, disciplined trading strategies, combined with global insights, can make gold and silver futures a profitable and rewarding venture for both retail and institutional investors.
MCX gold and silver trading is more than just buying and selling; it is an art of balancing global insights, domestic trends, and personal risk appetite, making it one of the most engaging markets in India’s financial ecosystem.
Volume Profile & Market Structure AnalysisPart 1: Understanding Market Structure
1.1 What is Market Structure?
Market structure is the framework of price movement. It’s the natural rhythm of the market, made up of highs, lows, trends, ranges, breakouts, and consolidations. Think of it as the skeleton of price action, which reveals how institutions and retail traders interact.
In simple terms, market structure helps us answer:
Is the market trending up, trending down, or consolidating?
Where are liquidity pools likely located?
Which price levels matter most to big players (banks, hedge funds, market makers)?
1.2 The Building Blocks of Market Structure
Swing Highs and Swing Lows
Swing High: A peak where price fails to continue higher.
Swing Low: A valley where price fails to continue lower.
These levels often act as liquidity pools where stop losses gather.
Trends
Uptrend: Higher highs (HH) and higher lows (HL).
Downtrend: Lower lows (LL) and lower highs (LH).
Sideways/Range: Price oscillates between support and resistance with no clear direction.
Break of Structure (BoS)
When price violates the previous high or low, signaling a shift in trend. Example: if price makes a new higher high after a downtrend, that could signal a bullish shift.
Change of Character (ChoCh)
A sudden break in the short-term market rhythm, often the first clue of a potential trend reversal.
Liquidity
Stop orders, pending orders, and clusters of positions sitting around obvious levels (support, resistance, round numbers).
Market makers often push price toward these liquidity zones to fill large institutional orders.
1.3 Institutional vs. Retail Market Structure
Retail traders often focus on patterns (double tops, triangles, flags).
Institutions care about liquidity and order flow. They engineer moves to trap retail positions and accumulate their own.
This is why understanding structure at an institutional level (smart money concepts) is crucial. It explains phenomena like false breakouts, liquidity sweeps, and stop hunts.
Part 2: Understanding Volume Profile
2.1 What is Volume Profile?
Volume Profile is a charting tool that shows how much trading volume occurred at each price level during a given period. Instead of just telling you “when” trades occurred (time-based volume), it tells you “where” trades occurred in price.
The Volume Profile is plotted as a horizontal histogram along the price axis. This makes it easier to see which price zones attracted the most participation from traders and institutions.
2.2 Key Components of Volume Profile
Point of Control (POC)
The price level with the highest traded volume.
Acts as a magnet for price because it represents “fair value.”
Value Area (VA)
The range where about 70% of trading volume occurred.
Split into:
Value Area High (VAH)
Value Area Low (VAL)
High-Volume Nodes (HVN)
Areas of heavy participation (accumulation zones).
Price often consolidates here.
Low-Volume Nodes (LVN)
Areas where price quickly passed through with little trading.
Often act as support/resistance.
2.3 Why Volume Profile Matters
Shows institutional footprints: Institutions need liquidity to fill big orders, so they often transact heavily around POC and HVNs.
Highlights imbalances: When price rejects LVNs, it suggests aggressive buying/selling dominance.
Helps with trade entries & exits: Knowing where fair value is (POC) vs. imbalance zones helps traders time reversals or continuations.
Part 3: Combining Market Structure & Volume Profile
Market Structure tells you the direction of the market, while Volume Profile shows you where the heavy battles occur. Used together, they create a powerful framework.
3.1 Example: Trend Continuation Setup
Step 1: Identify the trend using Market Structure (higher highs, higher lows).
Step 2: Look at Volume Profile to find the POC or Value Area Low (support).
Step 3: If price retraces to VAL while maintaining bullish structure, it’s often a high-probability continuation zone.
3.2 Example: Reversal Setup
Step 1: Notice a Change of Character (ChoCh) in structure.
Step 2: Check if price swept liquidity near an HVN or POC.
Step 3: If Volume Profile shows rejection of that value area, it signals strong reversal potential.
3.3 Liquidity & Volume Synergy
Liquidity pools (stop-loss clusters) often sit near low-volume nodes because price moves fast through those zones.
Institutions push price into these LVNs to trigger stops and then absorb liquidity.
Once filled, price usually returns to HVNs (fair value).
Part 4: Practical Strategies with Volume Profile & Market Structure
4.1 The Volume Profile Rejection Strategy
Identify LVNs.
Wait for price to test and sharply reject.
Enter with trend confirmation from market structure.
4.2 Breakout + Volume Profile Confirmation
If price breaks a structural level (BoS), check if it’s supported by high volume near POC.
Strong volume = genuine breakout.
Weak volume = likely false breakout.
4.3 Value Area Rotations
Price often oscillates between VAH and VAL.
Strategy: Buy near VAL, sell near VAH, exit at POC.
Works best in ranging conditions.
Part 5: Psychological & Institutional Insights
Retail Traps: Market structure fakeouts occur around LVNs, engineered by institutions.
Smart Money Accumulation: Seen in HVNs—where large players accumulate before big moves.
Auction Theory: Markets function as auctions—Volume Profile is essentially a visualization of that auction process.
Conclusion
Volume Profile and Market Structure Analysis are not “magic bullets,” but together they form one of the most institutionally aligned trading frameworks available to retail traders.
Market Structure explains where price wants to go.
Volume Profile explains where participants are most active.
By combining them, traders can anticipate moves with higher probability, avoid traps, and align themselves closer to the behavior of professional market participants.
Ultimately, the goal is to stop thinking like a retail trader chasing indicators and start thinking like a liquidity hunter—someone who understands where the market is auctioning, who’s trapped, and where the next wave of orders is likely to hit.
Options Trading Boom1. The Evolution of Options Trading
Options trading has been around for centuries. Its earliest form can be traced back to ancient Greece, where philosopher Thales is said to have used olive press contracts to profit from harvest predictions. But modern options markets began to take shape in the 20th century.
1973 – The CBOE (Chicago Board Options Exchange) was founded, creating the first organized exchange for standardized options contracts.
The same year, the Black-Scholes Model was introduced, giving traders a mathematical framework to price options.
In India, options trading was introduced much later — in 2001, with stock options and index options gradually gaining traction.
For decades, options were mostly used by large investors for hedging risks. Retail participation was limited due to complexity, lack of awareness, and accessibility issues. However, the landscape has dramatically changed in the last decade.
2. Why the Boom?
The options trading boom is the result of multiple forces coming together. Let’s look at the major drivers:
(a) Technology and Trading Platforms
Advances in online brokerages, mobile apps, and real-time data have made options trading accessible to millions. Earlier, one needed a broker and significant capital, but today platforms like Zerodha, Upstox, Robinhood, and Interactive Brokers allow users to trade with just a few clicks.
(b) Low Cost and Leverage
Options provide huge leverage. For a small premium, traders can control large positions in underlying stocks or indices. This attracts both speculators and small retail investors looking for high returns with low capital.
(c) Market Volatility
Periods of high volatility (such as the COVID-19 pandemic and global economic uncertainty) have made options attractive. Traders use them to profit from large price swings or hedge risks in turbulent times.
(d) Retail Investor Participation
The rise of financial literacy, YouTube channels, Telegram groups, and online communities has led to an explosion in retail participation. People now see options as a way to grow wealth faster than traditional investing.
(e) Globalization and FOMO
The success stories of options traders in the U.S. (like those from the WallStreetBets community during the GameStop saga) have inspired traders worldwide. Fear of missing out (FOMO) has further accelerated participation.
3. Options Trading in Numbers
The boom is not just hype; it’s backed by hard data.
U.S. Markets: In 2021, options trading volumes hit record highs, with over 9.9 billion contracts traded, surpassing stock trading volumes.
India: NSE (National Stock Exchange) has emerged as the largest derivatives exchange in the world by volume, thanks to the surge in index options trading. Weekly expiry contracts on Nifty and Bank Nifty see massive participation.
China & Europe: Options markets are growing, although regulatory frameworks differ.
These figures highlight the shift from equities to derivatives as the preferred playground for traders.
4. Types of Options Strategies Driving Popularity
Options aren’t just about buying calls and puts; their real beauty lies in the ability to craft strategies for different market conditions. Some of the most popular strategies include:
Covered Call Writing – Investors hold stocks and sell call options to generate income.
Protective Put – Buying puts to protect against downside risks.
Straddle/Strangle – Profiting from volatility by buying both calls and puts.
Iron Condor & Butterfly Spread – Neutral strategies that profit from limited price movement.
These strategies make options versatile. Whether the market is bullish, bearish, or range-bound, traders can position themselves accordingly.
5. Options and Retail Traders
Retail traders are at the heart of this boom. Several factors explain their surge in participation:
Lower Entry Barriers: Small capital requirements make it easier for new traders to start.
Educational Content: Online tutorials, courses, and trading communities have simplified concepts.
Gamification of Trading: Apps provide user-friendly interfaces, notifications, and even rewards, making trading engaging.
Short-Term Thrill: Options provide quick results, unlike traditional investing, which takes years.
But while retail participation has democratized finance, it has also raised concerns about reckless speculation.
6. Risks in the Options Boom
The boom is exciting, but it comes with risks. Many traders underestimate the complexities of options and focus only on quick profits.
Leverage Risk: Small premiums can lead to big losses if the market moves against the trader.
Lack of Knowledge: Many retail traders jump in without understanding Greeks (Delta, Theta, Vega, Gamma).
High Failure Rate: Studies show that a large percentage of retail traders lose money in options.
Addiction to Trading: Options can be addictive due to their casino-like thrill.
This is why experts stress on risk management, position sizing, and proper education.
7. Institutional Players and Market Makers
The options boom isn’t just retail-driven. Institutional investors, hedge funds, and market makers also play a major role.
Hedging: Institutions use options to protect large portfolios.
Liquidity: Market makers provide liquidity by continuously buying and selling contracts.
Algorithmic Trading: Quant funds use algorithms to exploit pricing inefficiencies in options.
This mix of retail enthusiasm and institutional sophistication adds depth to the market.
Opportunities in the Options Boom
The boom isn’t just about trading; it has created opportunities in multiple areas:
Education & Training: Demand for options trading courses and mentorship has skyrocketed.
Technology Startups: Fintech firms building options analytics tools are flourishing.
Content Creation: Influencers and educators focusing on options have large audiences.
Brokerages & Exchanges: Higher volumes mean more revenue for exchanges and brokers.
Conclusion
The options trading boom is a defining trend of modern financial markets. It represents the democratization of sophisticated financial instruments that were once restricted to big players. Today, a college student with a smartphone can access the same markets as a hedge fund manager.
But this democratization comes with responsibilities. While options offer flexibility, leverage, and opportunities, they also demand knowledge, discipline, and risk management. Traders who treat options like a casino may lose big, while those who master strategies can use them to build wealth and manage risks effectively.
The boom is not a bubble; it’s an evolution in how markets operate. Options are here to stay, and their influence will only grow in the coming years. Whether you’re a retail trader, an institutional investor, or a policymaker, understanding the dynamics of this boom is essential for navigating the future of finance.
Algo & Quant Trading in IndiaIntroduction
The Indian financial markets have witnessed a remarkable transformation over the past two decades. From open outcry systems in regional stock exchanges to fully automated electronic trading platforms, India’s capital markets have evolved into one of the fastest-growing ecosystems in the world. Among the most significant developments in recent years is the rise of algorithmic trading (algo trading) and quantitative trading (quant trading).
In simple terms:
Algorithmic trading uses pre-programmed computer instructions (algorithms) to execute trades in financial markets.
Quantitative trading relies on mathematical and statistical models to identify trading opportunities.
Together, they form the backbone of modern high-speed and data-driven trading strategies. In India, the adoption of algo and quant trading has grown rapidly, supported by advances in technology, regulatory approval, and the increasing sophistication of market participants.
This article provides a comprehensive 3000-word description of algo and quant trading in India, including its evolution, functioning, strategies, regulatory landscape, challenges, and the future ahead.
Evolution of Algo & Quant Trading in India
Early 2000s: The Seeds of Automation
The National Stock Exchange (NSE) introduced electronic trading systems in the 1990s, replacing traditional open outcry methods. This laid the foundation for automated order placement. However, at that time, trading was still manual — brokers placed buy and sell orders directly.
The first signs of algorithmic trading emerged in the early 2000s, when institutional investors started experimenting with Direct Market Access (DMA). This allowed traders to place orders directly into the exchange’s trading system without manual intervention by brokers.
2008: SEBI’s Green Signal
In 2008, the Securities and Exchange Board of India (SEBI) formally allowed algorithmic trading in India. This was a landmark event. Initially, adoption was slow due to high costs, lack of awareness, and limited technological infrastructure.
2010s: Rapid Growth
The next decade saw exponential growth in algo trading:
The NSE introduced co-location facilities (where traders could place their servers near exchange servers to reduce latency).
Institutional investors, hedge funds, and proprietary trading firms increasingly adopted algorithmic and quantitative strategies.
Retail participation remained limited, but brokers began offering algo-based tools to their clients.
By 2019, about 50% of trading volume on Indian exchanges was driven by algorithms, mostly by large institutions.
2020s: Democratization of Algo Trading
With the rise of fintech, APIs, and discount brokers, algo and quant trading started reaching retail traders. Platforms like Zerodha Streak, Upstox API, and others began offering plug-and-play strategies for small investors.
Today, algo trading is not just the playground of hedge funds and foreign investors — even retail traders in India are experimenting with coding their own strategies.
What is Algo Trading?
Algo trading refers to computerized trading where pre-programmed rules determine the execution of trades. These rules can include price, timing, volume, and mathematical models.
For example, instead of manually watching charts and entering trades, a trader can program:
“If Nifty 50 rises above its 50-day moving average and volume increases by 20%, buy 100 shares of HDFC Bank.”
The computer will then execute this trade instantly and without emotions.
Benefits of Algo Trading
Speed: Orders are executed in milliseconds.
Accuracy: Eliminates manual entry errors.
Emotion-Free: No fear, greed, or panic.
Backtesting: Traders can test strategies on historical data.
Cost Efficiency: Reduces market impact and transaction costs.
What is Quant Trading?
Quantitative (quant) trading is a step deeper than algo trading. It uses advanced mathematical, statistical, and computational models to identify profitable patterns in markets.
For example, a quant trader might use machine learning models to analyze correlations between global interest rates, currency fluctuations, and Indian equity prices to predict short-term opportunities.
Key Features of Quant Trading
Data-Driven: Relies heavily on historical and real-time data.
Models and Predictions: Uses regression, probability, and AI/ML algorithms.
Risk Management: Emphasizes hedging and portfolio optimization.
Scalability: Models can be applied across multiple assets and markets.
In short, all quant trading is algorithmic, but not all algorithmic trading is quantitative. Algo can be simple rule-based, while quant involves complex mathematical logic.
Popular Algo & Quant Strategies in India
Indian traders and institutions use a wide variety of algo and quant strategies, depending on their goals, risk appetite, and access to data. Some of the most popular include:
1. Trend-Following Strategies
Based on moving averages, momentum indicators, and breakouts.
Example: Buy Nifty futures when the price crosses above 200-day EMA with high volume.
2. Arbitrage Strategies
Exploit price differences across instruments.
Types include:
Cash-Futures Arbitrage: Buying stock in the cash market and selling futures when prices differ.
Index Arbitrage: Exploiting mispricing between index futures and constituent stocks.
3. Statistical Arbitrage (Pairs Trading)
Identify two historically correlated stocks (e.g., HDFC Bank and ICICI Bank).
If correlation breaks temporarily, long one and short the other, expecting mean reversion.
4. High-Frequency Trading (HFT)
Involves ultra-fast order execution using co-location servers.
Firms place thousands of trades within seconds to capture tiny price inefficiencies.
5. Options-Based Algo Strategies
Automated execution of straddles, strangles, iron condors, etc.
Dynamic hedging using the Greeks (delta, gamma, theta).
6. Market Making Algorithms
Providing liquidity by continuously quoting buy/sell prices.
Profits earned from bid-ask spreads.
7. Quantitative Models
Factor investing (value, momentum, quality).
Machine learning predictions (random forest, neural networks).
Sentiment analysis using news and social media.
Regulatory Landscape in India
Algo and quant trading in India are tightly regulated by SEBI to ensure fairness and reduce systemic risks.
Key Regulations
Approval Requirement: Brokers offering algo services must get approval from exchanges.
Risk Controls: Mandatory circuit breakers, order limits, and risk checks before execution.
Co-Location Services: Exchanges offer equal access to minimize unfair advantages.
Audit Trails: Brokers must maintain complete records of all algo trades.
Retail Algo Regulations (2022): SEBI proposed stricter oversight on retail algo platforms to prevent misuse and scams.
Concerns for Regulators
Market manipulation through spoofing and layering.
Flash crashes caused by runaway algorithms.
Unequal playing field between institutions and small traders.
Despite these challenges, SEBI has been proactive in encouraging innovation while maintaining safety.
Technology Infrastructure
Algo and quant trading in India require robust technology:
Low Latency Networks: Millisecond execution is crucial.
Co-Location Facilities: Placing servers near exchanges.
APIs and Algo Platforms: Brokers like Zerodha, Upstox, and Interactive Brokers provide APIs.
Programming Languages: Python, R, C++, and Java are widely used.
Data Feeds: Real-time tick data from NSE/BSE is critical.
Conclusion
Algo and quant trading are reshaping India’s capital markets. What began as an institutional experiment in 2008 has now become mainstream, driving nearly half of all exchange volumes. While challenges remain in terms of regulation, infrastructure, and retail education, the future looks promising.
India’s unique mix of high market participation, growing fintech innovation, and regulatory oversight positions it as a global hub for algorithmic and quantitative trading.
In the coming years, the line between human and machine-driven decisions will blur further. Traders who adapt to this new paradigm — whether retail or institutional — will be better placed to thrive in the fast-paced world of Indian financial markets.
Sectoral Rotation & India’s Growth StoriesIntroduction
India is one of the fastest-growing economies in the world, standing at the intersection of tradition and innovation. From being an agrarian economy to becoming a services-driven powerhouse and now steadily rising as a manufacturing hub, India’s growth story has been shaped by shifting macroeconomic cycles, government reforms, global trade patterns, and evolving consumer demand.
One of the most powerful ways to understand and capture this growth is through sectoral rotation – the process by which capital moves from one industry to another, depending on the stage of the economic cycle. For investors, traders, policymakers, and business leaders, analyzing sectoral rotation is not just an exercise in market timing—it is a way to understand how India’s story unfolds across different industries.
In this essay, we will dive deep into:
The concept of sectoral rotation.
How sectoral rotation plays out in the Indian economy.
India’s key growth stories and emerging sectors.
Case studies of sectoral transitions in the past two decades.
How investors and businesses can benefit from sectoral rotation.
Understanding Sectoral Rotation
Sectoral rotation refers to the systematic movement of investments across different sectors of the economy, depending on which industries are expected to outperform at a given point in the business or economic cycle.
In early expansion phases, cyclical sectors like banking, automobiles, infrastructure, and capital goods tend to outperform as demand revives and investments pick up.
In the mid-cycle, consumer durables, IT, and manufacturing-driven sectors show strength as income rises and companies expand.
In the late cycle or slowdown phases, defensive sectors like FMCG, healthcare, and utilities gain momentum since they provide stable returns even in uncertain times.
Globally, sectoral rotation is a well-documented strategy, but in India, it carries a unique flavor due to:
Strong government policy interventions.
Rapid demographic shifts.
Dependence on monsoons and agriculture in rural demand.
The interplay of global commodity cycles with domestic growth.
India’s Sectoral Journey Over Time
1. The 1990s – Liberalization & IT Boom
India opened its economy in 1991.
The IT sector became the flagbearer of India’s growth, driven by outsourcing, Y2K needs, and global cost arbitrage.
Banking reforms, private sector entry, and telecom deregulation created the foundation for future sectoral shifts.
2. The 2000s – Infrastructure & Real Estate Wave
A decade of strong growth (8–9% GDP).
Infrastructure, real estate, and capital goods were the stars, benefiting from urbanization and foreign capital inflows.
Power and steel sectors also thrived on global commodity booms.
3. The 2010s – Consumer & Financials Lead
After the global financial crisis, India saw stable growth.
FMCG, pharmaceuticals, IT services, and private banks became market leaders.
Real estate and infra cooled due to high debt and policy bottlenecks.
Digital adoption fueled e-commerce and fintech’s rise.
4. The 2020s – Manufacturing, Green Energy & Digital India
Post-pandemic, India has entered a new rotation cycle.
Manufacturing (PLI schemes, “Make in India”), renewable energy, semiconductors, and defense are emerging as sunrise sectors.
BFSI (Banking, Financial Services, Insurance) continues as a backbone.
Tech is shifting from services to product-based ecosystems (AI, SaaS, fintech).
Key Growth Stories Driving India
1. Banking & Financial Services (BFSI)
BFSI has been the single most consistent performer over the last two decades.
Private sector banks like HDFC Bank, ICICI Bank, and Kotak Mahindra Bank revolutionized lending, retail banking, and digital financial services.
NBFCs and microfinance institutions expanded financial inclusion.
Insurance and asset management gained prominence as savings moved from gold/land to financial assets.
Future Drivers:
Digital lending.
Unified Payments Interface (UPI) and fintech partnerships.
Rising credit penetration in semi-urban and rural India.
2. Information Technology (IT) & Digital India
The IT sector turned India into a global outsourcing hub.
TCS, Infosys, Wipro, and HCL became world-class giants.
Now, the focus is shifting from low-cost outsourcing to high-value areas: AI, blockchain, cloud services, SaaS exports.
Future Drivers:
Artificial Intelligence adoption globally.
India as a global innovation hub.
Growth of domestic tech startups and unicorns.
3. Manufacturing & PLI Push
India wants to become a global manufacturing hub like China.
The Production Linked Incentive (PLI) scheme is attracting investments in electronics, semiconductors, EVs, and pharma.
Automobile exports, mobile phone production, and defense manufacturing are picking up.
Future Drivers:
“China+1” strategy of global supply chains.
EVs and battery storage.
Defense exports and indigenous production.
4. Renewable Energy & Sustainability
India has committed to net-zero by 2070.
Solar, wind, and green hydrogen are becoming sunrise industries.
Adani Green, Tata Power Renewables, and ReNew Power are expanding capacity rapidly.
Future Drivers:
Rising energy demand.
Policy incentives for clean energy.
Global investors’ push for ESG-compliant investments.
5. Healthcare & Pharmaceuticals
India is the “pharmacy of the world.”
Generic drug manufacturing and vaccine production are key strengths.
Medical tourism is growing, making India a healthcare destination.
Future Drivers:
Biotechnology and R&D investment.
Digital health and telemedicine.
Preventive healthcare and wellness sector.
6. Consumer Story – FMCG, Retail & E-Commerce
Rising middle class and urbanization continue to boost demand.
FMCG players like HUL, Nestle, and Dabur thrive on rural consumption.
E-commerce platforms like Flipkart, Amazon, and Reliance Retail are reshaping retail.
Future Drivers:
Tier-2 and Tier-3 consumption.
Digital marketplaces and ONDC.
Premiumization trends (from basic needs to aspirational products).
7. Infrastructure & Real Estate Revival
Post-2015 slowdown, the real estate sector is rebounding.
Affordable housing, commercial spaces, and warehousing (e-commerce logistics) are growing.
Smart cities and highway construction are boosting infra.
Future Drivers:
Urbanization wave.
REITs offering investment access.
Logistics demand from digital economy.
Case Studies of Sectoral Rotation in India
1. IT vs. Infrastructure (2000s)
In the early 2000s, IT was dominant.
Mid-2000s saw infra/real estate outperform IT as global liquidity boosted construction.
Post-2008, infra crashed, IT regained leadership.
2. Private Banks vs. PSU Banks (2010s)
PSU banks struggled with NPAs.
Private banks gained market share, becoming market leaders.
The sectoral rotation within BFSI favored private institutions.
3. Renewables vs. Traditional Energy (2020s)
Earlier, coal and oil companies dominated India’s energy story.
Now, renewables and green hydrogen are attracting huge investments, showing sectoral shift toward sustainability.

GIFT Nifty & Its Global Impact1. Introduction
In the dynamic world of global finance, financial instruments, and trading platforms play a crucial role in connecting economies, investors, and businesses. Among these, stock index futures have emerged as one of the most powerful vehicles for global investors seeking exposure to key economies.
One such instrument that has been gaining international attention is GIFT Nifty, the rebranded version of the Singapore-traded Nifty futures, now hosted at GIFT City (Gujarat International Finance Tec-City) in India. This shift is more than just a geographical move; it reflects India’s ambition to emerge as a leading global financial hub and the world’s growing interest in the Indian growth story.
This article takes a deep dive into the origin, structure, functioning, and global implications of GIFT Nifty, while analyzing how this move impacts India, foreign investors, and the wider global financial markets.
2. Understanding GIFT Nifty
2.1 What is GIFT Nifty?
GIFT Nifty refers to the futures contracts on the Nifty 50 index, now traded on the NSE International Exchange (NSE IX), based at GIFT City in Gandhinagar, Gujarat. Earlier, these contracts were traded on the Singapore Exchange (SGX) under the name “SGX Nifty.”
In July 2023, a historic shift occurred: all open interest and positions in SGX Nifty were migrated to NSE IX in India, giving rise to GIFT Nifty.
2.2 Why was the shift made?
The migration was the outcome of a 2018 agreement between NSE and SGX after disputes over licensing rights. India wanted to consolidate trading volumes within its jurisdiction and make GIFT City a hub for international investors.
Key reasons for the move:
To boost India’s onshore derivatives market.
To increase liquidity in GIFT City.
To give foreign investors direct access to Indian markets within a globally recognized framework.
2.3 Core features of GIFT Nifty
Trading Hours: Almost 21 hours a day, from 4:30 am to 2:00 am IST. This allows overlap with Asian, European, and U.S. trading sessions.
Contracts: Nifty 50 futures, Nifty Bank futures, Nifty Financial Services futures, and Nifty IT futures.
Currency: Settled in USD, making it easier for foreign investors.
Tax Benefits: Investors trading from GIFT City enjoy tax neutrality, similar to international jurisdictions.
3. GIFT City: India’s Financial Gateway
To fully appreciate the impact of GIFT Nifty, one must understand GIFT City, the ecosystem hosting it.
Concept: Launched by the Government of India, GIFT City is India’s first International Financial Services Centre (IFSC), designed to compete with hubs like Singapore, Hong Kong, and Dubai.
Offerings: It provides financial institutions with liberal regulations, tax benefits, and international-standard infrastructure.
Regulator: The International Financial Services Centres Authority (IFSCA) governs activities within GIFT City.
Vision: To make India a global capital of financial services, reducing reliance on foreign hubs.
GIFT Nifty is one of the flagship products driving international investor participation in GIFT City.
4. Why GIFT Nifty Matters
4.1 For India
Enhances India’s image as a credible financial market hub.
Boosts liquidity and market depth in domestic indices.
Keeps derivatives trading revenue within India.
Attracts global financial institutions to set up operations in GIFT City.
4.2 For Global Investors
Provides direct exposure to Indian equity markets without having to set up local accounts in India.
Extended trading hours enable hedging opportunities across global time zones.
Tax-neutral environment makes it cost-efficient compared to onshore trading.
4.3 For Global Markets
Adds to the integration of Indian markets with global capital flows.
Creates arbitrage opportunities between different time zones.
Makes India a larger part of the global derivatives ecosystem.
5. The Evolution from SGX Nifty to GIFT Nifty
5.1 SGX Nifty’s Popularity
For years, SGX Nifty futures in Singapore served as a proxy for Indian markets for global investors.
They helped international traders gauge market sentiment before Indian markets opened.
Huge foreign institutional participation made SGX Nifty a global benchmark.
5.2 Why India Pulled It Back
NSE wanted to control data licensing and fee revenues.
SGX Nifty volumes were massive, but India was losing out on revenue and liquidity.
Strengthening GIFT City required high-profile products — SGX Nifty was the perfect candidate.
5.3 The Transition
In July 2023, all positions were shifted from SGX to NSE IX seamlessly.
The migration symbolized a major win for India’s financial diplomacy.
6. Global Impact of GIFT Nifty
6.1 Strengthening India’s Position in Global Finance
India is the fifth-largest economy and one of the fastest-growing markets.
GIFT Nifty ensures India’s financial markets are directly accessible to global capital.
By retaining liquidity at home, India reduces dependence on offshore hubs.
6.2 Impact on Global Investors
Earlier, investors preferred Singapore due to its global reputation and neutrality.
Now, they must adapt to trading within India’s jurisdiction at GIFT City.
Long trading hours offer better alignment with global market events, making Indian exposure more convenient.
6.3 Impact on Singapore
Singapore lost a key product that attracted billions in trading volume.
However, it remains a strong financial hub with diversified offerings.
6.4 Impact on Indian Stock Market
With higher liquidity, Indian indices get better price discovery.
Domestic derivatives market becomes more competitive.
FII (Foreign Institutional Investor) flows become more transparent.
6.5 Arbitrage & Hedging
GIFT Nifty enables traders to hedge Indian positions across global hours.
It creates arbitrage opportunities between GIFT Nifty, Nifty futures on NSE India, and ETFs in global markets.
Conclusion
GIFT Nifty represents far more than a migration of futures contracts from Singapore to India. It embodies India’s aspiration to become a leading global financial hub, a move to consolidate liquidity within its borders, and an opportunity to integrate deeply with global capital flows.
For investors, GIFT Nifty provides long trading hours, tax neutrality, and direct access to the Indian growth story. For India, it strengthens financial sovereignty, boosts GIFT City’s credibility, and positions the country as a rising force in international finance.
Globally, it changes the way investors engage with India, creating new arbitrage and hedging opportunities while redistributing financial influence away from Singapore.
The global impact of GIFT Nifty will continue to unfold in the coming years. But one thing is certain: India has planted its flag firmly on the map of international finance, and GIFT Nifty is leading the charge.
