Investment Trading Setup - Growth & Wealth✅ Investment Trading Setup – “GARP + RSI” Model
🧠 Step 1: Fundamental Filter (GARP - Growth at Reasonable Price):-
Use screeners or research reports to filter stocks with:
• Revenue Growth: > 12% CAGR (3–5 yrs)
• PAT Growth: > 15% CAGR (3–5 yrs)
• ROCE: > 15%
• Debt/Equity: < 0.5 (or < 1 for capital-intensive sectors)
• PEG Ratio: < 1.5 (Growth at a Reasonable Price)
• Institutional Holding: Rising trend over last 2–3 quarters
✅ Example sectors: Specialty Chemicals, Private Banks, IT Product, Pharma APIs, Auto Ancillaries.
I strongly advise you all to go for most mid cap and some small cap segments as major growth is expected from this 2 verticals.
📈 Step 2: Technical Entry (Monthly + Weekly RSI Confirmation)
Once fundamentals are strong, check charts:
On Monthly chart:
• RSI(14) > 60 or crossing above 60
• Price breaking out of multi-month resistance or cup & handle/base
On Weekly chart:
• RSI(14) > 55 and trending higher
• Volume > 20-week average during breakout week
🔁 Optional Add-On: Use 200 DMA and 50 DMA Golden Cross for extra confirmation.
🎯 Entry & Risk Management
• Buy Zone: After breakout on weekly chart with confirmation of RSI
• Stop Loss: Below recent swing low (weekly or monthly)
• Pyramid/Add: On every 15–20% dip if fundamentals remain intact
🏁 Exit Rules
• Major fundamental deterioration (falling ROCE, rising debt)
• Technical breakdown below 200 DMA with heavy volume
• Stock becomes significantly overvalued (e.g. P/E > 3x sector average + RSI > 80)
🧾 Example Stocks That May Fit This Model (as of mid-2025)
✅ Mid Cap Growth Stocks (₹10,000 Cr to ₹50,000 Cr Market Cap)
Suprajit EngineeringAuto AncillariesHigh ROCE, consistent profit growth, global exportsKPI Green EnergyRenewable EnergyStrong revenue CAGR, solar EPC + IPP modelKEI IndustriesCables/WiresScalable, infra theme, strong profit marginsSona BLW PrecisionEV & Auto TechEV-ready, global OEM exposureJ.B. ChemicalsPharmaConsistent earnings, margin expansion, clean balance sheetNarayana HrudayalayaHospitals/HealthcareAsset-light model, expanding RoCE, high promoter skinSansera EngineeringAuto EngineeringDiversified clientele, improving marginsPolycab IndiaWires & CablesStrong infra push, leader in B2C wire segmentTriveni TurbineEngineering/Clean TechHigh margin niche business, export growtheMudhra Ltd.IT/Digital SignatureFast growth, unique niche (cybersecurity theme)
🚀 Small Cap Growth Stocks (< ₹10,000 Cr Market Cap)
Ksolves IndiaIT Services/NicheDebt-free, high RoE, software exportsNGL Fine ChemPharma APIsHigh margins, good growth visibilityGensol EngineeringSolar EPCEV + Solar + Infra theme, fast-growingShivalik BimetalSpecialty AlloysHigh-tech materials, strong RoEHLE GlascoatSpecialty Chem/EquipLeader in glass-lined equipment, capex doneIndia PesticidesAgrochemClean books, exports-led growthGNA AxlesAuto ComponentsPickup in CV/Tractor cycle, strong balance sheetLa Opala RGConsumer DurablesHigh margins, niche player in opalwareDynacons SystemsIT Infra ServicesNiche contracts, high profitabilityZen TechnologiesDefence TechDefence theme, order book visibility
📊 Suggested Metrics You Can Track:
• Revenue CAGR (3Y): >15%
• PAT CAGR (3Y): >20%
• ROCE: >18%
• D/E Ratio: <0.5
• Promoter Holding: >50% (or rising trend)
• Cash Flows: Positive from operations
Note - I have provided you all with my best 4 setups used by big firm and I can assure you they are working for us for the past 18 years.
Check my post in the profile -
Setup provided were:-
Positional Trading Setup
Swing Trading Setup
Stock Options Buying Setup
And Investment Trading Setup above.
I wish you all the best and am sure and confident that you will reflect and ponder on how simple techniques work.
At Last, KISS - Keep it Simple and Systematic.
Happy Trading!
Faraaz T
Sr. Ex. Financial and Equity Analyst
Stockholm Securities
Community ideas
High-Probability Scalping Techniques🔍 What Is Scalping?
Scalping is a fast-paced intraday trading style where traders aim to take multiple small profits throughout the trading day. Instead of holding trades for hours or days, scalpers may be in and out of trades within minutes or even seconds.
Scalping is all about:
Quick entries and exits
High accuracy
Controlled risk
Small but frequent gains
The core idea? “Many small wins add up to a big win.”
Scalping works best in liquid markets, like Nifty, Bank Nifty, large-cap stocks, or high-volume futures and options.
💡 Why Do Traders Choose Scalping?
Scalping is perfect for traders who:
Have limited capital but want to grow it steadily
Prefer not to hold positions overnight (no gap-up/gap-down risk)
Love short-term action and decision-making
Want to trade professionally in 1-2 hours daily
Also, scalping can reduce your exposure to market news, global events, or overnight uncertainty.
But remember: scalping isn’t easy. It’s a skill. You need discipline, speed, and a proven strategy.
🎯 Key Characteristics of High-Probability Scalping
To make scalping successful, your strategy must include:
Factor Requirement
Speed Fast entries and exits with minimal slippage
Liquidity Trade only stocks/indexes with high volume
Precision Narrow stop losses, clear targets
Discipline No emotions, stick to plan
Risk Management Small risk per trade, compounding over time
🧠 Scalper's Mindset: Think Like a Sniper, Not a Machine Gunner
You’re not shooting randomly. You’re waiting patiently for high-probability opportunities where the odds are clearly in your favor.
Scalping is not about trading more—it’s about trading better.
🔧 Tools Every Scalper Needs
Before we dive into strategies, here’s what you must have in place:
Fast internet connection
Live market depth / Level 2 data
5-min, 1-min, and tick charts
Hotkeys for fast order placement
Broker with low brokerage per trade
Scalping involves dozens of trades per session, so costs matter!
🛠️ High-Probability Scalping Techniques (Explained in Human Language)
Let’s now explore some proven techniques that many experienced scalpers use.
🔹 1. VWAP Bounce Strategy
VWAP = Volume Weighted Average Price. It tells you the average price where most volume happened during the day.
📌 Concept:
In a trending market, price often bounces off VWAP before continuing the trend.
You trade that bounce.
✅ Rules:
Identify trend (price above VWAP = uptrend, below = downtrend)
Wait for a pullback to VWAP
Look for confirmation (like a bullish candle in uptrend)
Enter trade with tight SL below VWAP
Target = 0.5% to 1% move
🔍 Chart Timeframe:
1-minute or 5-minute candles
Ideal for: Nifty/Bank Nifty, Reliance, HDFC, SBIN, INFY
🔹 2. Opening Range Breakout (ORB)
This is a classic scalping setup used in the first 15–30 minutes of market open.
📌 Concept:
First 15-min range defines the initial battle between buyers/sellers.
Breakout from this range = strong momentum.
✅ Rules:
Mark high and low of 15-min candle from 9:15 to 9:30
Buy when price breaks above the high + volume rises
Sell when price breaks below the low + volume rises
SL = below/above opposite side of the range
Target = 1:1 or trail profit
💡 Tip:
Works best on trending news days or earnings release days.
🔹 3. Scalping Breakouts with Volume Confirmation
A breakout is only real if volume supports it. Otherwise, it’s a trap.
✅ Rules:
Use 5-minute chart
Identify consolidation (flat price action with narrow range)
Watch for breakout with spike in volume
Enter with SL just outside the range
Exit with a 1:1 or 1.5:1 risk-reward
🎯 Indicators:
Bollinger Bands tightening
Volume histogram
Price breaking upper/lower band
🔹 4. RSI Divergence Scalping
You can scalp reversal points using RSI divergence.
✅ Rules:
Use 5-min or 3-min chart
RSI near 70 or 30 signals overbought or oversold
If price makes higher high but RSI makes lower high → Bearish divergence
If price makes lower low but RSI makes higher low → Bullish divergence
Enter for quick reversal scalp
SL = recent swing high/low
Target = VWAP or recent pivot
🔹 5. News-Based Scalping
Scalping on earnings releases, news events, or market-moving headlines can be profitable—but risky.
✅ Approach:
Stick to high-volume large-cap stocks
Avoid holding more than a few minutes
Use Level 2 order book to watch supply/demand shifts
Trade the initial burst, exit quickly
📈 Ideal Indicators for Scalping
VWAP
RSI (5 or 14-period)
Bollinger Bands
EMA crossover (e.g., 8 EMA vs 21 EMA)
MACD (fast settings for short-term signals)
But remember: indicators are tools, not guarantees. Always combine them with price action and volume.
📉 Risk Management: The Scalper’s Shield
This part matters even more than the strategy itself.
Rule Explanation
Risk only 0.5% to 1% of capital per trade Protects you from wipeout on a bad day
Always have a stop-loss No SL = no survival
Don’t average losing trades You’re scalping, not investing
Exit on SL or target—no emotion Don’t hope, don’t pray
Track your win-rate Aim for 60%+ with 1:1 risk-reward
🧮 Sample Scalping Day Plan
Time Action
9:15–9:30 AM Watch first 15-min candle for ORB
9:30–11:00 AM Take 2-3 high-quality trades (VWAP bounce, RSI scalp)
11:00–2:00 PM Avoid choppy markets or only scalp consolidations
2:00–3:00 PM Look for afternoon breakouts
3:00–3:20 PM Avoid taking fresh trades, exit open ones
🔁 Scalping Checklist
Before you place any trade, ask yourself:
✅ Is the setup clear and backed by volume?
✅ Am I trading with the trend or against it?
✅ Is my SL defined and within risk limit?
✅ Am I emotionally calm and focused?
✅ Is this a high-probability or random trade?
📊 Example of a High-Probability Scalping Trade
Stock: Reliance
Chart: 1-min
Setup: VWAP bounce + bullish engulfing candle
Entry: ₹2,950
Stop-Loss: ₹2,944
Target: ₹2,958
Result: Profit of ₹8 per share in 3 minutes
This may look small—but scalpers do 5–10 such trades a day, scaling with quantity.
🚨 Common Mistakes to Avoid
❌ Overtrading (more is not better)
❌ No plan or random entries
❌ Chasing trades late
❌ Holding scalps like swing trades
❌ Trading during news without preparation
❌ Ignoring transaction costs
🧾 Final Words: Is Scalping Right for You?
Scalping is not for everyone. It requires:
High focus and speed
Strong discipline
Quick decision-making
Excellent risk control
But if you develop the skill, it can provide:
Daily consistency
Limited overnight risk
Quick compounding
Full control over trades
✅ Start small.
✅ Practice on paper or low quantity.
✅ Use one strategy, track results, then scale up.
AI & Algo-Based Automated Trading🤖 What Is Algorithmic Trading?
Algorithmic Trading, or simply Algo Trading, is when computer programs automatically place buy/sell orders based on pre-defined rules, without human intervention.
Imagine giving your laptop a checklist like:
“If Nifty goes above 22,500 AND RSI is above 60 AND volume is high, then BUY.”
The computer will monitor the market 24x7—and the moment this condition is met, it will execute the trade automatically in milliseconds.
This kind of rule-based, automated trading using programs is Algo Trading.
🧠 What Is AI in Trading?
AI-based trading goes a step further.
Unlike basic algos that follow fixed rules, AI can learn, adapt, and improve with experience—just like humans.
Using technologies like:
Machine Learning (ML)
Natural Language Processing (NLP)
Neural Networks
Predictive Analytics
AI systems analyze massive amounts of data, including charts, volumes, news, tweets, macro events, and more—and predict future price movements or generate smart trading signals.
So while Algo Trading is like giving instructions to a robot, AI Trading is like training a robot to think like a trader
How Does Algo Trading Work?
Algo trading usually follows a 4-step cycle:
Strategy Design:
You create a trading rule, e.g. “Buy if 5 EMA crosses 20 EMA”.
Execution:
Set it up with your broker or software to trade automatically.
Monitoring:
Keep an eye to adjust for market conditions or technical issues.
Common Algo Strategies:
Moving average crossovers
Mean reversion
Arbitrage (buy low, sell high across markets)
Trend following
Momentum trading
Scalping (multiple small profits in quick trades)
🔮 How Does AI-Based Trading Work?
AI-based systems do all the above PLUS:
Analyze news sentiment (good or bad for a stock)
Understand social media buzz (like Twitter or Reddit)
Learn from historical chart patterns and price movements
Adjust strategies based on outcomes (self-improvement)
Example:
An AI bot could learn that when crude oil prices rise + VIX increases + USDINR weakens → certain oil & gas stocks tend to rally → it may buy those stocks automatically.
This is smart prediction, not just following a rule.
🌐 Who Uses AI & Algo Trading?
✅ Institutional Investors:
Mutual Funds
FIIs (Foreign Institutional Investors)
Insurance companies
Banks and proprietary trading desks
✅ Hedge Funds:
Quant funds like Renaissance Technologies, Two Sigma, Citadel use AI at scale
💰 Benefits of AI & Algo Trading
Speed – Trades happen in milliseconds. You can’t beat that manually.
Discipline – No emotional trading, no greed or fear.
Scalability – Run multiple strategies on multiple stocks at once.
Precision – Orders are accurate, slippages can be minimized.
⚠️ Risks & Challenges
It’s not all sunshine and profits. Here are some things to be cautious about:
Risk Description
Overfitting Your model may work in the past but fail in live market.
Black Swans Unforeseen events can destroy even smart systems.
Data Issues Bad data = bad trades. Accuracy matters.
Connectivity/Tech If system crashes mid-trade, results can be brutal.
Emotional Blindness AI can't feel panic—good for rules, bad for crisis.
🧠 Real World Use Cases
✅ Example 1: Intraday Scalping Bot
Scans top 100 NSE stocks
Enters trades on VWAP bounces with strict SL
Exits with 0.5-1% target
Runs 50 trades/day across stocks
✅ Example 2: AI News Sentiment Strategy
Uses NLP to scan headlines, tweets, earnings
Classifies news into “Positive”, “Negative”, or “Neutral”
Trades in the direction of sentiment before retail even reacts
✅ Example 3: Pair Trading Algo
Compares movement of two related stocks (e.g. HDFC Bank vs ICICI Bank)
If one deviates too far from the other, it creates a hedge
Buy one, sell the other—profit from convergence
🔁 The Future: AI + Algo + Quantum + Blockchain?
The future of markets is combining:
AI (Decision Making)
Algo (Execution)
Blockchain (Transparency)
Quantum Computing (Speed & Accuracy)
Large financial institutions are already hiring AI scientists and coders instead of traditional analysts. Markets are evolving—and so should we.
🧾 Conclusion
AI & Algo Trading is the future—and the present. It’s fast, smart, and scalable.
Big institutions are already using them to make crores from micro-movements. For retail traders, this is an opportunity to level up, automate emotions out, and trade systematically
Option Selling Strategies for Monthly Income📘 What is Option Selling?
In options trading, you have two parties:
Option Buyer – Pays premium to buy the right (but not obligation) to buy/sell a stock or index
Option Seller (Writer) – Receives that premium, but takes on the obligation to deliver, if the buyer exercises
📌 So, in option selling:
You earn premium upfront
Your profit comes if the option expires worthless
Time is your friend (theta decay helps you)
The odds of success are higher, but risk is theoretically unlimited (if not managed well)
🔧 Core Concepts You Must Know Before Selling Options
✅ 1. Time Decay (Theta)
Option prices fall as expiry nears (especially if OTM)
Sellers benefit because buyers lose value daily
✅ 2. Implied Volatility (IV)
Higher IV = Higher Premiums = Better for sellers
Sell when IV is high, buy when IV is low
✅ 3. Margin Requirement
You need sufficient funds (or collateral) to sell options
Brokers block margin depending on your strategy
✅ 4. Strike Price Selection
Selling options far away from current price reduces risk
Choose strikes based on support/resistance or option chain OI
📦 Top 4 Option Selling Strategies for Monthly Income
Let’s look at the most trusted, beginner-to-pro level strategies used for monthly income.
🔹 1. Covered Call – Best for Stock Investors
You own a stock and you sell a Call Option against it.
Generates income from stocks you already hold
You earn premium every month
If stock stays below strike → you keep stock + premium
If stock crosses strike → your stock may get sold (with profit)
Example:
You hold 1 lot of TCS (300 shares) at ₹3,600
Sell 3700CE for ₹40 premium
If TCS stays below ₹3700, you keep ₹12,000 premium (₹40 × 300)
✅ Low risk
✅ Good for long-term investors
🚫 Limited upside on stock
🔹 2. Cash-Secured Put (CSP) – Get Paid to Buy Stocks
You sell a Put Option for a stock you’re willing to buy at a lower price.
You collect premium
If stock falls below strike → You must buy it
You effectively get stock at discount
Example:
Sell 3600PE in TCS and collect ₹50 premium
If TCS closes above ₹3600, you keep the ₹15,000 premium
If TCS drops below ₹3600, you get to buy it—but at an effective price of ₹3550
✅ Ideal for long-term investors
✅ Safer than naked put selling
🚫 Requires full cash or margin
🔹 3. Short Strangle – Good for Range-Bound Market
You sell one Out-of-the-Money Call and one OTM Put.
Profit if the stock/index remains in a range
You earn premium from both sides
Risk if price moves too much either way
Example (Nifty at 24,000):
Sell 24200CE at ₹100 and 23800PE at ₹120
Total premium = ₹220 (₹11,000 per lot)
Max profit = ₹11,000 if Nifty stays between 23800 and 24200 till expiry
✅ High premium potential
🚫 Unlimited risk if market breaks range
✅ Can be hedged with far OTM buys
🔹 4. Iron Condor – Limited Risk, Limited Reward
This is an advanced version of strangle with protection.
Sell 1 OTM Call + 1 OTM Put
Buy 1 further OTM Call + 1 further OTM Put
You form a “box” where profit is limited, but losses are capped
Example (Nifty at 24000):
Sell 24200CE (₹100) + 23800PE (₹120)
Buy 24400CE (₹30) + 23600PE (₹40)
Total premium = ₹220 – ₹70 = ₹150
Max profit = ₹150 × 50 = ₹7,500
Max loss = ₹50 (difference in strikes – net credit)
✅ Great for peace of mind
✅ No unlimited risk
🚫 Less profit than naked strangle
📅 How to Use These Strategies for Monthly Income
🔄 Repeat Monthly:
Choose 1 or 2 strategies
Select stocks or index with high liquidity
Sell options 20–30 days before expiry
Exit before expiry (if needed) or let decay work
📌 Ideal Instruments:
Nifty / Bank Nifty
Liquid stocks: Reliance, HDFC Bank, Infosys, ICICI, TCS
🧠 Smart Practices:
Trade with capital you can afford to lock for a few weeks
Don’t sell options blindly – check news, IV, support/resistance
Use alerts or trailing stops
⚠️ Risks and How to Manage Them
Risk How to Handle
Unlimited Loss Use hedging (e.g., iron condor) or stop-losses
Sudden Market Moves Avoid during events (budget, elections, Fed)
Low Premium Don't sell too close to expiry with low reward
Margin Call Keep extra buffer; monitor exposure
Overtrading Stick to 1–2 good trades per expiry
✅ Final Thoughts
Option selling is not a get-rich-quick tool—but it’s a powerful way to generate stable income month after month, when done with patience, logic, and discipline.
You don’t need to be a genius—just:
Understand how premiums behave
Focus on low-risk, high-probability trades
Use hedges and stop-losses
Stick to tested rules
Track your performance and learn from mistakes
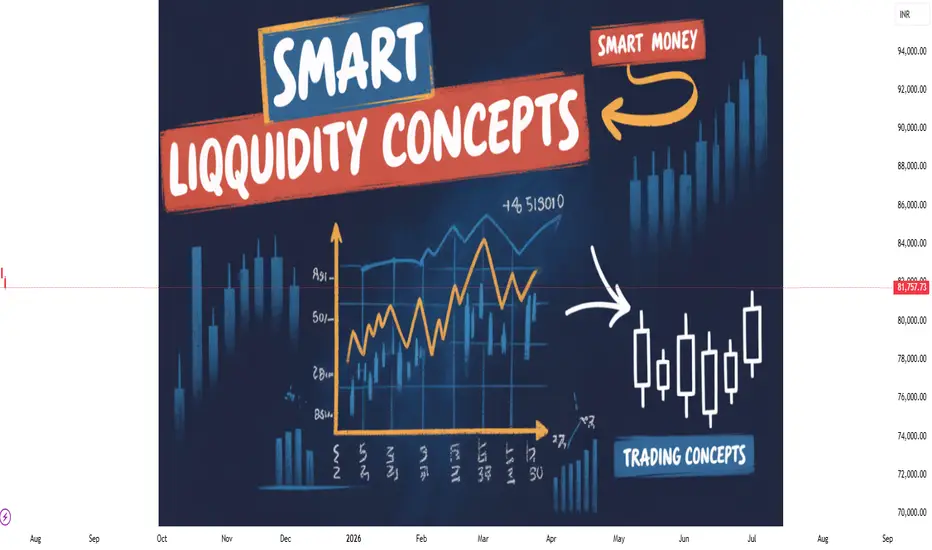
Liquidity Concepts & Smart Money Trading💧 What is Liquidity in the Stock Market?
In simple terms, liquidity means how easily you can buy or sell a stock (or any asset) without affecting its price too much.
📌 Imagine This:
You're at a crowded market and want to sell 10 bags of rice. If there are many buyers, you’ll sell quickly at your price. That’s high liquidity.
But if only 1 buyer is there, you’ll need to lower the price—or wait. That’s low liquidity.
✅ High Liquidity Stocks:
Easy to enter and exit
Tight bid-ask spread
High volume and interest
Examples: Reliance, HDFC Bank, TCS, Infosys
🚫 Low Liquidity Stocks:
Wide spread
May not execute large orders fast
Often in smallcap or SME segments
Prone to manipulation
So, as a trader or investor, liquidity matters because it affects:
Speed of your trades
Slippage (difference between expected and executed price)
Risk of getting trapped in illiquid counters
🧠 Who is “Smart Money”?
“Smart Money” refers to the big, institutional players who move the market silently.
🧱 Types of Smart Money:
FIIs (Foreign Institutional Investors)
DIIs (Domestic Institutional Investors)
Mutual Funds, Pension Funds
Hedge Funds
Prop Desks (Proprietary traders of large brokers or banks)
These players do not trade like retail traders. They have:
Huge capital
Access to better research
Advanced tools and algorithms
Patience to accumulate or distribute over days/weeks
The power to create or absorb liquidity
They don’t chase stocks. They build positions strategically.
🎯 The Relationship Between Liquidity & Smart Money
This is where it gets interesting.
Smart Money doesn’t want you to know what they’re doing. So they operate in stealth mode, using liquidity zones to enter/exit.
Let’s break this down in real terms.
💡 Real Example: How Smart Money Uses Liquidity
Scenario: Let’s say a mutual fund wants to buy ₹500 crore worth of a midcap stock.
If they suddenly place a large buy order, the price will shoot up.
So what do they do?
They wait for panic selling, like during news, results, or false breakdowns.
They create liquidity pools—zones where many stop-losses are triggered.
Retail traders sell in panic, creating supply.
Smart money absorbs quietly.
This is called accumulation.
Similarly, when they want to sell, they:
Push price up with breakout candles
Attract retail buyers chasing the move
Slowly distribute their holdings
Leave small players trapped at the top
🔄 Concepts You Must Know
1. Accumulation Zone
Where smart money buys silently
Flat or range-bound price action
Volume slowly rising
No major breakout yet
2. Distribution Zone
Where smart money sells quietly
Price looks strong, but momentum slows
Volumes stay high
Sudden rejections from resistance
3. Liquidity Grab / Stop Hunt
A deliberate move to trigger stop-losses and create liquidity
Often seen before real trend begins
Can be traps for retail traders
Example: Price breaks below support, then sharply reverses
📊 How to Track Liquidity & Smart Money Moves
Here are tools and techniques used by traders:
📌 1. Volume Profile
Shows where most trading has happened
High Volume Nodes (HVN): Liquidity zones
Low Volume Nodes (LVN): Price moves quickly
Watch for consolidation near HVNs—could be accumulation/distribution
📌 2. Order Book / Market Depth
For intraday traders
Shows how many buy/sell orders exist at various levels
Spikes in orders may signal liquidity traps or fake pressure
📌 3. Open Interest (OI) in Options
Rising OI + flat price = buildup
Long unwinding or short covering signals smart money behavior
📌 4. FII/DII Data
Track daily net buy/sell figures
Sectoral trends from mutual fund holdings
FII selling = market weakness, especially in large caps
📌 5. Wyckoff Method (Optional but powerful)
Focuses on market cycles
Accumulation → Markup → Distribution → Markdown
Helps understand the intent behind price action
🔥 Common Smart Money Setups
✅ 1. False Breakout Trap
Price breaks above resistance
Retail traders enter long
Smart money sells into strength
Price reverses
How to Spot:
Check volume
See if candle closes above or within resistance
Confirm with next bar’s reaction
✅ 2. Stop-Loss Hunting
Price dips below support
Retail SLs get hit
Price reverses sharply with strong volume
How to Spot:
Sudden wick below major swing low
Sharp V-shaped recovery
Volume spike + reversal candle
✅ 3. Liquidity Sweep Before Rally
Sideways phase ends with a big red candle
Then reversal and trend begins
This is smart money loading positions
🛠️ How to Use This in Trading (With Practical Tips)
✅ For Swing Traders:
Identify consolidation zones with rising volume
Wait for breakout or breakdown with volume
Add volume profile to spot high-activity zones
Check if OI is building around a strike in options
✅ For Intraday Traders:
Track OI buildup + price action around round numbers
Use Market Profile or VWAP to understand liquidity zones
Watch for traps near open or just before close
✅ For Investors:
Watch mutual fund buying sectors
Use MF/ETF monthly reports for accumulation patterns
Avoid chasing rallies—enter during base formation
✅ Final Thoughts
Most retail traders lose money not because their analysis is wrong—but because they don’t understand the rules smart money plays by.
In 2025’s market, where FIIs, algorithms, and institutions dominate, understanding liquidity and smart money behavior is not optional—it’s essential.
You don’t need millions to trade like smart money. You just need the right mindset, tools, and the patience to wait for clean setups.
📌 Remember: “Volume reveals the truth. Price tells the story. Liquidity is the language smart money speaks.
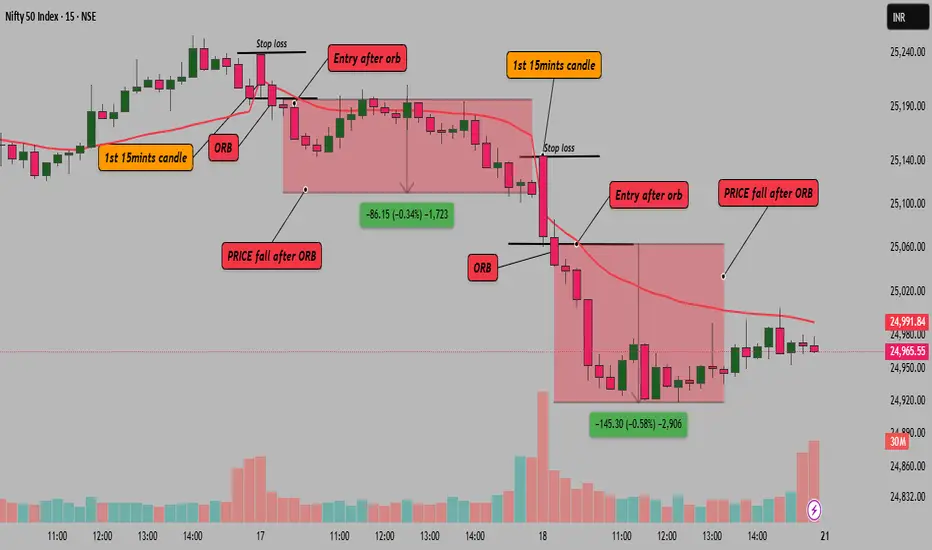
Opening Range Breakdown – Intraday Bears’ Favorite Setup!Hello Traders!
Today, let’s explore one of the most reliable setups for intraday traders – the Opening Range Breakdown (ORB) . This strategy is widely used by professional traders to catch early downside momentum when the market shows weakness right after opening. If executed correctly, it offers quick profits and tight risk management. Let’s break down how it works and how to trade it with confidence.
What is Opening Range Breakdown (ORB)?
The ORB strategy focuses on the first 15 to 30 minutes of market open . The idea is to mark the high and low of this initial range and look for a breakdown below the low – which signals bearish pressure. This setup works best on volatile days or when there’s negative sentiment in global cues.
Mark the Opening Range:
Track the high and low of the first 15 or 30 minutes of the market open.
Wait for a Breakdown Candle:
Look for a strong bearish candle closing below the opening range low with rising volume.
Enter on Confirmation:
Take a short entry just below the breakdown candle with stop-loss above the opening range high.
Target Previous Day’s Support or VWAP:
Your exit target could be based on previous day’s support, VWAP, or risk-reward ratio like 1:2.
Volume Confirmation is Key:
Avoid low volume breakdowns. Strong volume is what separates real breakdowns from fake-outs.
Ideal Conditions for ORB
Gap Down Open or Weak Global Cues – ORB works well when sentiment is already negative.
High Beta Stocks or Indices like BankNifty – These respond sharply to breakdowns.
No Major Support Below the Breakdown Level – Clean charts increase trade reliability.
Risk Management Tip
Keep your position size small and risk predefined. Don’t chase entries. Let the candle confirm the breakdown and only then execute.
Conclusion:
ORB is a favourite among experienced traders due to its simplicity and effectiveness. If you’re an intraday bear looking for high-probability setups, Opening Range Breakdown is something you must master.
Have you used ORB before? Let me know your experience or results in the comments!
Learn the Nuances of Trading : How to draw lines on chart Let's Learn the Trading Together... I have started a new series of trading called #LNT (Learn the Nuances of Trading) where you are going to learn All the things which is going to help you to be a good trader..
Learning in Video : In This Video I have teach you how to draw Lines in different way ..
It is going to very helpful if you participate the challenges so that we can build a very good trading community..
It is my attempt to teach you the trading.. Hope you will like.
Disclaimer : It is my personal view as a trader and for educational purpose only. Equity market involves risk .
Please consult your financial adviser before taking any decision.

Option Trading✅ Why Trade Options?
📊 Profit in All Market Conditions — Whether markets go up, down, or stay flat, options allow you to build strategies for every scenario.
💰 Limited Risk, High Reward — With proper strategies like buying options, you can limit your risk to the premium paid but enjoy unlimited upside.
🔒 Hedge Existing Investments — Investors use options to protect their portfolios from market crashes.
🧩 Flexibility — Options allow for creative trade setups such as income generation, speculation, and hedging.
📉 Leverage — Control larger positions with less capital.
✅ Key Concepts in Option Trading
1. Call Option (Buy Side):
Gives the buyer the right to buy an asset at a certain price before expiry.
✅ Call Buyer profits when price goes up.
✅ Call Seller (Writer) profits when price stays flat or falls.
2. Put Option (Sell Side):
Gives the buyer the right to sell an asset at a certain price before expiry.
✅ Put Buyer profits when price goes down.
✅ Put Seller profits when price stays flat or rises.
✅ Important Terms to Know
Strike Price – The fixed price at which you can buy or sell the underlying asset.
Premium – The cost paid by the option buyer to the seller for the right to exercise.
Expiry Date – The date when the option contract becomes void.
In-the-Money (ITM) – Option has intrinsic value (profitable if exercised).
Out-of-the-Money (OTM) – Option has no intrinsic value (unprofitable if exercised).
At-the-Money (ATM) – Option strike is closest to the current market price.
✅ Popular Option Trading Strategies
1. Directional Strategies:
Long Call – Profit from rising markets.
Long Put – Profit from falling markets.
2. Non-Directional Strategies:
Iron Condor – Profit from range-bound markets.
Straddle/Strangle – Profit from big movements in either direction.
Butterfly Spread – Low-cost strategy for limited movement with high reward potential.
3. Income Strategies:
Covered Call – Selling calls on owned stocks for premium income.
Cash-Secured Put – Selling puts on stocks you want to own at a lower price.
✅ Advanced Concepts for Institutional-Level Trading
📌 Implied Volatility (IV): Measures expected future volatility; options become expensive when IV rises.
📌 Theta Decay: Time decay that eats away premium, favoring option sellers.
📌 Delta, Gamma, Vega, Theta (Greeks): Quantify how option prices react to changes in market conditions.
📌 Hedging with Options: Professionals hedge large portfolios using protective puts or collars.
📌 Liquidity and Open Interest: High open interest means better liquidity, tighter spreads, and easier trade execution.
✅ Why Institutions Prefer Option Trading
Institutions, banks, and hedge funds use options to:
Hedge large stock portfolios.
Generate steady returns through premium collection.
Manage volatility exposures.
Create complex structured products.
They use strategic adjustments, rollovers, and risk-defined positions to control large portfolios with precision.
✅ Common Mistakes to Avoid in Options
❌ Trading without understanding volatility impact.
❌ Ignoring time decay when buying options.
❌ Going all-in on OTM options with low probabilities.
❌ Not managing trades near expiry.
❌ Trading without considering the Greeks.
✅ Final Thoughts
Option Trading is not gambling — it’s a professional tool for risk management, income generation, and speculation. When used correctly, options offer high flexibility, controlled risk, and diverse profit opportunities. However, success requires education, discipline, and strategy.
Learn the true power of Option Trading, master market behavior, and you will have one of the most versatile weapons in your financial toolkit

Divergence Secrets✅ What is Divergence?
Divergence occurs when price action and an indicator (usually a momentum oscillator) move in opposite directions. This signals a disconnection between price and momentum, often happening before significant reversals.
Most Common Indicators Used:
RSI (Relative Strength Index)
MACD (Moving Average Convergence Divergence)
Stochastic Oscillator
CCI (Commodity Channel Index)
✅ Types of Divergence
1. Regular Divergence (Classic Divergence)
Bullish Divergence: Price makes lower lows, but the indicator makes higher lows → Suggests potential upward reversal.
Bearish Divergence: Price makes higher highs, but the indicator makes lower highs → Suggests potential downward reversal.
📌 Use Case: Best applied during downtrends (bullish divergence) or uptrends (bearish divergence) to catch reversals.
2. Hidden Divergence (The Professional’s Favorite)
Bullish Hidden Divergence: Price makes higher lows, but indicator makes lower lows → Signals trend continuation upwards.
Bearish Hidden Divergence: Price makes lower highs, but indicator makes higher highs → Signals trend continuation downwards.
📌 Use Case: Hidden divergence is used to confirm trend continuation after pullbacks, ideal for trend traders.
3. Exaggerated (Extended) Divergence
Price forms equal highs/lows, but the indicator shows higher lows/lower highs → Signals momentum build-up for reversal.
📌 Use Case: Seen at range breakouts or market tops/bottoms.
✅ Why Divergence Works (Institutional View)
Liquidity Manipulation: Institutions push price to make new highs/lows to grab liquidity, but momentum slows because real volume decreases.
Momentum Imbalance: Even as price extends, internal market strength weakens, revealed through divergence.
Smart Money Accumulation/Distribution: Divergence often appears when institutions quietly build or offload positions, creating momentum shifts.
✅ Advanced Divergence Trading Secrets
🔥 Secret #1: Multi-Timeframe Divergence
Always check divergence on higher timeframes (H4, Daily), then execute entries on lower timeframes (M15, H1).
A daily divergence holds more power than M15 divergence.
🔥 Secret #2: Confluence with Support/Resistance or Order Blocks
Divergence is strongest when it happens at a key structure level (support, resistance, order block, or imbalance zone).
Don’t trade divergence alone — combine it with price reaction at major zones.
🔥 Secret #3: Wait for Structure Break Confirmation
After divergence, wait for Break of Structure (BOS) or Change of Character (CHoCH) to confirm reversal.
This filters out many false divergence signals.
🔥 Secret #4: Volume Confirmation
Confirm divergence with volume drop or volume spike reversal.
Divergence with low participation increases reversal probability.
✅ Pro Divergence Entry Method
✅ Spot Divergence at key levels.
✅ Wait for candlestick confirmation (engulfing candle, pin bar, inside bar).
✅ Look for Break of Minor Structure.
✅ Enter on retest of BOS/CHoCH zone or order block.
✅ Stop loss below swing low/high, target next liquidity pool or imbalance zone.
✅ Common Mistakes to Avoid
❌ Trading divergence without context (e.g., countering a strong trend blindly).
❌ Ignoring higher timeframe trend direction.
❌ Entering without confirmation candle or structure break.
❌ Using lagging indicators without understanding price action.
✅ Final Thoughts
Divergence is a leading indicator, but it must be combined with market structure, key levels, and confirmation price action. Professionals use divergence as a warning sign, not an instant entry trigger. By mastering divergence, you can predict market exhaustion, capture high-reward reversals, and avoid common retail traps.
Divergence is one of the hidden secrets of market timing — master it, and your trading accuracy will improve dramatically

Support and ResistenceWhat is Support?
Support refers to a price level where a downtrend tends to pause or reverse due to increased buying interest. When price drops to a support level, traders and investors see it as a “discounted” price, which attracts buying activity. This buying demand causes the downtrend to slow down or reverse.
Key Points About Support:
It acts as a floor in the market.
Support levels are created when buyers are willing to purchase at a certain price level.
The more times price touches a support level and bounces back, the stronger the support becomes.
Once broken, support can become resistance, meaning that if the price breaks below support, it may face difficulty moving back up past that level.
What is Resistance?
Resistance refers to a price level where an uptrend tends to pause or reverse due to increased selling pressure. When price rises to a resistance level, traders see it as an “expensive” price and tend to sell, causing the price to stall or drop.
Key Points About Resistance:
It acts as a ceiling in the market.
Resistance levels are formed when sellers dominate and prevent the price from moving higher.
The more times price touches resistance and fails to break through, the stronger the resistance is.
If price breaks above resistance, it can become support, known as a support-resistance flip.
Why Support and Resistance are Important
✅ Identifies High-Probability Trade Zones – Helps you spot where to enter and exit trades.
✅ Improves Risk Management – Lets you place stop-loss orders around logical areas.
✅ Confirms Market Direction – Breakouts and rejections from these zones signal potential trend continuations or reversals.
✅ Works Across All Timeframes – Support and resistance can be applied to intraday trading, swing trading, and long-term investing.
Types of Support and Resistance
🔹 Horizontal Levels
Flat, horizontal price areas where the market reverses multiple times. This is the simplest and most common form.
🔹 Dynamic Support and Resistance
Levels that change with price movement, usually identified using moving averages like the 50-day or 200-day MA.
🔹 Trendlines
Diagonal support and resistance lines that connect higher lows in an uptrend or lower highs in a downtrend.
🔹 Zones Instead of Exact Lines
Professional traders focus on zones, not exact price points, because the market often reacts within a range.
How Professionals Use Support and Resistance
Institutions use these levels to accumulate positions quietly.
Smart traders wait for confirmation (candlestick patterns, volume increase) before entering trades.
Breakouts of these levels often lead to big moves because many stop-loss orders are triggered, creating momentum.
False breakouts or liquidity grabs are used by big players to trap retail traders before reversing the market.
Final Thoughts
Understanding support and resistance is fundamental to becoming a successful trader. It helps you anticipate market behavior, manage risk, and trade with confidence. Whether you are a beginner or an experienced trader, continuously refining your ability to identify and trade these key levels will improve your consistency and profitability.
Support and resistance are not just lines on a chart — they are the battle zones where market decisions are made. Master them, and you will master the market.

Support and Resistence Part-2✅ The True Meaning of Support and Resistance
At the core, support and resistance levels are psychological price areas where supply and demand dynamics shift. However, in institutional trading, these levels are engineered by large players to trigger retail reactions — such as false breakouts, stop hunts, and liquidity grabs.
Institutions use these levels to:
Accumulate large positions without moving the market.
Manipulate price to create breakout traps.
Trigger liquidity pools where retail stop-losses and pending orders are stacked.
✅ Types of Advanced Support and Resistance
1. Liquidity-Based Zones
Institutions seek liquidity to fill their large orders. They target zones where retail traders:
Place stop losses.
Have pending buy/sell orders.
Expect breakout continuations.
These zones are rarely clean horizontal lines but broader zones where price can spike in and quickly reverse.
2. Order Blocks
Order blocks are the last bullish or bearish candles before a significant price move caused by institutional orders. These are key institutional support/resistance levels where price often returns for mitigation or re-entry.
Bullish Order Block = Support Zone
Bearish Order Block = Resistance Zone
3. Breaker Blocks
When support breaks and flips to resistance (or vice versa), institutions often retest breaker blocks to add positions or induce liquidity.
4. Fibonacci Confluence Zones
Advanced traders use Fibonacci retracement and extension levels in combination with support and resistance zones to identify high-probability trade setups. Common levels like 61.8% and 78.6% often align with key order blocks.
5. Dynamic Support & Resistance (Moving Averages, VWAP)
Institutions monitor:
200 EMA/SMA on higher timeframes as dynamic resistance/support.
VWAP (Volume Weighted Average Price) as an institutional support/resistance during intraday moves.
These dynamic levels often act as price magnets during trend days.
✅ Institutional Manipulation Around Support/Resistance
🔹 Liquidity Grabs (Fake Breakouts):
Price breaks a key level (support or resistance), triggers stops, grabs liquidity, and violently reverses.
Common in forex, indices, and crypto markets.
🔹 Stop Loss Hunting:
Institutions drive price into known stop zones to fill large orders cheaply, especially during low-volume sessions.
🔹 Re-Tests and Confirmations:
Professional traders wait for confirmation after breakouts.
A common method: Break – Retest – Continuation setup, especially around higher timeframe support/resistance.
✅ How to Trade Support and Resistance Like an Institution
Mark Zones, Not Lines: Use zones (20-50 pip zones in forex or 1-2% zones in stocks), not fixed lines.
Use Multi-Timeframe Confluence: Identify higher timeframe levels (Daily, Weekly) and trade based on lower timeframe confirmations (M15, M30, H1).
Wait for Confirmations: Avoid blind entries. Wait for:
Rejection Candles (Pin Bar, Engulfing, Doji)
Break of Structure (BOS) or Change of Character (CHoCH) after grabbing liquidity.
Target Imbalance Zones: Combine support/resistance with fair value gaps (FVG) or imbalances where price is likely to revisit.
Track Volume Reaction: Volume spikes at support/resistance zones often indicate institutional activity.
✅ Pro Tips for Mastering Support and Resistance
Never chase price. Let the market come to your zones.
Higher timeframe levels = stronger reaction zones.
Watch for ‘fakeouts’ during news releases – institutions use volatility to create liquidity spikes.
Learn to recognize exhaustion (long wicks, low momentum) after liquidity grabs to confirm reversals.
Institutional levels often align with market sessions – London Open, New York Open tend to respect these zones more than Asian session.
✅ Final Thoughts
At an advanced level, support and resistance aren’t simple price levels — they are strategic zones used by institutions to trap uninformed traders. Once you start recognizing these patterns, you’ll stop reacting emotionally and start anticipating market behavior like a professional. You’ll know when to stay patient, when to avoid traps, and when to capitalize on market inefficiencies with high-probability, low-risk trades.

Trade Like Istitution Why Learn to Trade Like Institution?
Financial markets are not random. They are highly manipulated and structured systems, controlled by major financial entities. When you trade like institution, you stop guessing and start understanding:
Where the big players place their orders.
How liquidity zones work.
Why certain price levels are targeted before major moves.
How you can identify smart money footprints and follow the dominant trend.
This approach teaches you to trade strategically, patiently, and professionally — eliminating the emotional rollercoaster most traders experience.
What You Will Learn in “Trade Like Institution”
✅ Smart Money Trading Concepts
Understand how institutions manipulate markets, create liquidity, and trap retail traders. Learn the basics of accumulation, manipulation, and distribution phases.
✅ Market Structure and Order Flow
Read the market from an institutional perspective using pure price action and market structure analysis. Identify break of structure (BOS) and change of character (CHoCH) signals that reveal when the market is about to move.
✅ Order Block Identification
Learn to locate order blocks, where institutions place their large orders. These zones are often the key areas where price reverses or explodes in a specific direction.
✅ Liquidity Zones and Stop-Loss Hunting
Discover how to identify liquidity pools, understand stop-loss hunting techniques, and position yourself for trades after liquidity grabs.
✅ Risk Management Like Institutions
Master the art of risk management, learning how big players manage risk efficiently to stay profitable long-term, even after losses.
✅ High-Probability Trade Setups
Get access to reliable entry techniques with precise stop-loss placement and optimal reward-to-risk setups that minimize risk and maximize returns.
✅ Live Market Application
Learn through real-world market examples, live sessions, and chart analysis to see how institutional concepts apply in active markets like forex, stocks, indices, and crypto.
Who Should Learn to Trade Like Institution?
This course is designed for:
📊 New traders who want to start the right way without falling into retail traps.
💡 Intermediate traders who have experience but struggle with consistency.
💼 Full-time or part-time traders who wish to level up their skills.
📈 Investors who want to actively manage and grow their wealth.
🎯 Ambitious traders who want to make trading a serious and professional income source.
Benefits of Trading Like Institution
✅ Stop being a victim of market manipulation and start trading with the market movers.
✅ Eliminate confusion, follow clean price action, and trade with confidence.
✅ Avoid low-probability trades by understanding where the real market action happens.
✅ Build strong discipline and follow a professional trading process.
✅ Achieve long-term profitability by managing risk like professionals.
✅ Become a confident, independent trader capable of thriving in any market condition.
Trading success comes from learning the truth behind market movements and following the professional path. This course will completely transform your approach to the markets. With Trade Like Institution, you’ll stop guessing, start predicting, and trade with an edge just like the top institutional traders do every single day

Learn Institutional TradingWhy Learn Institutional Trading?
The financial markets are not random; they are highly structured environments controlled by large financial players who leave visible footprints on the chart. Most retail traders don’t see these footprints and end up on the wrong side of the market. By learning institutional trading, you will finally understand:
Why the market moves the way it does.
How to spot liquidity traps and avoid stop-loss hunting.
Where smart money enters and exits trades.
How to trade with confidence instead of fear and guesswork.
This course focuses on the real mechanics of price movement, not on unreliable indicators or random trade signals.
What You Will Learn in Institutional Trading
✅ Smart Money Concepts (SMC):
Learn how institutional traders accumulate and distribute orders, using liquidity to their advantage. Understand the true story behind price action.
✅ Liquidity and Order Blocks:
Master the art of identifying liquidity pools, order blocks, and market manipulation zones. Understand where smart money enters the market and how you can follow their lead.
✅ Market Structure Mastery:
Learn to read market structures with precision, identify internal and external structures, and capitalize on market shifts with high-probability trade setups.
✅ Entry and Exit Strategies:
Get access to professional-grade entry methods, including refined confirmation entries, break-of-structure (BOS) trades, and optimal risk-reward setups.
✅ Risk Management Techniques:
Understand how institutions manage risks and protect their capital. Implement strong risk management rules to protect your trading account from unnecessary losses.
✅ Live Market Sessions and Mentorship:
Participate in live market discussions, chart breakdowns, and Q&A sessions with expert traders who trade institutional concepts every day.
Who Can Learn Institutional Trading?
This course is suitable for:
📌 Beginners who want to start with professional strategies from day one.
📌 Intermediate traders who are tired of inconsistent results.
📌 Advanced traders who want to refine their understanding of market manipulation.
📌 Investors who wish to add active trading as an income source.
📌 Aspiring professionals who aim to make trading a serious career path.
Benefits of Learning Institutional Trading
✅ Trade with clarity and confidence, knowing you are on the side of smart money.
✅ Stop chasing trades and start trading with high-probability setups.
✅ Learn to avoid retail traps and false breakouts.
✅ Build a sustainable trading career with proper risk management and psychological discipline.
✅ Apply your skills to any market: stocks, forex, crypto, indices, or commodities.
✅ Experience real growth as a professional trader, thinking several steps ahead of the market.
Learn Institutional Trading is more than just a course — it’s a complete professional transformation. It equips you with the skills, mindset, and strategies to succeed in modern financial markets. Stop trading blindly and start trading with purpose, accuracy, and confidence.

Master Institutional TradingWhy Master Institutional Trading?
The stock market, forex, and other financial markets are highly manipulated environments, driven by the decisions of institutional traders, banks, hedge funds, and large players. Learning how these institutions trade gives you the clarity and confidence to trade in the direction of smart money rather than becoming a victim of market traps.
With this program, you will not only learn how the markets operate but also how to read price movements like an institutional trader. You’ll master advanced techniques that allow you to identify high-probability trade setups, manage your risks like a professional, and trade with patience and precision.
Key Features of Master Institutional Trading
Smart Money Concept (SMC): Understand the core principles of smart money trading, including how large institutions accumulate and distribute assets.
Liquidity Hunting Strategies: Learn how institutions use liquidity zones, stop loss hunting, and false breakouts to trap retail traders — and how you can profit by following their footprint.
Order Block Mastery: Master the identification of order blocks, breaker blocks, and mitigation blocks — key areas where institutional orders are placed.
Market Structure & Price Action: Analyze clean price action without relying on lagging indicators. Understand market structure shifts, internal and external liquidity, and premium/discount zones.
Advanced Risk Management: Learn professional risk management techniques to control drawdowns and maximize returns, including how institutions scale in and out of positions.
Live Market Analysis: Get exposure to live trading sessions where experts explain the logic behind every trade entry and exit, based on institutional concepts.
Psychological Discipline: Develop a winning mindset focused on discipline, patience, and long-term profitability, just like professional traders working in financial firms.
Who Is This Course For?
This program is ideal for:
Traders who want to stop following retail strategies and learn real market mechanics.
Beginners who want to build a solid institutional foundation from the start.
Intermediate traders who are struggling with inconsistent results and want to level up their skills.
Experienced traders who wish to refine their market reading abilities and trade with greater precision.
Full-time or part-time traders seeking to understand price manipulation and liquidity traps.
What You’ll Gain from This Master Class
✅ The ability to track institutional footprints and predict market movements more accurately.
✅ A complete system based on price action, market structure, and liquidity analysis.
✅ Tools and strategies to avoid false signals and stop-loss hunts.
✅ Improved risk-reward ratios by trading in the direction of smart money.
✅ A professional, emotion-free approach to trading that focuses on long-term profitability.
✅ Real-world practical skills that you can apply in any market — stocks, forex, crypto, or commodities.
This is not a basic or theoretical course. The Master Institutional Trading program delivers real, professional-level trading knowledge, breaking down the hidden market mechanics that drive price action. By the end of this program, you will no longer trade like the crowd — you will trade like the institutions that move the markets

Trading Master Class With ExpertsWhy Choose the Trading Master Class With Experts?
In the world of trading, there’s a fine line between success and failure. The financial markets are full of opportunities but also come with significant risks. The key difference between winning traders and losing traders is education, discipline, and strategy. This masterclass is not just about learning how to trade; it’s about developing a professional trading mindset, learning proven techniques, and practicing high-probability setups under the guidance of industry experts.
This is a result-oriented program designed to give you a complete transformation from a confused trader to a disciplined market participant.
Key Highlights of the Master Class
In-Depth Market Knowledge: Learn the complete fundamentals of financial markets, including market structure, how different asset classes work, and what drives market movements.
Technical Analysis Mastery: From candlestick patterns to advanced indicators, understand how to read charts like a pro. Learn key technical tools like moving averages, RSI, MACD, Fibonacci retracements, and more.
Professional Trading Strategies: Master multiple trading styles including day trading, swing trading, scalping, and positional trading. Get access to expert-verified strategies used by institutional traders.
Options and Derivatives Trading: Understand the power of options trading, futures contracts, hedging techniques, and options strategies like iron condor, spreads, straddles, and strangles.
Institutional Trading Insights: Discover how big players operate in the market. Learn about smart money concepts, liquidity traps, stop loss hunting, and how to trade in alignment with market movers.
Risk Management and Trading Psychology: Learn how to protect your capital using strict risk management rules. Understand the psychological side of trading and how to build emotional discipline for consistent success.
Live Trading Sessions: Participate in live market analysis and live trading sessions with experts who explain their trades in real-time, helping you understand their decision-making process.
Community and Mentorship: Join a supportive community of traders where you can share ideas, discuss setups, and receive continuous guidance from mentors.
Who Should Attend This Master Class?
This masterclass is suitable for:
Aspiring traders who are looking for a solid foundation to start their trading journey.
Intermediate traders who are struggling with consistency and need structured guidance.
Investors who want to learn active trading techniques to multiply their returns.
Working professionals who want to trade part-time with smart strategies.
Full-time traders who want to sharpen their skills and expand their market knowledge.
What You Will Achieve After This Master Class
✅ You will be able to independently analyze charts and identify profitable trading opportunities.
✅ You will develop professional risk management habits that protect you from heavy losses.
✅ You will gain the confidence to trade any market condition — bullish, bearish, or sideways.
✅ You will have clear strategies to trade with discipline, eliminating guesswork and emotional mistakes.
✅ You will build a trader’s mindset focused on growth, patience, and long-term profitability.
This is not just another trading course. It is a complete transformation program that helps you think, act, and succeed like a professional trader. Step into the world of high-probability trading and change your financial future with the Trading Master Class With Experts.

Master Candle Sticks✅ Why Candlesticks Are So Powerful
Candlesticks visually represent real-time market sentiment. Every single candlestick shows you:
Who is in control (buyers or sellers).
The strength of momentum.
Potential exhaustion or continuation.
The battle between retail traders and smart money.
Unlike indicators, which lag, candlesticks are real-time market footprints, helping traders make quick, informed decisions based on pure price action.
✅ Structure of a Candlestick
Every candlestick consists of:
Body: The range between open and close prices — shows strength or weakness.
Wick/Shadow: High and low of the session — shows rejection, liquidity grabs, or manipulation.
Color: Bullish (green/white) vs. Bearish (red/black).
The size of the body and wicks tells a story about market strength or indecision.
✅ Essential Candlestick Patterns
🔵 Reversal Patterns:
Pin Bar (Hammer/Inverted Hammer): Long wick shows rejection of price and potential reversal.
Engulfing Candles: Bullish or bearish candles fully engulf previous candle → momentum shift.
Morning Star / Evening Star: Three-candle reversal at key levels → trend change confirmation.
Doji: Indecision candle, often seen before reversals or breakouts.
🔵 Continuation Patterns:
Inside Bar: Consolidation, often leading to breakouts in the direction of trend.
Bullish/Bearish Flag: Continuation after a sharp move.
Three White Soldiers / Three Black Crows: Strong multi-candle trend confirmation.
✅ Advanced Institutional Candlestick Secrets
🔥 Secret 1: Candlesticks at Key Market Levels
Candlestick signals are most reliable at:
Order Blocks
Support & Resistance Zones
Liquidity Pools
Imbalance/Fair Value Gaps
Always combine candlestick signals with higher timeframe zones for high-probability setups.
🔥 Secret 2: Wick Rejections & Stop Loss Hunts
Institutions often push price to grab liquidity beyond a support/resistance level, shown by long wicks. Wick rejections = liquidity grab = high reversal probability.
🔥 Secret 3: Multi-Timeframe Candlestick Reading
A single higher timeframe candle (Daily, 4H) is built from multiple smaller timeframe candles. Professionals:
Use HTF direction and LTF entry.
For example, Daily bullish engulfing + M15 break of structure = precise sniper entry.
✅ How to Master Candlestick Trading
✅ Focus on clean price action, avoid overcrowding charts with indicators.
✅ Study reaction at key levels, not random patterns.
✅ Always confirm with market structure (trend direction, higher highs/lows, BOS/CHoCH).
✅ Use candlestick confluence, combining patterns with liquidity zones, order blocks, or supply/demand.
✅ Avoid low-quality signals in choppy or low-volume markets.
✅ How Institutions Use Candlesticks
Institutions manipulate candles during low liquidity periods (fakeouts).
They use time-based traps, creating bullish/bearish patterns before reversing direction.
Volume + Candlestick Analysis shows true institutional intent — e.g., high volume bullish pin bars after liquidity grab = strong upside signal.
✅ Pro Tips for Candlestick Mastery
💡 Best signals occur after liquidity grabs — false breakout + rejection wick.
💡 Always combine candlesticks with market structure shifts — don’t take isolated signals.
💡 Trade in the direction of higher timeframe momentum, even if lower timeframe gives opposite signals.
💡 In sideways markets, avoid reversal signals, favor range trades.
✅ Final Thoughts
Candlesticks are the true language of the market. By mastering candlestick trading, you’ll gain the ability to predict market moves before they happen, trade with confidence, and avoid the common mistakes of indicator-dependent retail traders.
Master Candlestick Trading is your first step to becoming a consistently profitable trader, whether in forex, stocks, crypto, or commodities

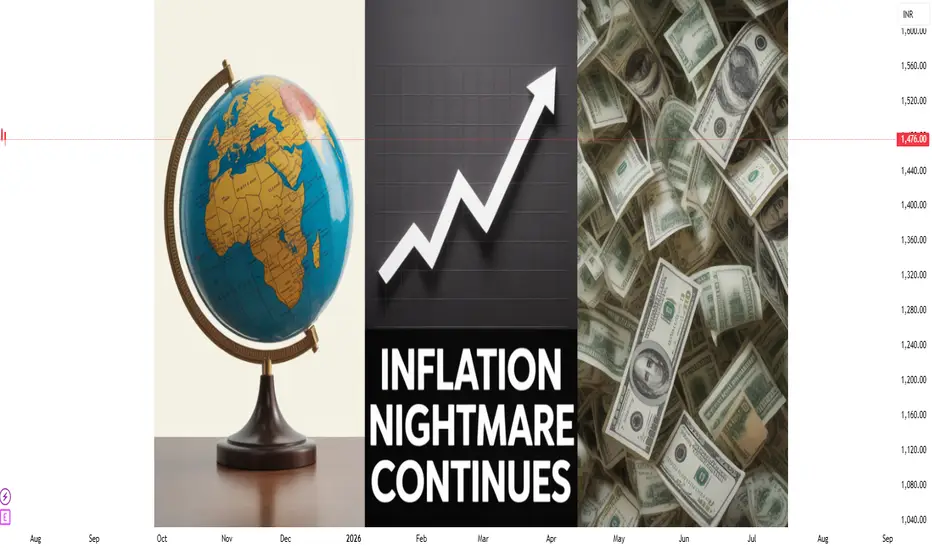
Geopolitical & US Macro WatchWhat Is Geopolitical & US Macro Watch?
This is a two-part term:
1. Geopolitical Watch
This refers to tracking and analyzing global political situations that can impact trade, oil, currency, defense, or investor confidence. Examples include:
Wars or conflicts (Ukraine-Russia, Israel-Gaza, China-Taiwan)
Global oil sanctions
Strategic alliances (e.g., BRICS+ expansion, NATO decisions)
Diplomatic tensions between countries
These events influence:
Crude oil prices
Foreign exchange rates
FII flows (Foreign Institutional Investment)
Global demand-supply outlooks
2. US Macro Watch
This focuses on tracking economic developments in the United States, the world's largest economy. Key areas to watch include:
Inflation reports (CPI, PCE)
US Federal Reserve interest rate decisions
Jobs data (non-farm payrolls, unemployment rate)
Retail sales, housing starts
US GDP growth
U.S. debt levels and political decisions on trade/tariffs
Because the US dollar is the world's reserve currency, and because Wall Street often sets the tone for global markets, these macro signals directly affect India’s equity market, bond yields, and rupee valuation.
🧠 Why Does This Matter to Indian Traders & Investors?
You may ask—“Why should I care about some news in the U.S. or Europe when I’m only buying shares of Indian companies?”
Here’s the reality:
Over 50% of the daily movement in Indian indices like Nifty and Sensex is now influenced by global cues.
Foreign investors (FIIs), who own a huge portion of Indian stocks, take buy/sell decisions based on global trends, not just local stories.
US interest rates affect where FIIs want to put their money—if US bonds are yielding more, they might pull out of India.
Crude oil, which India imports heavily, is priced globally—if a war breaks out, oil shoots up and hits inflation in India.
In short: What happens outside India often decides how India trades.
🔥 Major Geopolitical Risks in 2025
Let’s look at some real-world developments that have been shaking or supporting markets this year:
1. Russia-Ukraine Conflict (Still Ongoing)
Even in 2025, the war isn’t over.
It affects wheat prices, natural gas, and military spending globally.
India has been balancing ties with both Russia and the West, but disruptions affect commodity markets, logistics, and inflation.
2. Middle East Tensions (Gaza, Iran, Red Sea Attacks)
Ongoing conflicts have kept crude oil prices elevated.
Shipping through the Suez Canal and Red Sea has become riskier, increasing global logistics costs.
This directly affects India’s import bill, trade deficit, and rupee stability.
3. US–China Trade Friction
The US has imposed tech restrictions on China; China is retaliating.
If tensions escalate further, it will impact the global supply chain, especially for semiconductors, electronics, and electric vehicles.
Indian tech companies (like TCS, Wipro) may see ripple effects due to changes in global outsourcing dynamics.
4. Taiwan Risk
Any Chinese military action on Taiwan could be catastrophic for markets, especially in electronics and semiconductors.
Since semiconductors power everything from phones to EVs, even a threat here affects stocks globally.
📊 Key US Macro Trends Impacting Markets in 2025
1. US Inflation is Cooling, But Not Gone
After peaking in 2022, inflation has come down, but in 2025, it’s still sticky.
That means the Federal Reserve (US central bank) is not cutting rates as aggressively as markets hoped.
➡️ When the Fed keeps rates high:
US bond yields rise
FIIs pull money out of emerging markets like India
Nifty and Sensex feel the pressure
2. US Job Market Is Strong
A robust job market signals continued economic expansion, good for global demand.
This is why metals, IT, and manufacturing stocks in India rally when US jobs data is good.
3. The Fed’s Interest Rate Policy
The biggest global event each month is the Fed meeting.
If they cut rates, stocks rally globally.
If they pause or raise rates, money flows into safe assets like gold or the US dollar—hurting Indian equities.
Real-Time Example: July 2025
In July 2025, Indian markets have been:
Rallying due to strong US jobs data and earnings
Cautious due to potential Trump-era tariffs on countries buying Russian oil
Watching closely for US inflation print and Fed meeting signals
GIFT Nifty shows bullish strength in pre-market hours when the US ends green. But we’ve also seen sell-offs on days of oil spikes or war-related news.
🧭 How to Track These Developments (Even If You’re Busy)
Here’s a simple checklist for staying informed:
✅ Every Morning
Check GIFT Nifty
Read major global headlines (US data, oil prices, geopolitics)
Note the USDINR trend
Watch India VIX
✅ Every Week
Look at US job reports, inflation (CPI), and Fed speeches
Follow crude oil and gold charts
Track FII/DII activity
Keep an eye on shipping, metals, and defense-related stocks
✅ Final Thoughts
"Geopolitical & US Macro Watch" is not just a fancy term—it's a crucial lens for today’s markets. The biggest stock market moves often come not from company news but from macroeconomic surprises or global tensions.
In 2025, being globally aware gives you an edge:
You’ll avoid panic on news-driven crashes
You’ll better understand why your portfolio is up or down
You’ll identify trade setups ahead of others
👉 Think global, act local—that’s the new mantra for smart Indian investors.
If you want daily or weekly updates summarizing these events and their impact on Indian markets, let me know—I’ll be happy to prepare a custom watchlist or dashboard for you
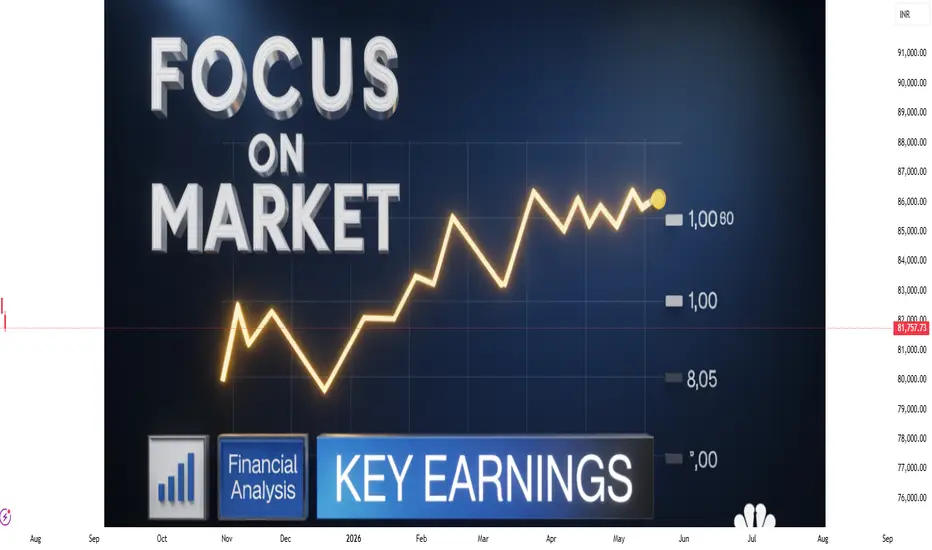
Earnings in Focus Companies in the Spotlight
Reliance Industries (RIL)
Reliance’s results are among the most awaited in the Indian market. It touches almost every Indian household through its telecom (Jio), retail, and oil-to-chemicals arms.
In Q1, analysts expected strong year-on-year growth in profit, partly helped by a one-time gain from a stake sale.
Retail and digital segments were projected to post steady growth.
Oil-to-chemicals margins were expected to remain stable due to global energy price stabilization.
Since Reliance has a significant weight in both Nifty and Sensex, even a 2–3% move can swing the broader indices.
JSW Steel
JSW Steel posted stronger-than-expected operating profits. The volume growth was robust and pricing held steady despite global uncertainties.
Steel performance is considered a proxy for infrastructure and housing demand.
Better margins mean improved profitability outlook, which often lifts peer stocks like Tata Steel and SAIL too.
Wipro
Wipro surprised the street with a better-than-expected net profit growth and steady revenue.
This came after a few muted quarters, giving confidence to IT investors.
The firm also secured some large deals, which improved guidance.
When a Tier-1 IT company beats expectations, it often leads to a short-term sector-wide rally.
Axis Bank
Axis Bank reported a small decline in net profit due to an increase in provisions and asset quality slippage.
Markets reacted negatively, with the stock dropping more than 5%.
This raised some concerns for the entire banking sector, especially around retail loan delinquencies.
Bank earnings are carefully tracked for signs of economic health since they’re the first to show stress in the system.
Hindustan Zinc
Despite a year-on-year drop in profit, Hindustan Zinc beat market expectations.
The metal segment held up well.
Higher cost efficiency offset pricing pressure.
It shows that even in commodity-heavy businesses, efficiency and scale can drive earnings resilience.
3. 📈 How Markets React During Earnings
Earnings are one of the biggest catalysts for short-term market movements. Here’s how different market participants respond:
Retail Traders: Look for quick intraday or swing opportunities based on the reaction to earnings.
Institutional Investors: Focus more on guidance, margin outlook, and strategic plans.
FIIs & DIIs: Use results to rebalance portfolios across sectors.
This week, markets opened flat with mixed sector movements. Financials remained under pressure due to Axis Bank, while energy and metals were relatively stronger.
4. 🎯 Trading Strategies During Earnings Season
🔹 Intraday Traders:
Monitor stock-specific results.
A strong beat often results in gap-up opens, followed by either a continuation rally or profit-booking.
Misses often result in sharp selling pressure.
🔹 Swing Traders:
Look for strong earnings + bullish technical setup for 3–5 day momentum trades.
Weak earnings can be played with bearish options like puts or bear spreads.
🔹 Investors:
Focus on long-term stories where earnings confirm improving fundamentals.
Use dips in strong businesses as buying opportunities.
5. 💼 Sectoral Trends from Current Earnings
✅ IT Sector:
Wipro’s good performance and deal wins have created optimism.
If the rest of the IT majors follow suit, it may indicate a bottom in the tech cycle.
✅ Metals:
JSW Steel’s strong numbers confirm ongoing industrial demand.
Infra push and China’s restocking are adding tailwinds to global metal prices.
❌ Financials:
Axis Bank’s weaker asset quality is a concern.
Market will now look toward HDFC Bank, SBI, and ICICI Bank to see if this is a one-off or an emerging trend.
⚖️ FMCG & Consumer:
Awaited earnings from major players like HUL, Dabur, and Nestlé will show how rural and urban consumption are shaping up.
Margin expansion through easing input costs will be closely monitored.
6. 📊 Impact on Broader Indices
Nifty:
Reliance alone has over 10% weight in the index. A positive surprise there can lift Nifty meaningfully.
IT and metals also have significant representation, so results from Wipro and JSW Steel are important.
Bank Nifty:
Axis Bank’s fall dragged the index.
A recovery depends on upcoming results from ICICI Bank and HDFC Bank.
Sector Indices:
Nifty Metal may outperform if positive surprises continue.
Nifty IT needs more broad-based strength to reverse the downtrend.
7. 🧠 What Smart Money Is Watching
Institutional investors are focusing on:
Guidance for the rest of FY25
Cost management: Are companies protecting or growing their margins?
Volume growth: Are revenues rising due to real demand or just price hikes?
Loan growth and credit quality: Especially in the banking space
These insights help long-term investors identify early winners and avoid laggards.
8. 🧾 Key Takeaways for Traders & Investors
Earnings are the strongest short-term trigger in markets.
Reliance results can tilt the entire Nifty one way or the other.
IT is stabilizing, Metals are strong, Financials are shaky—sector rotation is visible.
Stay stock- and sector-specific rather than going fully index-based during earnings season.
9. ✅ Final Words
“Earnings in Focus” isn’t just a headline—it’s the heartbeat of market sentiment right now.
In a market driven by uncertainty (inflation, interest rates, global slowdown), real numbers from real companies matter more than ever. This is the time when:
Traders can catch powerful moves based on short-term surprises
Investors can spot trends and leaders early
Portfolio rebalancing decisions can be guided by facts, not emotions
Whether you’re in for a quick trade or a long-term position, understanding earnings and their market impact is essential.
GIFT Nifty Signals Bullish Start🏛️ What is GIFT Nifty?
Let’s start with the basics.
GIFT Nifty is the new name for what used to be known as the SGX Nifty—a derivative contract that mirrors the Nifty 50, but is traded outside India.
It now runs on the GIFT City platform (Gujarat International Finance Tec-City).
It gives traders, especially foreign institutional investors (FIIs), the ability to trade in Nifty futures even before the Indian market opens.
Think of it as an early indicator of how the Nifty 50 might perform when the Indian market opens at 9:15 am.
✅ Important: GIFT Nifty is NOT a separate index.
It simply reflects the expected movement of the Nifty 50 index, based on global market cues and overnight developments.
🧠 Why Did SGX Nifty Become GIFT Nifty?
Until July 2023, the Nifty futures were traded on the Singapore Exchange (SGX).
But to bring more liquidity and volume back to Indian shores and to establish India as a global financial hub, the trading of Nifty derivatives was moved from Singapore to the GIFT IFSC platform.
Thus, SGX Nifty became GIFT Nifty.
📈 Why GIFT Nifty’s Morning Move Matters
Each morning, traders, analysts, media houses, and even retail investors check GIFT Nifty levels.
Why?
Because it acts as a directional clue. Here’s how:
If GIFT Nifty is up by 100 points, it’s a sign that Nifty 50 is likely to open higher.
If it’s down by 75 points, it hints at a gap-down opening.
It reflects the sentiment of global markets, overnight US cues, geopolitical risks, and FII mood.
📊 Example:
GIFT Nifty trading at 22,450 (up 80 points)
Yesterday’s Nifty close: 22,370
→ Bullish sign → Indian markets may open with a gap-up of 70–100 points.
📌 What Does “Bullish Start” Mean?
A bullish start means the market is expected to open on a positive note—meaning, the index (like Nifty or Sensex) may start the day higher than the previous day’s closing.
This can happen due to:
Strong global cues (e.g., Dow Jones, Nasdaq closing higher)
Positive FII activity
Good earnings announcements
Supportive macroeconomic data
Favorable government or budget policy
Cooling of global tensions or crude oil prices
So, when GIFT Nifty shows a positive movement before 9 am, traders call it a bullish pre-market setup.
🔍 Real-World Example – July 18, 2025
On July 18, 2025:
GIFT Nifty was up by 55 points, indicating a positive start.
This came after a volatile weekly expiry on Thursday.
Strong earnings expected from companies like Reliance, JSW Steel, L&T Finance added to positive sentiment.
US markets closed flat, but no major negative surprise.
FIIs were net sellers, but DIIs absorbed selling pressure.
→ All this combined gave a green signal from GIFT Nifty to the domestic market.
💼 How Traders Use GIFT Nifty in Strategy
✅ 1. Pre-Market Planning
GIFT Nifty gives early clues, so:
Intraday traders plan opening range setups
Option traders adjust straddles/strangles based on expected gap
F&O traders look at overnight position rollover
✅ 2. Risk Management
A weak GIFT Nifty warns of gap-downs due to global negativity.
This allows traders to:
Hedge long positions
Tighten stop-losses
Avoid aggressive morning trades
✅ 3. Sectoral Rotation
If GIFT Nifty is up, focus shifts to high-beta stocks like Bank Nifty, Reliance, Adani Group, etc.
If it's down, defensive plays like FMCG and Pharma may perform better.
🧮 How to Read GIFT Nifty Properly?
Here are 3 simple tips:
✔️ Tip 1: Compare with Previous Day’s Nifty Close
If GIFT Nifty > Last close → Gap-up expected
If GIFT Nifty < Last close → Gap-down likely
✔️ Tip 2: Watch Global Cues
Dow/Nasdaq closing + crude oil + USD/INR = impact GIFT Nifty
If all show strength, GIFT Nifty usually reacts positively
✔️ Tip 3: Use With FII/DII Data
Bullish GIFT Nifty + FII Buying = Strong setup
Bullish GIFT Nifty + FII Selling = Weak opening might reverse later
🌎 GIFT Nifty & Global Linkage
India is now deeply linked with:
US markets (Nasdaq, S&P 500)
Crude oil
Dollar Index
Global interest rate policies (Fed, ECB)
So if:
US markets crash overnight → GIFT Nifty reacts instantly
Crude oil falls sharply → Positive for India → GIFT Nifty turns green
📍 Important: GIFT Nifty Is Not Always Accurate
Sometimes GIFT Nifty shows bullish signs, but:
Domestic news (politics, budget) pulls market down
FII/DII data surprises post-opening
Index gaps up but then reverses during the day
That’s why traders use GIFT Nifty as a clue, not a guarantee
🚦 Final Thoughts – Why You Should Watch GIFT Nifty
GIFT Nifty is like the morning alarm for the market:
It tells you what’s likely to happen before the bell rings.
Gives you a head start to plan your trades.
Helps spot sectoral strength, F&O positioning, and market mood.
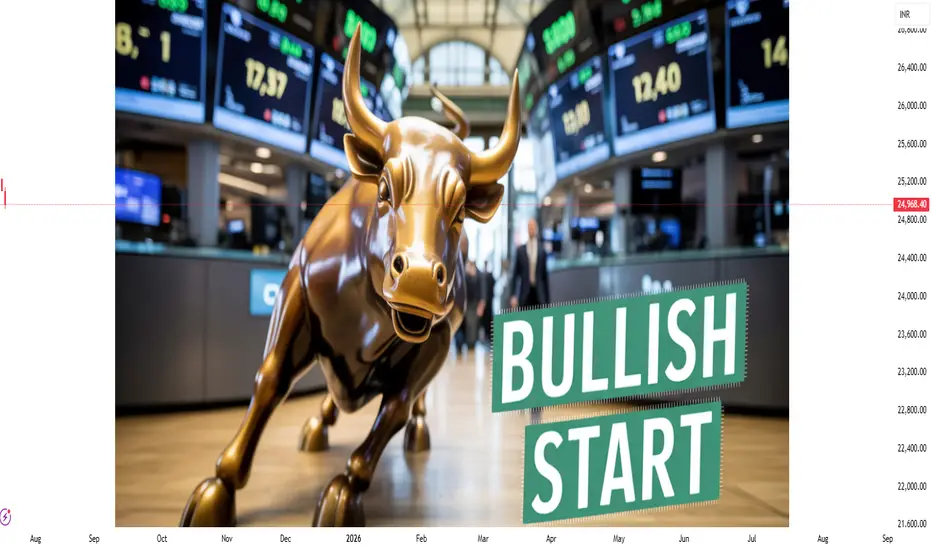
Master Institutional TradingWhat is Master Institutional Trading?
Master Institutional Trading is the advanced knowledge and skill set focused on understanding how big institutions operate in the market. It includes learning about market structure, order flow, liquidity zones, and smart money concepts. The goal is to understand where and why institutional players are placing their trades so individual traders can follow their footprint rather than trade blindly.
Key Elements of Institutional Trading
Smart Money Concepts (SMC):
This focuses on how "smart money" (institutions) moves in the market, including liquidity grabs, fakeouts, and manipulation of retail traders. Mastering SMC helps traders identify high-probability trade setups.
Order Blocks:
Institutions don’t place orders like retail traders. They use large block orders, which leave visible patterns on charts called “order blocks.” Learning to identify these helps in predicting price movements accurately.
Liquidity Pools:
Institutions hunt liquidity because they need large volumes to execute trades. Stop-loss levels and obvious support/resistance zones are common liquidity areas. Master institutional traders learn to identify where liquidity sits in the market.
Market Structure:
Understanding market structure (higher highs, lower lows, break of structure) is critical. Institutions move the market in phases — accumulation, manipulation, expansion, and distribution.
Volume and Order Flow Analysis:
Mastering institutional trading includes studying how volume flows in the market, using tools like volume profile, footprint charts, and delta analysis to see where institutional money is entering or exiting.
Benefits of Learning Master Institutional Trading
Higher Accuracy: You trade with the market makers, increasing your chance of success.
Better Risk Management: Institutional strategies often involve precise entry points and tighter stop-losses.
Avoiding Retail Traps: Most retail traders lose money because they trade in the wrong direction. Institutional trading helps you avoid these traps.
Consistency: You develop a rule-based approach, avoiding emotional decisions.
Why Institutions Dominate the Market
Institutions control over 70% of daily market volume, especially in forex, stocks, and commodities. They have advanced technologies like high-frequency trading (HFT), deep market data, and insider information that allow them to manipulate short-term price actions. By understanding their strategies, you can ride the momentum they create rather than getting trapped.
Final Thoughts
Mastering Institutional Trading is not about predicting the market but reading it correctly. By learning how institutional players think and operate, you can make more informed, disciplined, and profitable trading decisions. It transforms your trading approach from gambling to a professional strategy. This knowledge is essential for anyone serious about making consistent profits in the financial markets

LEARN INSTITUTIONAL TRADING✅ What is Institutional Trading?
Institutional trading focuses on understanding how big money flows in the market. Institutions trade in huge quantities, and their strategies revolve around manipulating prices to collect liquidity, triggering stop-losses, and creating false breakouts. Retail traders often lose money because they follow trends without understanding the market structure set by these institutions.
✅ What You Will Learn in Institutional Trading
1. Smart Money Concepts (SMC):
Learn how smart money (institutions) traps retail traders using fake breakouts, stop hunts, and liquidity grabs.
2. Market Structure:
Higher Highs (HH), Higher Lows (HL), Lower Highs (LH), Lower Lows (LL)
Break of Structure (BOS) and Change of Character (CHOCH)
This helps you predict market direction with logic, not emotions.
3. Order Blocks:
These are zones where institutions place large orders. You’ll learn how to identify them and trade with the big players.
4. Liquidity Pools:
Find out where stop-losses and pending orders are sitting in the market so you can trade smartly by targeting liquidity zones.
5. Entry & Exit Strategies:
Master high-probability entry techniques and learn proper risk management like institutional traders.
✅ Why Learn Institutional Trading?
Retail Trading Institutional Trading
Random entries Planned entries based on logic
Easily manipulated Trades follow the footprint of big players
Low win rate Higher win rate with patience
Emotional trading Rule-based, stress-free trading
✅ Benefits of Mastering Institutional Trading
🎯 Accurate Trades – Follow the market makers.
💸 Better Risk-Reward – Small stop-loss, bigger targets.
⏰ Trade Less, Earn More – No overtrading, only quality setups.
🧠 No Indicators Needed – Pure price action and market reading.
✅ Who Can Learn Institutional Trading?
✅ Beginners who want to start right.
✅ Retail traders who keep losing.
✅ Part-time traders looking for consistency.
✅ Anyone serious about becoming a profitable trader.
✅ Final Words:
Institutional trading teaches you how to trade with the smart money instead of against it. Once you master these strategies, you will understand market moves like a professional and make more consistent profits

Technical Class✅ What You Learn in a Technical Class
1. Introduction to Technical Analysis
What is price action?
Difference between Technical and Fundamental Analysis
Basics of Candlestick Charts
2. Candlestick Patterns
Bullish and Bearish Patterns
Reversal Patterns (Doji, Hammer, Shooting Star)
Continuation Patterns (Flags, Pennants)
3. Chart Patterns
Double Top, Double Bottom
Head and Shoulders
Triangles (Ascending, Descending)
4. Indicators and Oscillators
Moving Averages (MA, EMA)
RSI (Relative Strength Index)
MACD (Moving Average Convergence Divergence)
Bollinger Bands
5. Support and Resistance
How to Identify Strong Support Zones
How to Use Resistance Levels for Entries/Exits
6. Trend Analysis
How to Spot a Trend (Uptrend, Downtrend, Sideways)
Trendlines and Channels
Breakouts and Fakeouts
7. Volume Analysis
Importance of Volume in Confirming Moves
Volume Spikes and Market Reversals
8. Risk Management
How to Protect Your Capital
Stop Loss and Take Profit Strategies
Risk-Reward Ratio
✅ Who Should Attend a Technical Class?
✅ Stock Market Beginners
✅ Intraday Traders
✅ Swing Traders
✅ Option Traders
✅ Anyone who wants practical market knowledge

Advance Option Trading✅ What is Advanced Options Trading?
At the advanced level, traders use option combinations, multi-leg strategies, and hedging techniques to:
Maximize profits
Minimize risks
Take advantage of market volatility and time decay (Theta)
You don’t just predict direction; you trade direction, volatility, and time decay together.
✅ Core Concepts in Advanced Options Trading
1. Greeks Mastery
Delta: Measures how much the option price moves with the underlying asset.
Gamma: Rate of change of Delta.
Theta: Time decay — how much the option loses value every day.
Vega: Sensitivity to volatility changes.
Rho: Impact of interest rate changes (used less by retail).
Understanding Greeks helps you manage profits and risks more precisely
3. Volatility Trading
Institutions trade implied volatility (IV), not just price direction. Advanced traders use tools like IV Rank and IV Percentile to:
Sell options when IV is high (premium rich)
Buy options when IV is low (cheap options)
4. Hedging Techniques
Use options to protect your portfolio from major losses.
Example: Holding stocks and buying Protective Puts to limit downside risk.
Example: Selling Covered Calls to generate monthly income on stock holdings.
✅ Benefits of Advanced Options Trading
💸 Profit in Any Market Condition (up, down, sideways)
⏳ Earn from Time Decay (Theta Decay)
🛡️ Control Risk with Defined Risk Strategies
🎯 Higher Probability of Consistent Returns
📉 Less Capital, More Leverage
✅ Who Should Learn Advanced Option Trading?
✅ Traders with basic options knowledge
✅ Investors wanting to hedge portfolios
✅ Intraday or positional traders
✅ Those seeking consistent monthly income
✅ Final Thoughts
Advanced Options Trading transforms you from a simple buyer/seller to a strategic trader who uses market forces smartly. You don’t chase trades — you set up calculated, high-probability positions and let the market work for you.
