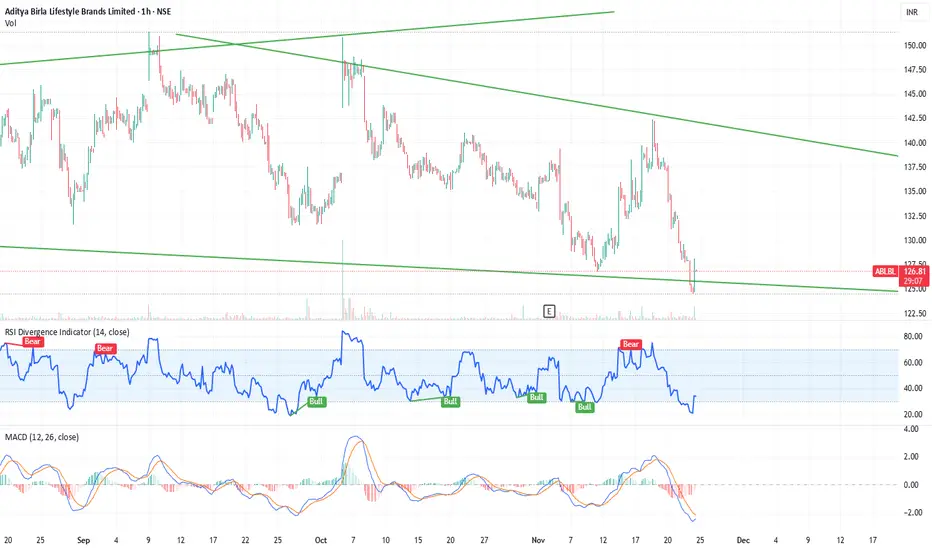
Falling Wedge Pattern (Bullish Setup) | Re-Opportunityit did give an opportunity last week, then fell, and is again at an opportunity zone now.
RSI Analysis
Your RSI shows:
RSI near 37–38
This is close to oversold, which is usually where reversals happen
Earlier, RSI bounced from similar levels
➡️ Supports a bounce possibility.
MACD Analysis
MACD is

Black Friday
The greatest deal of the year is here.Get it before the point of no return.
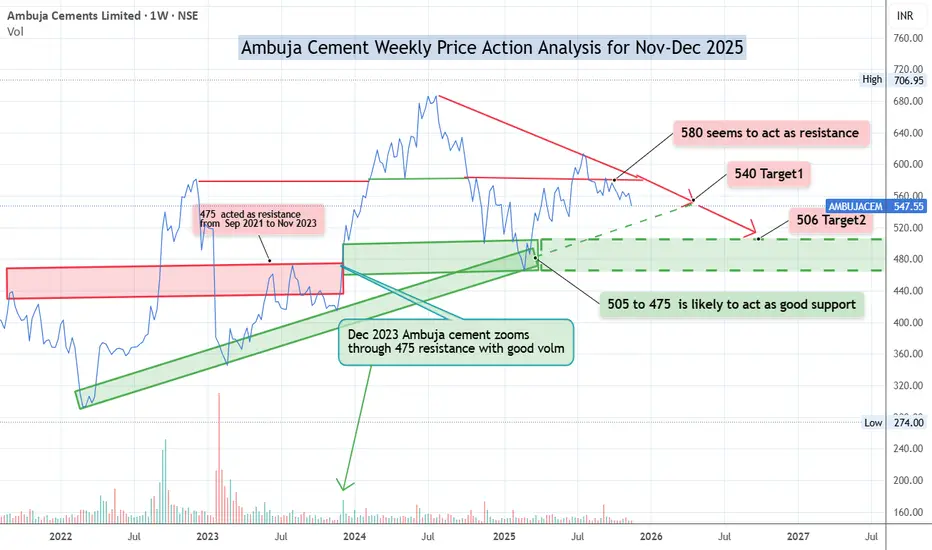
Ambuja Cement Weekly Price Action Analysis for Nov-Dec 2025On Weekly chart Ambuja Cement has closed at 547 on 20-Nov-25
Recent price action indicates the stock is struggling to go past 575-580 area.
It is likely to continue going down till its support major region of 505-475.
One can sell/short sell whenever the stock comes near 570 region. Keeping SL of 5
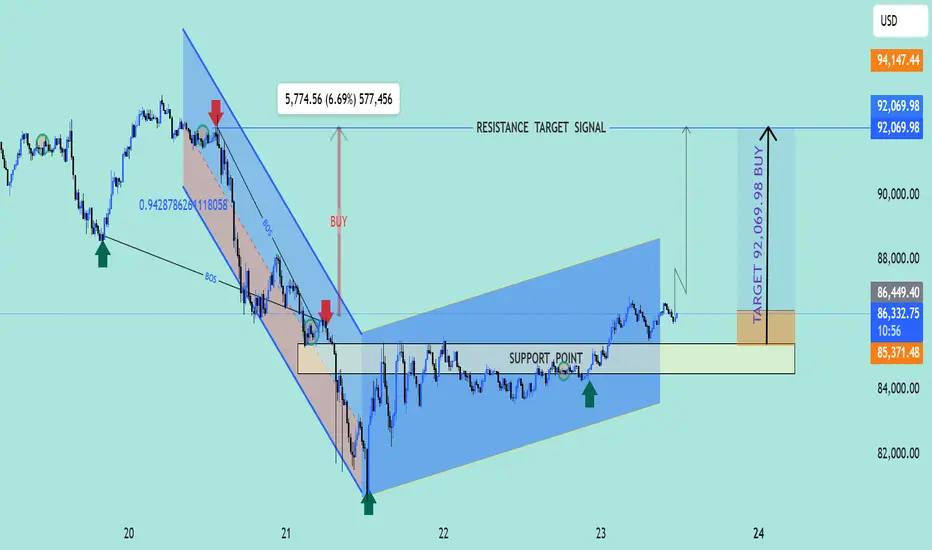
4. Price Action Analysis with Target at 92K1. Market Structure
The chart shows that the market was previously in a downtrend, but price has now created a bullish structure shift.
This shift is confirmed by a Break of Structure (BOS) to the upside, meaning buyers have taken control.
---
2. Support Zone
Price reacted strongly from the sup
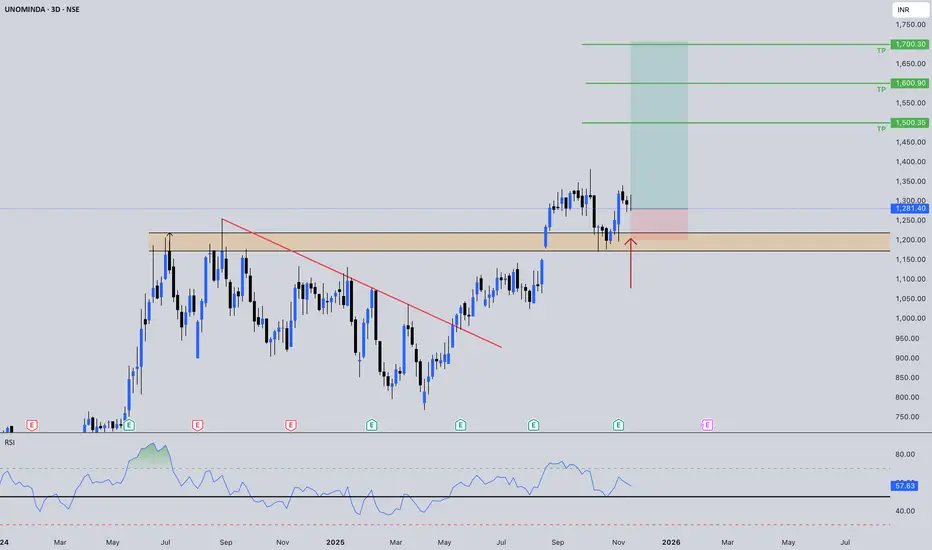
UNOMINDA: Post-Breakout Retest - Setting Up For Wave 2
Price shows a text-book breakout and retest of a multi-month consolidation high, signaling a potential acceleration phase in the Auto Components space.
🔍 Technical Snapshot (3-Day Chart)
Metric: Breakout Zone
Value: ₹1,180–₹1,250
Interpretation: Critical horizontal resistance flipped to suppo
HDFCLifeHDFCLife has a very long consolidation and going up and down in the range.
Previous wave has a downfall and not it is started with uptrend. So some uptrend it has small correction and ready to move up side.
So, above 770 we can see upside movement till the 800-820.
So, as per technical it's good

Consolidation face ends? Anuras has been in some decent consolidation for last 6 months and has seen strong volumes in last 2-3 session. Post results season buying is intriguing since not much happened post call. Watch out for some action. Please note RSI is 76 so take position according to your appetite.

H&S pattern Bearish in SBICARDHead & Shoulders pattern finished in SBICARD.
On breakdown of trendline, will target the downside target equal to the range of head (from top of head to neckline)
Targets are mentioned, including key levels in between. Stop is above halfway of the right shoulder

INFOSYS MY TECHNICAL VIEWS 19-11-25After retest of support, multiple times, price ready to go up.
Nifty It and Infosys charts are almost identical..
Nifty is already in trend. VIX Normal. dollar index below 100. Good delivery. Everything look perfect. Anything missing?
Your views and suggestion are invited.

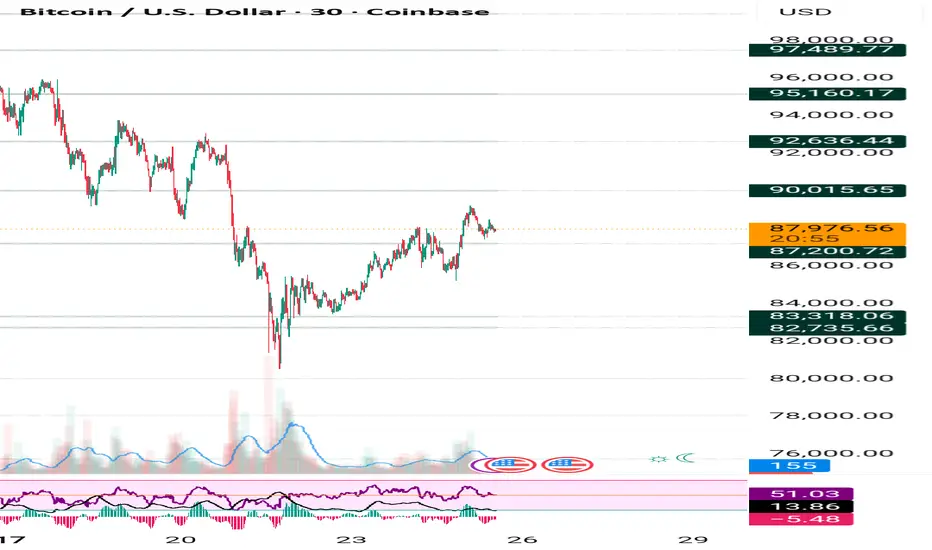
Bitcoin Turn Bearish In Monthly Time frameWhat’s going on
Bitcoin slipped significantly this week, dropping into the US$90,000–96,000 range, marking roughly a 10% decline for the week.
The decline has pushed BTC to trade around 20-25% below its all-time high of US$126,200.
On-chain data shows that long-term holders (those who typically h

BNB/USDT – Bullish Reversal Idea | Demand Zone Reaction📌 Overview
BNB is currently trading at a major higher-timeframe demand zone, showing early signs of accumulation after a sharp sell-off. Price has tapped the demand area multiple times and is holding without breaking structure to the downside.
This setup is based on a potential short-term reversal

See all editors' picks ideas
Count█ OVERVIEW
A library of functions for counting the number of times (frequency) that elements occur in an array or matrix.
█ USAGE
Import the Count library.
import joebaus/count/1 as c
Create an array or matrix that is a `float`, `int`, `string`, or `bool` type to count elements from, t

Holographic Market Microstructure | AlphaNattHolographic Market Microstructure | AlphaNatt
A multidimensional, holographically-rendered framework designed to expose the invisible forces shaping every candle — liquidity voids, smart money footprints, order flow imbalances, and structural evolution — in real time.
---
📘 Overview
The Hol

PriceFormatLibrary for automatically converting price values to formatted strings
matching the same format that TradingView uses to display open/high/low/close prices on the chart.
█ OVERVIEW
This library is intended for Pine Coders who are authors of scripts that display numbers onto a user's charts. T

LogNormalLibrary "LogNormal"
A collection of functions used to model skewed distributions as log-normal.
Prices are commonly modeled using log-normal distributions (ie. Black-Scholes) because they exhibit multiplicative changes with long tails; skewed exponential growth and high variance. This approach i

Range Oscillator (Zeiierman)█ Overview
Range Oscillator (Zeiierman) is a dynamic market oscillator designed to visualize how far the price is trading relative to its equilibrium range. Instead of relying on traditional overbought/oversold thresholds, it uses adaptive range detection and heatmap coloring to reveal where pri

Volume Surprise [LuxAlgo]The Volume Surprise tool displays the trading volume alongside the expected volume at that time, allowing users to spot unexpected trading activity on the chart easily.
The tool includes an extrapolation of the estimated volume for future periods, allowing forecasting future trading activity.
🔶 U

Smooth Theil-SenI wanted to build a Theil-Sen estimator that could run on more than one bar and produce smoother output than the standard implementation. Theil-Sen regression is a non-parametric method that calculates the median slope between all pairs of points in your dataset, which makes it extremely robust to o

Fair Value Gaps by DGTFair Value Gaps
A refined, multi-timeframe Fair Value Gap (FVG) detection tool that brings institutional imbalance zones to life directly on your chart.
Designed for precision, it visualizes how price delivers into inefficiencies across chart, higher, and lower (intrabar) timeframes — offering a fl

TASC 2025.11 The Points and Line Chart█ OVERVIEW
This script implements the Points and Line Chart described by Mohamed Ashraf Mahfouz and Mohamed Meregy in the November 2025 edition of the TASC Traders' Tips , "Efficient Display of Irregular Time Series”. This novel chart type interprets regular time series chart data to create an ir

Simplified Percentile ClusteringSimplified Percentile Clustering (SPC) is a clustering system for trend regime analysis.
Instead of relying on heavy iterative algorithms such as k-means, SPC takes a deterministic approach: it uses percentiles and running averages to form cluster centers directly from the data, producing smoo

See all indicators and strategies
Community trends
UNOMINDA: Post-Breakout Retest - Setting Up For Wave 2
Price shows a text-book breakout and retest of a multi-month consolidation high, signaling a potential acceleration phase in the Auto Components space.
🔍 Technical Snapshot (3-Day Chart)
Metric: Breakout Zone
Value: ₹1,180–₹1,250
Interpretation: Critical horizontal resistance flipped to suppo
BUY TODAY SELL TOMORROW for 5%DON’T HAVE TIME TO MANAGE YOUR TRADES?
- Take BTST trades at 3:25 pm every day
- Try to exit by taking 4-7% profit of each trade
- SL can also be maintained as closing below the low of the breakout candle
Now, why do I prefer BTST over swing trades? The primary reason is that I have observed that

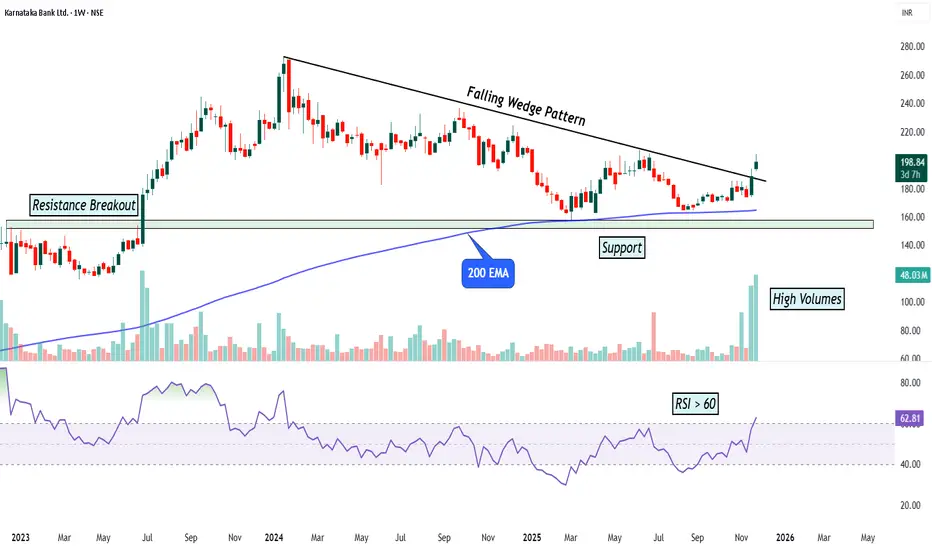
KTKBANK - Weekly Long Set upThis weekly chart highlights a long-term bullish setup forming after a previous resistance breakout. Following that breakout, the price moved into a prolonged correction and created a falling wedge pattern. Falling wedges are known for signaling potential upside reversals, especially when they occur
Ambuja Cement Weekly Price Action Analysis for Nov-Dec 2025On Weekly chart Ambuja Cement has closed at 547 on 20-Nov-25
Recent price action indicates the stock is struggling to go past 575-580 area.
It is likely to continue going down till its support major region of 505-475.
One can sell/short sell whenever the stock comes near 570 region. Keeping SL of 5
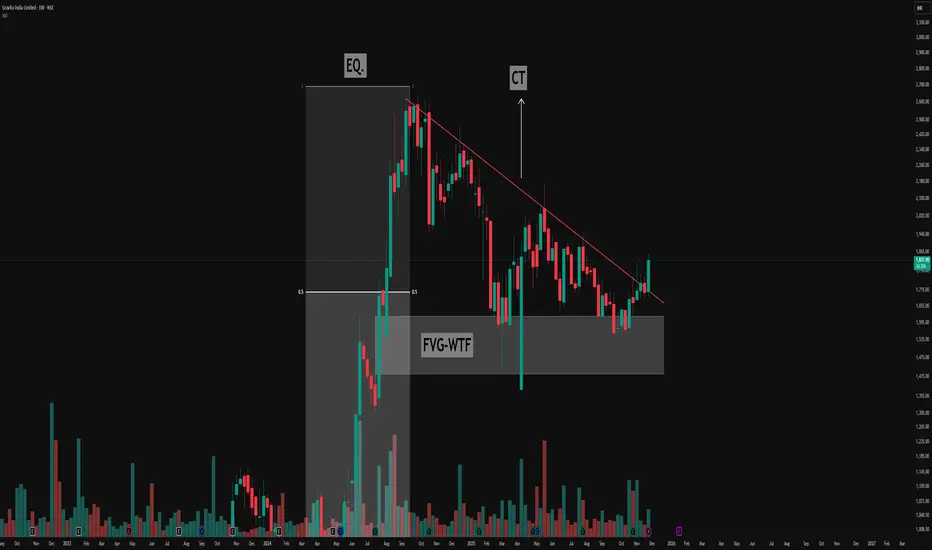
Decoding the Descending Triangle: Key Structure & FVG🔻Understanding the Pattern
- The chart above highlights a classic descending triangle pattern, easily visible by its series of lower highs (marked in red) and a relatively consistent demand zone acting as support.
- This resistance trendline (CT—Contraction Trendline) has been tested multiple times
Reliance- Breakout- Retest- New HighsHello Traders! May today bring clarity, clean setups, and confident execution.
Stay patient and stay profitable.
Reliance has delivered a clean weekly breakout above its horizontal swing resistance, a level that acted as a strong barrier for many weeks.
With this resistance now broken, the price ca

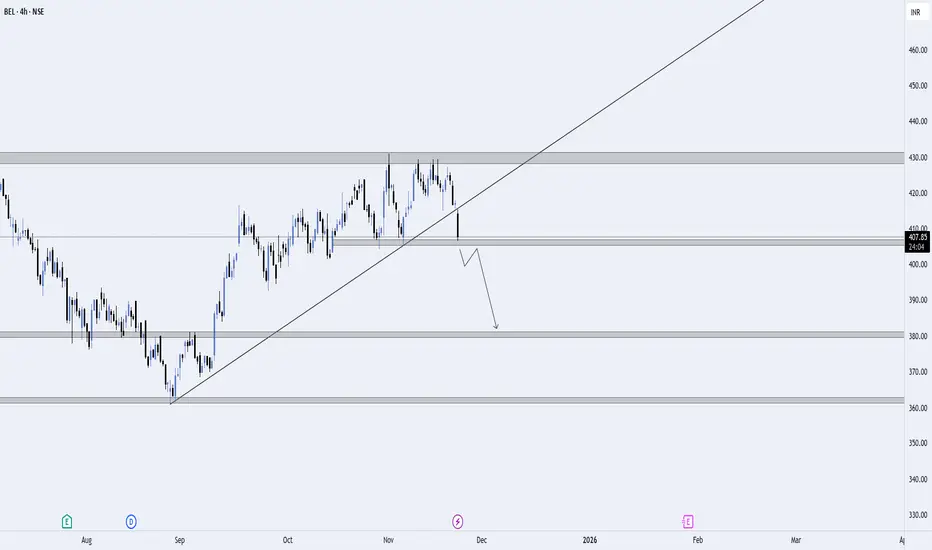
BEL – Trendline Breakdown & Supply Zone Rejection | Bearish SetuBEL has rejected strongly from the higher-timeframe supply zone around ₹425–₹430, followed by a clean trendline breakdown. This breakdown signals weakening bullish momentum and opens the door for a deeper correction.
📌 Key Highlights
Strong rejection from the major supply zone.
Clear trendline br
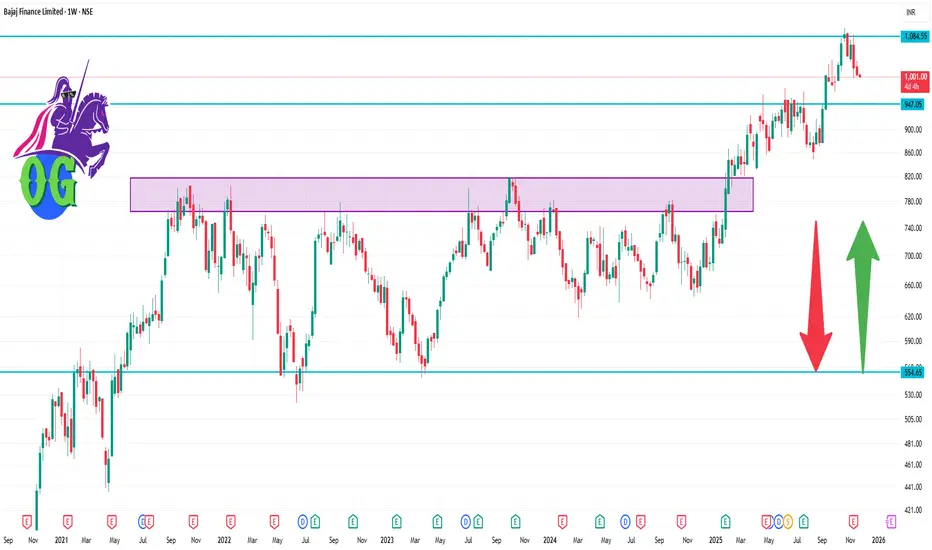
BAJFINANCE 1 Week Time Frame📊 Key Technical Levels
- Current price: ~ ₹1,004 (per Moneycontrol quote)
- Support zone:
~ ₹960-₹970 appears a meaningful near-term support (recent consolidation area)
If breakdown happens, a deeper support around ₹920-₹930 could become relevant
- Resistance zone:
~ ₹1,050-₹1,060 is the first h
Bearish Shark in SBICARD - For 950TF: 1 hour
CMP: 899
The set up exhibits Bearish shark setup and it could potentially move towards the 950 zone in this leg up.
On the hourly chart, it has given a breakout in the first hour this morning (24th Nov).. a retest of the EMA or the breakout level is the ideal entry point
On the Dail

RELIANCE INDUSTRIES LTD:Likely Cup&Saucer Break OutRELIANCE: Trading at 1530-1540.
Trading above all its Critical moving averages even in weekly chart .
Moreover DEMA has given a golden cross over of 20DEMA in weekly chart shows the strength in the stock.
Reliance has for med a Cup& Handle pattern in weekly chart and RIL holding above 1540-1550 on c

See all stocks ideas
Community trends
Bitcoin's Death Cross is Here: A crash with a message to all!BITSTAMP:BTCUSD has just delivered one of its most significant reality ✔ checks of the year — the recent crash wasn’t simply a dip; it was a multi-layered market unwind that exposes the current fragility of the crypto ecosystem.
📉 Current Bitcoin Situation: “From Euphoria to Uncertainty”
Bitcoi

If you ignore this than it's your choice INDEX:BTCUSD
I am also shocked
every November closed in green in Year on year based than november near to end then it means v shape bounce is ready to in 6 days
please do your own research before taking any trade.
i am not financial advisor
risk is real stay practical
please feel free to ask a

BTC Wave 4 Bounce Looks Like a Trap! Is it?BTC is still moving inside a clear corrective channel, with the current bounce likely forming wave 4 before one final drop toward the 1.618 extension near 79,650 . The highlighted red zone shows a potential trap area where price may lure traders into thinking a reversal has started. Until BTC break

$btc bitcoin All TARGET & resistance LEVEL 2025-2026
bitcoin Support/Resistance & all future TARGET level marked.
If you are here before Christmas, happy Profit Trailing :)
If you know, You know
want to Learn: Join X & let's conect


POI ? Point Of InterestPoint Of Interest
A Point of Interest is a specific price zone or level on the chart where institutional traders (smart money) are likely to have significant activity — such as placing liquidity, stopping out retail traders, or entering/exiting large positions.
Traders look for POIs to find high-p

Bitcoin Ready to hit New Low?BITCOIN QUICK UPDATE: LEVELS PLAYING OUT EXACTLY AS EXPECTED
As we mentioned earlier, the $88,600 FVG has now been fully filled, and CRYPTOCAP:BTC is currently trading below that zone.
Here’s what matters next:
🔹 If $85,000 holds as support → BTC likely pushes toward the next major Bearish Order

BTCUSD – Demand Zone Reaction & Trendline Reclaim | Bullish Setu📌 Key Highlights
Liquidity grab below previous lows triggered strong bullish momentum.
Clear demand zone reaction with buyers defending the same region multiple times.
Price has reclaimed the ascending trendline, showing a potential shift in short-term structure.
Now sitting in the retest zone,

Celo Usdt Trend BreakoutNamaste All. I will keep it easy and basic
Coin : BINANCE:CELOUSDT
-> Down Trend Line
-> Trend Line Breakout
-> Wait For Horizontal Line Breakout
Once All Conditions Are Satisfied -> Plan Trade With Proper Risk : Reward
Note : Not Financial Tip #DYOR #SAFU #TradingView

Bitcoin buying recommended on Friday upmove continue AI data Parameters Data
Asset Name Bitcoin (BTC/USD)
Reason 🟥 Record ETF Outflows aur profit-taking (long-term holders dwara 800,000 BTC offload) ne major resistance $90K ke neeche pressure banaya hua hai.
R:R 🟨 N/A (Range-bound/High Risk) / Threshold: Breakout above - & Breakdown below
Current Trade 🟨
See all crypto ideas
Price Reversal Setup from Key Demand & Supply Zones”⚡ **Analysis:**
The price has entered a strong **Demand Zone**, marked by previous accumulation and sharp bullish reaction. Buyers have consistently defended this area, indicating strong institutional interest. Current candles show slowing bearish momentum + wick rejections.
📌 **Trade Plan:**
•
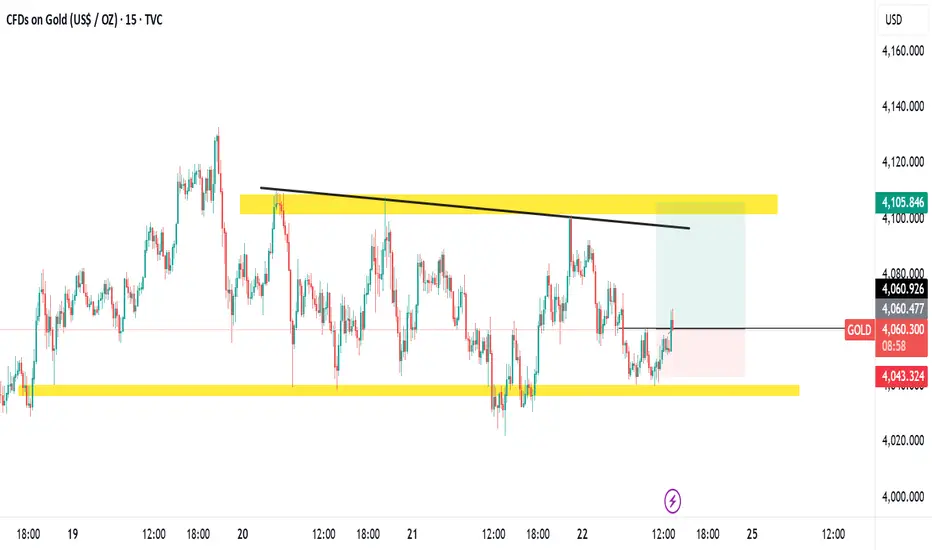
LiamTrading – XAUUSD H1 | Monday SetupLiamTrading – XAUUSD H1 | Monday Setup
Wait for gold to retest the upper trendline before choosing a direction
Quick Overview
On the H1 timeframe, gold is still moving inside a triangle pattern with a descending upper trendline and a gradually rising lower trendline. In my view, price still needs

Gold Trading Strategy for 24th November 2025✨ GOLD Trading Plan – Breakout Strategy (30-Min Candle)
🟢 BUY Setup (Long Trade)
Trigger: Enter only if the price closes above the high of the 30-minute candle at 4086.
Entry: Buy above 4086 after a confirmed candle close.
Targets:
🎯 Target 1: 4100
🎯 Target 2: 4115
🎯 Target 3: 4128
Stop-Loss Sugges

Brian – Gold Money Flow Map for the US Session TodayBrian – Gold Money Flow Map for the US Session Today
Technical analysis – trendline, FVG, and two clear scenarios
On H4, gold is still maintaining a medium-term uptrend line drawn from the end of October. The decline in the Asian session this morning was not strong enough to break the structure; t

xauusd has seeped swing lowprice has seeped swing low, although structure on 15m if bearish but price has seeped low and give us engulfing candle+fvg, so entering here is good idea, sl woud be at $4040.080 and tp would be at $4069.500. price can face resistance at 4058.300, but if it breaks this zone and manages to close abov

XAUUSD/GOLD 1H BUY PROJECTION 24.11.25(XAUUSD/GOLD 1H BUY PROJECTION – 24.11.25).
🔍 What the Chart Shows
Your chart displays a buy setup on the 1-hour timeframe with the following key elements:
🟦 1. Support Zone (S1)
Price is reacting from the horizontal support zone.
This zone aligns with the 1H uptrend line, adding confluence.
G

XAUUSD is skyrocketing after the Adam & Eve pattern!OANDA:XAUUSD is really interesting right now. The price seems likely to rise further after the formation of the Adam & Eve pattern. With such an easy-to-remember name, the Adam & Eve pattern is one of the most memorable. Below, I’ll explain the reasons and how to easily recognize it.
The Adam pat

HOW FAR WILL GOLD RISE?
1. MARKET CONTEXT
Yesterday, during the Asian and European sessions, gold prices mainly moved sideways – accumulating within a narrow range.
In the U.S. session, gold prices broke strongly through the 413X region and formed:
Inverse Head and Shoulders pattern (iH&S)
The upward structure returns

Gold Awaits PPI & GDP – Buy Dips, Sell Rallies🟡 XAU/USD – PPI & GDP Data to Define Range Expansion
🔍 Market Context
Gold remains range-bound between $4000–$4100, consolidating after last week’s liquidity sweep.
This week’s key U.S. data — Core PPI, Retail Sales, GDP, and Core PCE — will likely dictate the next major move.
Slight improvement in

Gold Analysis for upside movement. Gold trading in a sideways zone. buyer's liquidity has already been grabbed. targeting for
sell side pending liquidity.
See all futures ideas
NZDUSD - Mandelbrot Theorem 1:7 RRSome properties of the Mandelbrot set
This section summons some properties of the Mandelbrot set first without proof, then some statements are proved.
Theorem 3 (Symmetry) The Mandelbrot set is symmetric with respect to the real axis. This means, if a complex number $ z$ belongs to the mandelbro

USDINR breakout on day's chart-21Nov25On the daily chart a breakout has been seen in USDINR. Presenting a long term view in my analysis. It is following a parallel bracket movement. Good time to buy Dollar for another 1 year period for range between 91 to 92.
Analysis is for educational purpose, I am not a SEBI advicer.

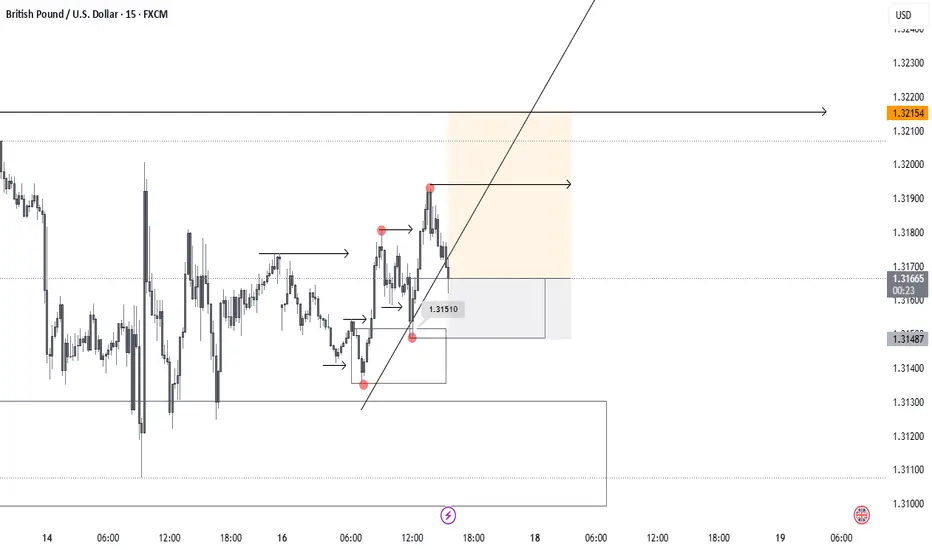
GU Intraday setup on GU
Going with the structure and bullish orderflow.
First target 4H high and will look to take some partials on 15min most recent high.
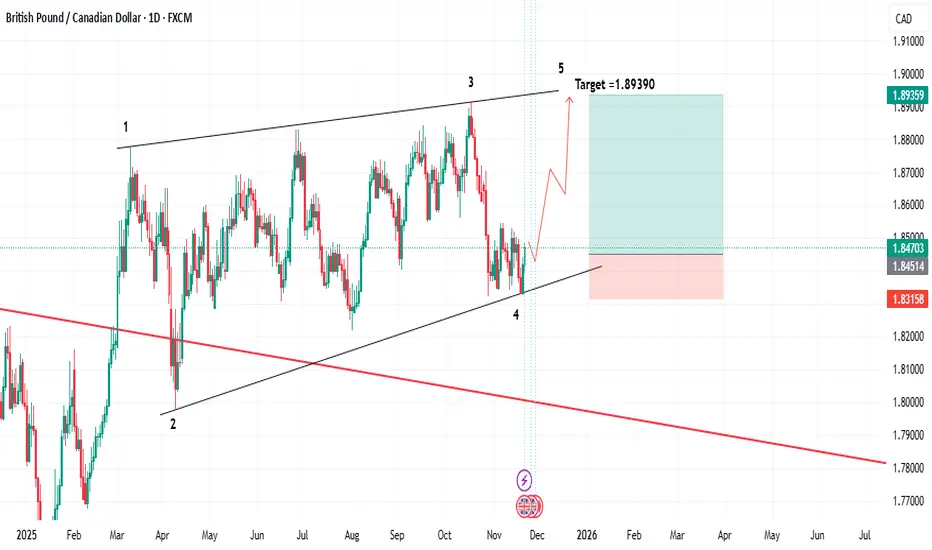
GBPCAD Bullish Setup in Daily Setup.Wave Analysis:
GBPCAD trying to cover the 5th wave of Diagonal. Bullish setup for an target of 1.89390.
USDJPY MULTI TIMEFRAME ANALYSIS Hello traders , here is the full multi time frame analysis for this pair, let me know in the comment section below if you have any questions , the entry will be taken only if all rules of the strategies will be satisfied. wait for more price action to develop before taking any position. I suggest yo

USD JPY will hit 172$LETS SEE WHAT HAPPENS THERE IS ALREADY TECHNICAL pattern breakout and target achievement is a bit tricky


In about an hour, UK Retail Sales data will be releasedIn about an hour, UK Retail Sales data will be released.
We’ve analyzed every report since 2022 to build this insight-packed dashboard showing how GBPUSD typically reacts within 4 hours after the print:
📊 Historical Breakdown (32 events total):
🔹 Bullish trend: 46.9% → 15 events
🔸 Bearish trend: 5

Flag Found in NZDUSDI was eyeing on NZDUSD for Bullish entry above its major support @ 0.5613.
Then I caught a flag pattern which indicates continuation towards 0.5515. This is also confirmed by its near major support at 0.5514.
The price retraced two times from 0.5514 on 9th April 2025 and 3rd Februrary 2025. It ena

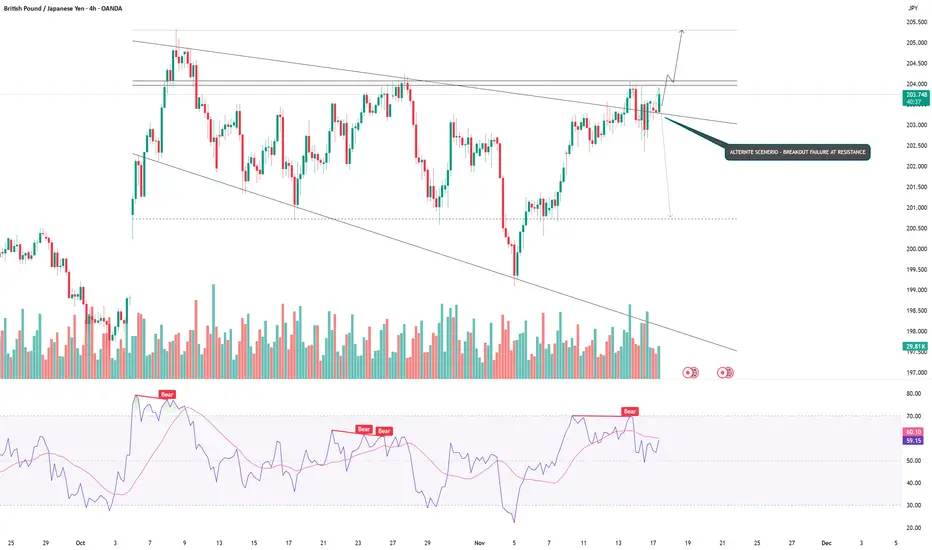
GBPJPY - BULLISH CONTINUATION OR REVERSAL?Symbol - GBPJPY
GBPJPY has broken the structure of the local downtrend amid persistent weakness in the Japanese yen. This shift opens the possibility for a continuation of the broader bullish trend.
The yen continues to depreciate, while the British pound maintains its upward trajectory. A breakou
See all forex ideas
| - | - | - | - | - | - | - | - | ||
| - | - | - | - | - | - | - | - | ||
| - | - | - | - | - | - | - | - | ||
| - | - | - | - | - | - | - | - | ||
| - | - | - | - | - | - | - | - | ||
| - | - | - | - | - | - | - | - | ||
| - | - | - | - | - | - | - | - | ||
| - | - | - | - | - | - | - | - | ||
| - | - | - | - | - | - | - | - |
Trade directly on the supercharts through our supported, fully-verified and user-reviewed brokers.


