Sambhv Steel Tubes cmp 121.45 by the Daily Chart since listedSambhv Steel Tubes cmp 121.45 by the Daily Chart since listed
- Support Zone 107 to 116 Price Band
- Breakout done from the Falling Price Channel
- Rising Price Channel taking upside momentum
- Volumes gradually picking up indicating continued uptrend
- Resistance Zone 125 to 135 Price Band then 1

The best trades require research, then commitment.
Get started for free$0 forever, no credit card needed

Scott "Kidd" PoteetThe unlikely astronaut

Where the world does markets
Join 100 million traders and investors taking the future into their own hands.

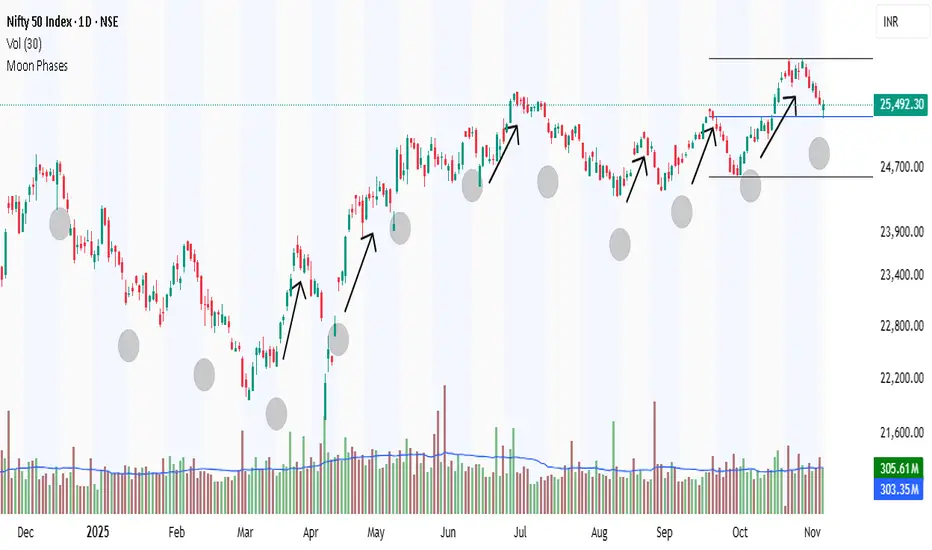
The Moon's phases are the changing mode (NIFTY)The Moon's phases are the changing shapes of the Moon's illuminated portion as seen from Earth, caused by its orbit around our planet. The Sun always lights half of the Moon, but our view of that lit half varies over a cycle lasting about 29.5 days (a synodic month). There are eight primary phases,
IDBI Bank and the Bullish Cup & Handle Pattern📈 Technical Analysis Spotlight: IDBI Bank and the Bullish Cup & Handle Pattern
In the world of technical analysis, chart patterns often serve as powerful indicators of potential price movements. One such pattern, the Cup and Handle, has recently emerged on the daily chart of IDBI Bank Limited, offer

Possible Nifty Resistance to supportMultiple bullish confluences in Nifty at current level is seen.
1. There is good resistance to support possible in Nifty nr ATH.
2. Good cup and handle pattern.
3. There is support nr weelky 20sma.
If nifty closes above Friday's high than it will trigger buy which can take nifty to 29000+ levels

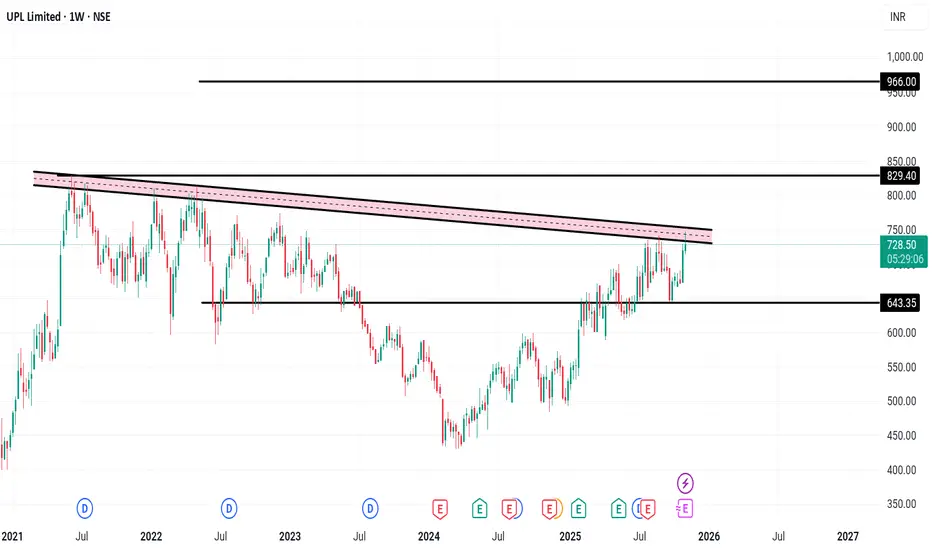
UPL Limited – Weekly Chart Analysis
📊 UPL Limited – Weekly Chart Analysis
Company Overview:
UPL Limited is a global leader in sustainable agricultural solutions, ranked among the top five agricultural solutions companies worldwide. The company operates across multiple countries, offering an integrated portfolio of patented and po
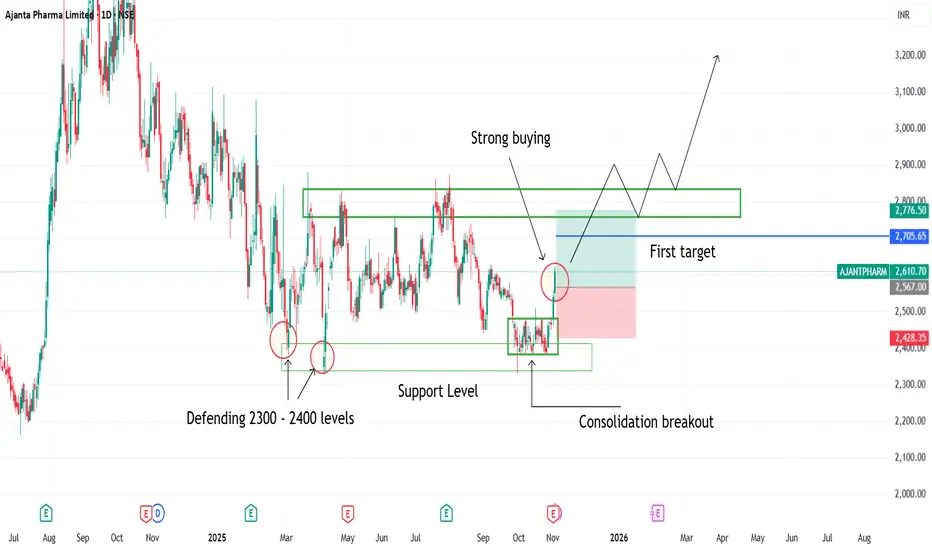
Consolidation breakout seen in ajanta pharma1. Consolidation breakout seen in ajanta pharma
2. Buyers defending 2300 2400 levels
3. Strong Bullish candles indicating strong buyers strength
4. Consolidation breakout has been happened on support levels
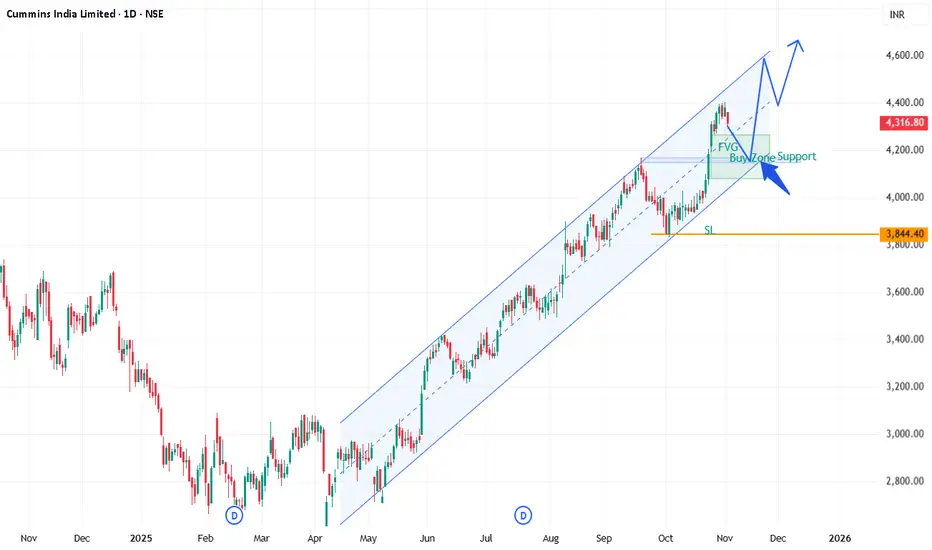
CUMMINSINDCUMMINSIND, Channel support, FVG entry, risk:reward 1:1.5
Cummins India Limited (CUMMINSIND) reported strong financial results for the second quarter (Q2) of FY 2025-26:
Revenue: ₹2,444 crore, up 31% YoY and 8% QoQ, driven by 47% domestic sales growth despite a 13% YoY export decline.
Net Prof
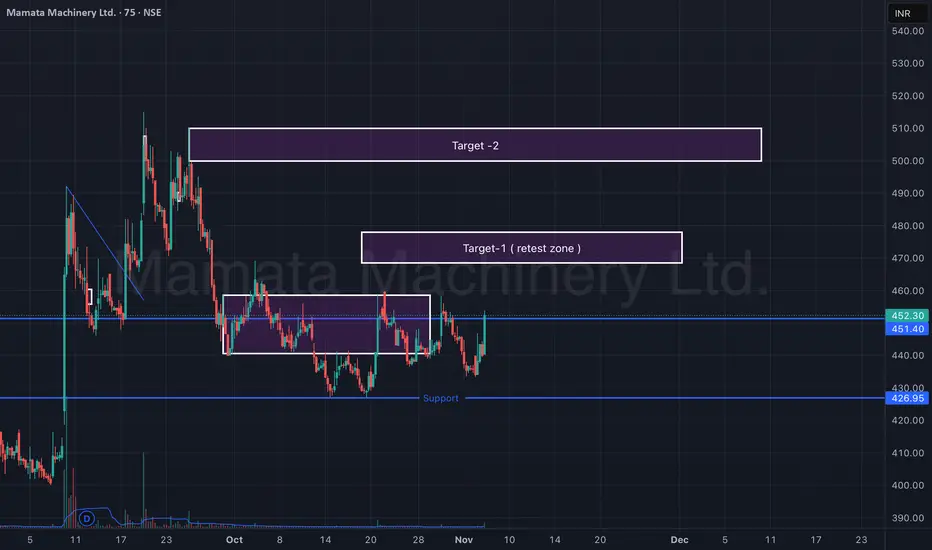
Mamata Machinery Ltd – Support Reversal & Retest Zone (75-min)Mamata Machinery is showing early signs of reversal from a strong support zone around ₹425–₹430. After forming a double-bottom-like structure, the stock has bounced sharply with rising volumes, indicating a possible short-term trend reversal.
Currently, price action is approaching a retest zone (Ta
KPILAscending Channel (Main Structure)
• The stock is trading within an upward-sloping channel, making higher highs and higher lows.
• The lower trendline acts as dynamic support, and the upper trendline as resistance.
Rectangle / Box Range (Recent Phase)
• Price consolidated between 1,220–1,310 for

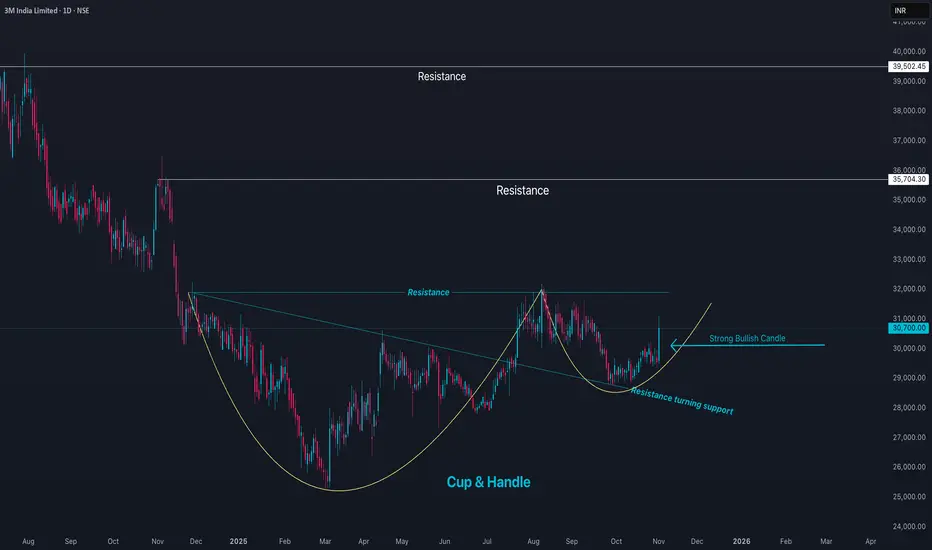
3MINDIA Price Action3M India Limited (3MINDIA) is currently trading around ₹30,865, marking a strong 4.4% rise in the latest session. The stock has a 52-week high near ₹37,133 and a low around ₹25,718, placing it closer to the upper end of its annual range. The market capitalization is approximately ₹33,300 crore.
3M
See all editors' picks ideas
PriceFormatLibrary for automatically converting price values to formatted strings
matching the same format that TradingView uses to display open/high/low/close prices on the chart.
█ OVERVIEW
This library is intended for Pine Coders who are authors of scripts that display numbers onto a user's charts. T

LogNormalLibrary "LogNormal"
A collection of functions used to model skewed distributions as log-normal.
Prices are commonly modeled using log-normal distributions (ie. Black-Scholes) because they exhibit multiplicative changes with long tails; skewed exponential growth and high variance. This approach i

Range Oscillator (Zeiierman)█ Overview
Range Oscillator (Zeiierman) is a dynamic market oscillator designed to visualize how far the price is trading relative to its equilibrium range. Instead of relying on traditional overbought/oversold thresholds, it uses adaptive range detection and heatmap coloring to reveal where pri

Volume Surprise [LuxAlgo]The Volume Surprise tool displays the trading volume alongside the expected volume at that time, allowing users to spot unexpected trading activity on the chart easily.
The tool includes an extrapolation of the estimated volume for future periods, allowing forecasting future trading activity.
🔶 U

Smooth Theil-SenI wanted to build a Theil-Sen estimator that could run on more than one bar and produce smoother output than the standard implementation. Theil-Sen regression is a non-parametric method that calculates the median slope between all pairs of points in your dataset, which makes it extremely robust to o

Fair Value Gaps by DGTFair Value Gaps
A refined, multi-timeframe Fair Value Gap (FVG) detection tool that brings institutional imbalance zones to life directly on your chart.
Designed for precision, it visualizes how price delivers into inefficiencies across chart, higher, and lower (intrabar) timeframes — offering a fl

TASC 2025.11 The Points and Line Chart█ OVERVIEW
This script implements the Points and Line Chart described by Mohamed Ashraf Mahfouz and Mohamed Meregy in the November 2025 edition of the TASC Traders' Tips , "Efficient Display of Irregular Time Series”. This novel chart type interprets regular time series chart data to create an ir

Simplified Percentile ClusteringSimplified Percentile Clustering (SPC) is a clustering system for trend regime analysis.
Instead of relying on heavy iterative algorithms such as k-means, SPC takes a deterministic approach: it uses percentiles and running averages to form cluster centers directly from the data, producing smoo

Adaptive Volume Delta Map---
📊 Adaptive Volume Delta Map (AVDM)
What is Adaptive Volume Delta Map (AVDM)?
The Adaptive Volume Delta Map (AVDM) is a smart, multi-timeframe indicator that visualizes buy and sell volume imbalances directly on the chart.
It adapts automatically to the best available data resolution

Dynamic Equity Allocation Model"Cash is Trash"? Not Always. Here's Why Science Beats Guesswork.
Every retail trader knows the frustration: you draw support and resistance lines, you spot patterns, you follow market gurus on social media—and still, when the next bear market hits, your portfolio bleeds red. Meanwhile, institution

See all indicators and strategies
Community trends
Sambhv Steel Tubes cmp 121.45 by the Daily Chart since listedSambhv Steel Tubes cmp 121.45 by the Daily Chart since listed
- Support Zone 107 to 116 Price Band
- Breakout done from the Falling Price Channel
- Rising Price Channel taking upside momentum
- Volumes gradually picking up indicating continued uptrend
- Resistance Zone 125 to 135 Price Band then 1
The Gann Fan is a powerful technical analysis tool (WIPRO)The Gann Fan is a powerful technical analysis tool created by W.D. Gann that combines price + time + geometry to identify support, resistance, and potential reversal points.
Your Wipro chart already has a perfectly drawn Gann Fan — let’s decode exactly how to use it step-by-step for real trading.
1.

Sharing my Secret Trading Mindset with Price actionIn this 18 minute video I will try to change the way you trade by sharing my trading experience using charts older than 3 months .

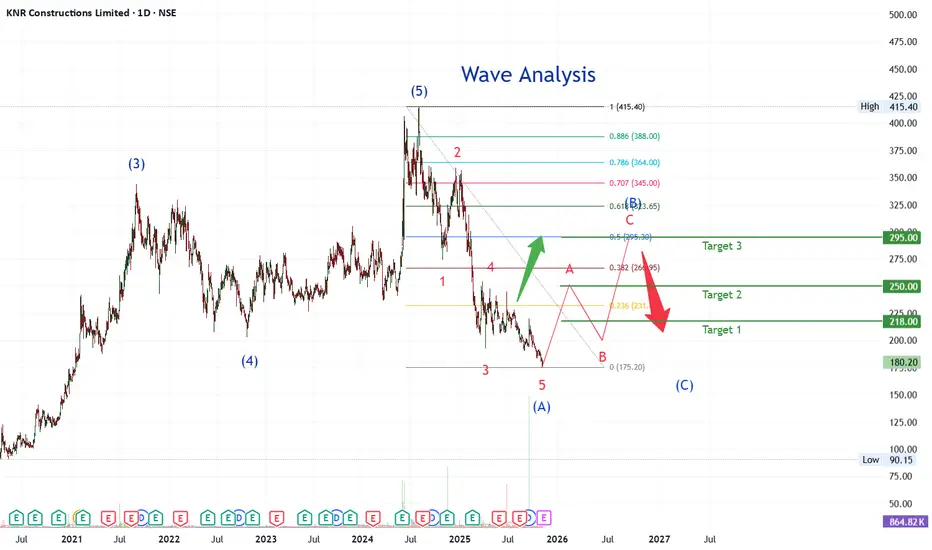
KNRCON LONGAccording to the Elliott Wave Theory, the Elliott Wave Structure describes the pattern and arrangement of price movements in financial markets.
Based on extensive analysis, it appears that the stock has completed waves (1) to (5) (Impulse wave) on the daily chart. corretive wave is unfolding in (A
Technical Analysis: M & B Engineering Ltd (NSE: MBEL)🧩 Chart Pattern
The stock has formed a Cup and handle pattern—a bullish continuation structure.
The cup depth is around 23% (from ₹588 to ₹476). T -588
Handle breakout occurred with strong volume, confirming institutional buying.
✅ Pattern Confirmation:
Breakout candle closed above ₹476 zone, va

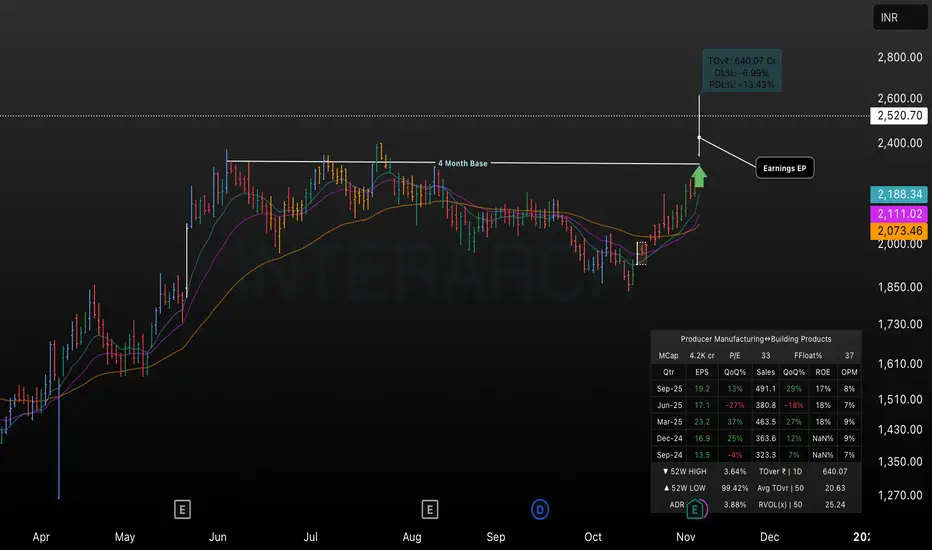
Interarch Stock Breakout Above 4-Month BaseThis TradingView chart highlights Interarch’s significant breakout above a 4-month consolidation base, with the price rallying to ₹2,520.70 (+14.87%). Key moving averages are displayed, and the breakout is supported by positive earnings momentum. The annotation indicates an earnings event driving th
View on THYROCAREThyrocare Technologies is trading in an upward channel after breaking its long-term downtrend. The stock recently retested the lower channel support near ₹1,340 and is showing signs of strength. A move above ₹1,411 could extend the rally toward previous highs, while ₹1,303 remains a key support zone

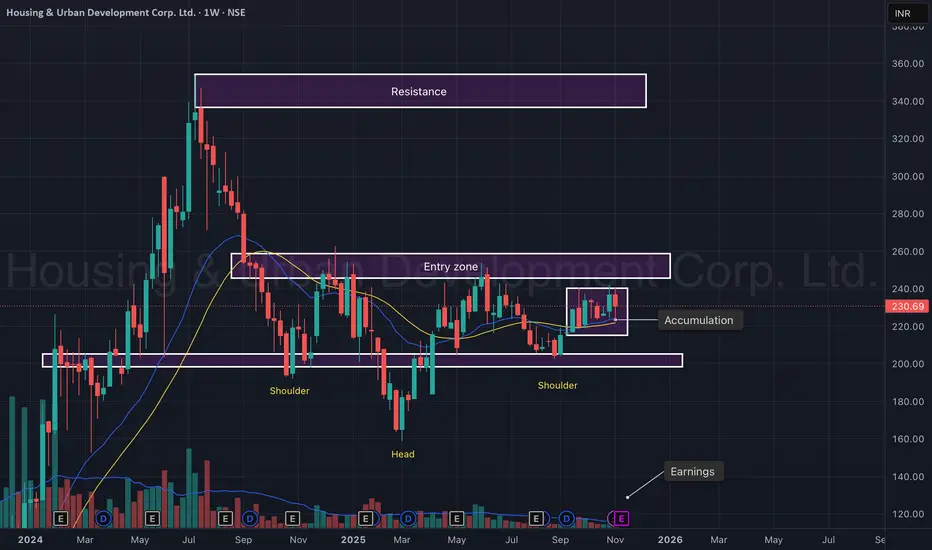
HUDCO – Inverted Head & Shoulders Pattern with Accumulation (W)HUDCO is showing a classic Inverted Head & Shoulders formation on the weekly chart, signaling a potential medium-term trend reversal after an extended consolidation phase. The stock has been forming higher lows since mid-2024, supported by steady volume accumulation.
The entry zone (₹225–₹235) is b
Lg Balakrishnan & Bros Limited - Breakout Setup, Move is ON...#LGBBROSLTD trading above Resistance of 1517
Next Resistance is at 2647
Support is at 1140
Here are previous charts:
Chart is self explanatory. Levels of breakout, possible up-moves (where stock may find resistances) and support (close below which, setup will be invalidated) are clearly define

SAIL ( W ) CUP & HENDAL PATTERN BREAKOUT● Add Your Watchlist ●
📊 Chart to Study For Swing Trading
➡️ STOCK NAME : SAIL
▫️Date : 10.11.25
🔸️ Pattern : Cup & Hendal
🔸️Timeframe : Weekly
🔸️Near Brekout Price
🔴 Chart is Only For Education Purpose

See all stocks ideas
Today
SYRMASyrma SGS Technology Limited
Actual
—
Estimate
2.86
INR
Today
EMAMILTDEmami Limited
Actual
—
Estimate
3.89
INR
Today
SIRCASirca Paints India Ltd.
Actual
—
Estimate
—
Today
ANUPAnup Engineering Ltd.
Actual
—
Estimate
15.00
INR
Today
CELLOCello World Limited
Actual
—
Estimate
3.70
INR
Today
BALAMINESBalaji Amines Limited
Actual
—
Estimate
—
Today
HCGHealthCare Global Enterprises Ltd.
Actual
—
Estimate
1.48
INR
Today
IRBIRB Infrastructure Developers Limited
Actual
—
Estimate
—
See more events
Community trends
#BITCOIN TECH UPDATE: BEARISH IN CONTROL#BITCOIN TECH UPDATE: BEARISH IN CONTROL
CRYPTOCAP:BTC is down 14% from $115K retest, clean rejection.
Trend remains bearish, structure forming lower highs & lower lows.
Key Zones:
Relief zone: $105K–$108K (short setup area).
Major support: $94K → break below = $76K next.
Momentum:
Selling pres

My Journal - 08/11/2025 - BTCUSDT Scalp Idea Price has tapped into H4 FVG and has formed a bullish SMT with ETH, a 1 to 2 RR Trade. Do your own research.

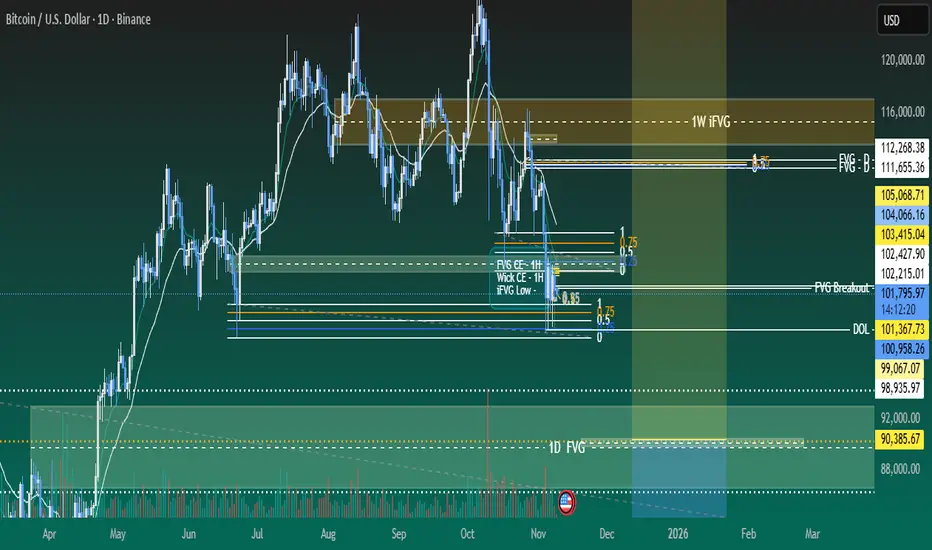
Weekly analysis BTC with 4R trade ideaLast weeks’ trade has performed well and already moved ~15K points and still going on. Further to this week analysis, we expect good reversal trade from the zone of 89700 to 90385. Still we have ~11k points movement pending to reach to this level. Price would be showing weakness in sell side and re
BTC/USD Bullish Pennant – Breakout Entry SetupBTC/USD Bullish Pe✅ BTC/USD Pennant Breakout – Technical Analysis
Chart Breakdown
The chart shows Bitcoin forming a bullish pennant pattern on the 45-min timeframe.
A pennant typically forms after a strong impulsive move (pole), followed by price compression between:
Descending trendline (upper)
Ascending/flat tre

Bitcoin_Short Elliot WaveBitcoin appears to be completing an ABC pattern, potentially reaching up to 106,000. I anticipate a downside move below 99,000 once it tests resistance around 106,000. A short position could be considered near that level with a tight stop-loss.Please do your own research before taking any trade deci

$BTC LongLooks like bottom is in and 4hrs timeframe looks pretty decent to me for the next move at least to 108K$ and that will be the area where i will be more cautious and look into the daily timeframe and if we manage to break above the daily OB i believe we will make a new ATH

Ethereum stat buying on dip 4140-4200 upside target open Ethereum start buying on dip, levels given on chart 4140-4200 upside target
How My Harmonic pattern projection Indicator work is explained below :
Recent High or Low :
D-0% is our recent low or high
Profit booking zone ( Early / Risky entry) : D 13.2% -D 16.1 % is
range if break them pro

BTC declining towards 98800scalping from 102350 to 98800
SL is 103250
around 3000 point down move possible
1:4 Ratio

Btc signals at it peak even on weekends This chart setup gives you best intraday setups for bitcoin with a min of 70% accuracy
One trade a day keeps poverty away and a lambo in your lawn ✅

ETHUSD SHOWING A GOOD UP MOVE WITH 1:10 RISK REWARDETHUSD SHOWING A GOOD
UP MOVE WITH 1:10 RISK REWARD
DUE TO THESE REASON
A. its following a rectangle pattern that stocked the market
which preventing the market to move any one direction now it trying to break the strong resistant lable
B. after the break of this rectangle it will boost the marke

See all crypto ideas
XAUUSDGold is in Last phase of clearing sell side liquidity. Wait for the price to hit the supply and show rejection. It can fall down to the temporary support or demand zone. Then again can built Sell side liquidity . Keep Patience. price might go down first before hitting the supply zone.

WTI Crude Oil 4H Analysis | Potential Long SetupAfter a prolonged downtrend inside a descending channel, Crude Oil has broken out and is now consolidating near the 0.5 Fibonacci retracement level.
🔹 Buying Zone 1: 59.30 – 58.80
🔹 Buying Zone 2: 57.40 – 56.70
🔹 Stop Loss (SL): Below 55.90
🔹 Target (TGT): 66.40
Technical Outlook:
The price is re

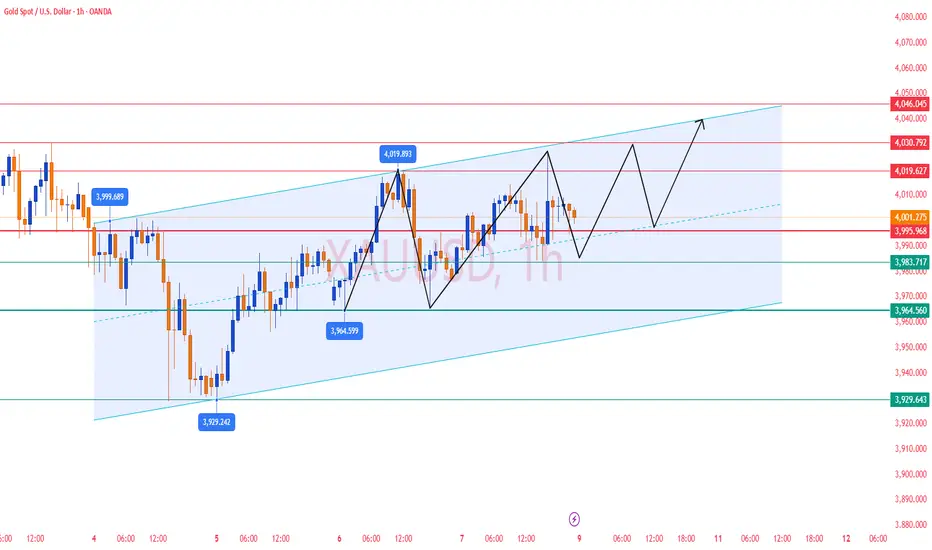
Gold Trading Strategy Reference for Next Week✅ Daily Chart Analysis
Gold has continued to fluctuate within a tight range, repeatedly surging and then pulling back sharply. The overall movement remains around the 4000 level, with 30–40 points of volatility. After a long period of consolidation, the market appears to be gathering momentum, sugge
Natural gas avoid buying at current price 345-340 best buy areaNatural gas avoid buying at current price levels given on chart .
How My Harmonic pattern projection Indicator work is explained below :
Recent High or Low :
D-0% is our recent low or high
Profit booking zone ( Early / Risky entry) : D 13.2% -D 16.1 % is
range if break them profit booking

StevenTrading – XAUUSD Next Week | Elliott Wave 5 & ...⚡️ StevenTrading – XAUUSD Next Week | Elliott Wave 5 & Resistance–Support (H4/M30)
📰 Fundamental Analysis
Gold holds around 4,000 USD thanks to safe-haven demand amidst macro uncertainties.
US consumer sentiment weakens; prolonged government shutdown risks increase defensive demand.
The market is

LiamTrading – XAUUSD D1 | Scenario for Week 2 of NovemberLiamTrading – XAUUSD D1 | Scenario for Week 2 of November
Accumulation range 4047–3928, prioritise buying on breakout – watch for short at 4200 (FVG + Fib 0.382)
Overview: After the correction from the historical peak, gold is forming a bottom – accumulating in the price box 4047–3928. The D1 stru

XAU/USD – Retest Before Takeoff📊 Market Structure
After several days of fluctuating within a narrow range, gold has finally broken through the main descending trendline extending from the peak of 4,108 USD.
Buyers are currently controlling the short-term structure by continuously creating BoS (Break of Structure) in the pric

Nifty touched my first target 25,691.See my Facebook page - Nifty without fear - for earlier chart prediction mentioning 25,691 as Nifty Future's first target if could cross 25,565. See chart with figures marked. New buy at 25,725 for 25,772. But 25,691 is crucial as only 25.725 will indicate a market reversal.

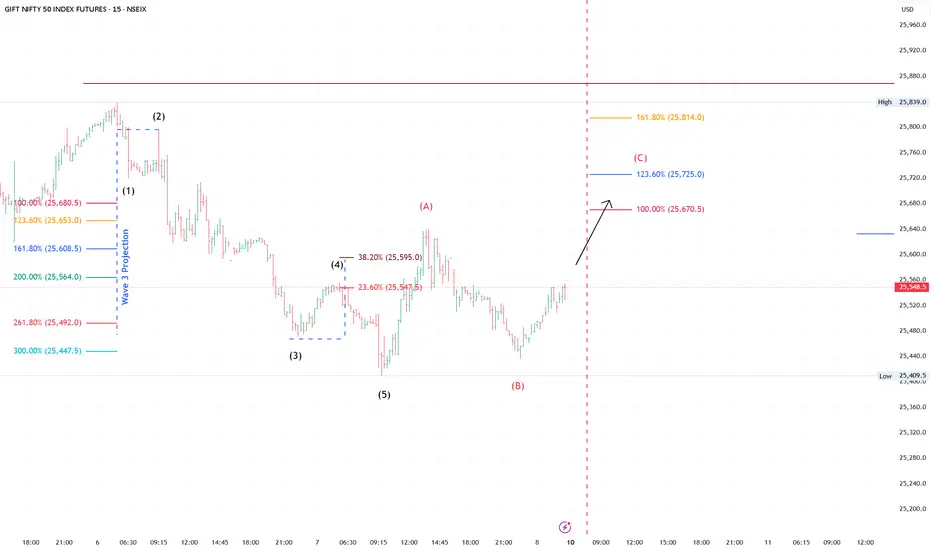
SGX Nifty – Elliott Wave Breakdown & Short Setup (15-Min Chart)SGX Nifty is on its way to complete Wave C correction around 100% - 123% range at level of 25,670 to 25,725.
Thereafter SGX Nifty may turn to Sideways to Bearish...
Plan accordingly.
GOLD LONG SSWING TRADEGOLD ANALYSIS 1 HOUR TF
What to Expect This Week
Early in the week
1. Gold may open slightly lower or stay near $4,000.
2. There’s a good chance it’ll dip a bit first — around $3,970–$3,960 — before going up again.
3. After that small drop, we could see a bounce back toward $4,050–$4,080.
4. If

See all futures ideas
Expected eurusd sell upto April 2026Long term expectations for eurusd
Forecasts suggest the EUR/USD pair is likely to remain under selling pressure until April 2026, with projections showing declines toward the 1.06–1.09 range before a potential rebound later in 2026.
TICKMILL:EURUSD
---
EUR/USD Sell Outlook up to April 2026

GBPUSD MULTI TIMEFRAME ANALYSIS Hello traders , here is the full multi time frame analysis for this pair, let me know in the comment section below if you have any questions , the entry will be taken only if all rules of the strategies will be satisfied. wait for more price action to develop before taking any position. I suggest yo

EURUSD Weekly Outlook - 10/11/205 to 14/11/2025Wassup Lads!
So this week we can see that EU closed sharply into the week rejecting the lows, there's a strong rejection candle on the weekly time frame and price has displaced higher forming a daily swing point and a daily fair value gap as well, so what I would be looking for price is to do this -

GBPJPYAs you can see price is clearly in an downtrend. Nice push to the downside, and nice recovery back up. And with 4 points being made ( H,L,HL,LL) downtrend is confirmed. I marked 4H supply that aligns with 202.000 handle.
While on the 4H is a downtrend, on daily timeframe, price is in a bullish leg

This is a GBP/JPY (4H) setup This is a GBP/JPY (4H) setup — a bearish structure with two target points clearly marked below the current price.
🧭 Chart Breakdown:
The price has broken below the ascending trendline and the Ichimoku Cloud, showing bearish momentum.
The first target point is at a nearby support level, and the se

EURUSD for next month.-> 7 NovPrice is reacting and seeing some `upward` moment before reaching to our `demand` zone.
Expecting a bull in next few week.

AUDUSD - SELLAUD/USD Sell Setup 🦘💵
📉 Primary Trade:
Sell @ 0.6502 — Previous day NY session high
Looking for rejection or liquidity grab around this level.
📉 Backup Trade:
Sell @ 0.6519 — Previous day London session high
Secondary zone if price breaks above NY high.

GBP AUD 0.01 LOT BUY 6/11/2025 23.35
📊 Forex Update (GBP/AUD)
मैंने 0.01 lot की Buy ली है, मार्केट सपोर्ट पर है।
2 दिन वेट करूंगा, अगला अपडेट जल्द दूंगा।
⚠️ Disclaimer: यह मेरी निजी राय है, निवेश सलाह नहीं।
👉 अपनी समझ से काम लें और पूरे भरोसे के साथ ट्रेड करें।
— Irshad Ali
---
📊 Forex Update (GBP/AUD)
Took Buy 0.01 lot, market n


AUDNZD - OVERBOUGHT CONDITIONS HINTING AT A POSSIBLE REVERSALSymbol - AUDNZD
CMP - 1.1485
AUDNZD continues to maintain its upward trajectory, supported by fundamental divergence between the two economies. The Australian dollar remains resilient and continues to outperform the New Zealand dollar after the RBNZ implemented an aggressive 50 basis point rate cu

See all forex ideas
| - | - | - | - | - | - | - | - | ||
| - | - | - | - | - | - | - | - | ||
| - | - | - | - | - | - | - | - | ||
| - | - | - | - | - | - | - | - | ||
| - | - | - | - | - | - | - | - | ||
| - | - | - | - | - | - | - | - | ||
| - | - | - | - | - | - | - | - | ||
| - | - | - | - | - | - | - | - | ||
| - | - | - | - | - | - | - | - |
Trade directly on the supercharts through our supported, fully-verified and user-reviewed brokers.


