Nifty 50 Analysis for Short and Long TermIn the video, few points that are discussed are :
Nifty 50 is sustaining on long term chart.
Nifty 50 is sideways to bearish on short term chart.
Check the past chart and control your emotions in short term up and down moves.
Your 2025 space mission is here
Suit up and get ready to explore every highlight of your trading galaxy.


CEAT LTD: Demand Is Quietly Winning This BattleThis chart tells a very classic supply–demand story where emotions and patience are clearly separated. On the surface, recent price action may look weak or confusing, but when you zoom out and read it through the lens of demand–supply and price action, the bigger picture becomes very clear.
🔥 High

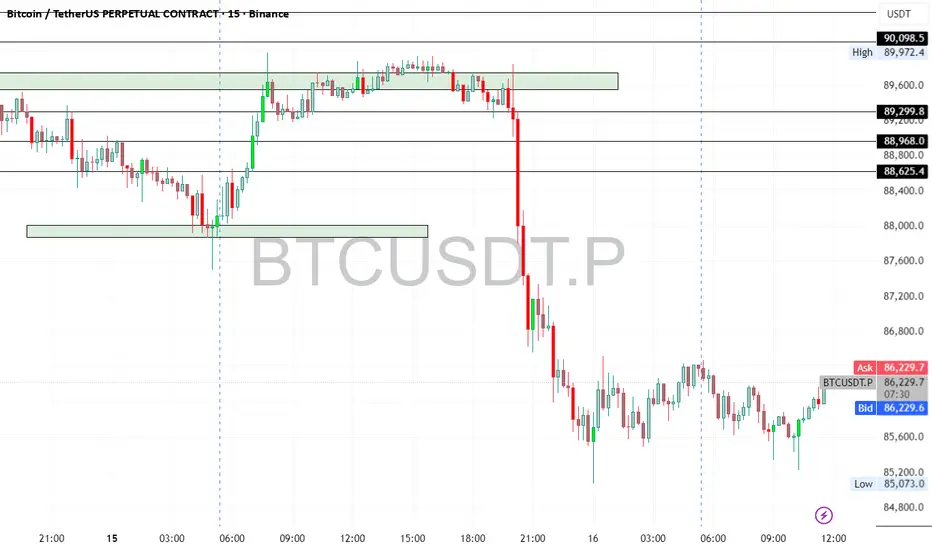
Bitcoin UpdateBTC is down ~2% today but has recovered from the lows and is holding above key support at $86,180 — showing strong respect for the trendline.
Key Levels:
🟢 Support: $86,180 → if this breaks, next major support is $75,000
🔵 Resistance: ~$92,000
🟩 Major Resistance: ~$100,000
Positioning:
I remain lo
RR Kabel Ltd | Volume Area High Breakout Setup RR Kabel is currently trading above the Volume Area High, indicating strong acceptance at higher levels. Price is hovering near a key resistance zone and showing signs of a potential breakout with volume expansion.
Technical View:
Acceptance above VAH → bullish bias
Strong base formation afte

Varun BeveragesDate 15.12.2025
Varun Beverages
Timeframe : Weekly Chart
About
(1) Varun Beverages has been associated with PepsiCo since the 1990s
(2) Operations spans 10 countries with franchise rights & distribution rights
Brands
(1) PepsiCo. franchised Brands - Pepsi, Tropicana, Slice, 7UP, Sting, Kurkure,

Nifty 50 Swing Trading setup - RRR 1:3Nifty swing trading setup analysis through Elliott wave Downside risk max 200 points target 600 point reaching possible on before 02/01/2026 maximum hold 2 weeks this setup useful for swing traders so go long at 25900-25800 Risk reward is good 1:3 Happy trading Journey

SJS looks like a good swing opportunitySJS enterprise has shown good strength in the recent volatile market. Strong closing above key EMA levels. Expecting prices to push higher as the stock is backed with strong fundamentals.

ICICIBANK – Bullish Setup (Short-Term)ICICIBANK – Bullish Setup (Short-Term)
ICICIBANK is showing strength and holding above key support.
Price action suggests a continuation move on the upside.
📈 Outlook: Bullish
🎯 Target: 1386 (short-term)
🛑 SL: Below recent swing low
Momentum looks positive; expecting price to move higher in the c

ACC | On the Verge of a Breakdown? | Daily Chart | Bearish Bias
📉 Summary
ACC has been compressing into a descending structure, forming Lower Highs since 24 April 2025, while holding Equal Lows near ₹1770 since 03 March 2025.
Repeated tests (4+ times) of the same support zone have reduced its strength, hinting at a potential breakdown setup.
Price action sugge

Angel One on the Edge: Long-Term Chart Points to 4800+The monthly chart of Angel One shows a well-defined broadening wedge pattern, where price has been repeatedly oscillating between a rising support line and a widening resistance zone. The structure has been forming for almost two years, indicating a long consolidation phase after a strong uptrend. C

See all editors' picks ideas
Multi-Ticker Anchored CandlesMulti-Ticker Anchored Candles (MTAC) is a simple tool for overlaying up to 3 tickers onto the same chart. This is achieved by interpreting each symbol's OHLC data as percentages, then plotting their candle points relative to the main chart's open. This allows for a simple comparison of tickers to tr

Vdubus Divergence Wave Pattern Generator V1The Vdubus Divergence Wave Theory
10 years in the making & now finally thanks to AI I have attempted to put my Trading strategy & logic into a visual representation of how I analyse and project market using Core price action & MacD. Enjoy :)
A Proprietary Structural & Momentum Confluence System

Per Bak Self-Organized CriticalityTL;DR: This indicator measures market fragility. It measures the system's vulnerability to cascade failures and phase transitions. I've added four independent stress vectors: tail risk, volatility regime, credit stress, and positioning extremes. This allows us to quantify how susceptible markets are

Volatility Risk PremiumTHE INSURANCE PREMIUM OF THE STOCK MARKET
Every day, millions of investors face a fundamental question that has puzzled economists for decades: how much should protection against market crashes cost? The answer lies in a phenomenon called the Volatility Risk Premium, and understanding it may fundam

Volume Gaps & Imbalances (Zeiierman)█ Overview
Volume Gaps & Imbalances (Zeiierman) is an advanced market-structure and order-flow visualizer that maps where the market traded, where it did not, and how buyer-vs-seller pressure accumulated across the entire price range.
The core of the indicator is a price-by-price volume prof

Match Finder [theUltimator5]Match Finder is the dating app of indicators. It takes your current ticker and finds the most compatible match over a recent time period. The match may not be Mr. right, but it is Mr. right now. It doesn't forecast future connection, but it tells you current compatibility for today.
Jokes aside,

Trend Line Methods (TLM)Trend Line Methods (TLM)
Overview
Trend Line Methods (TLM) is a visual study designed to help traders explore trend structure using two complementary, auto-drawn trend channels. The script focuses on how price interacts with rising or falling boundaries over time. It does not generate trade sign

Breakouts & Pullbacks [Trendoscope®]🎲 Breakouts & Pullbacks - All-Time High Breakout Analyzer
Probability-Based Post-Breakout Behavior Statistics | Real-Time Pullback & Runup Tracker
A professional-grade Pine Script v6 indicator designed specifically for analyzing the historical and real-time behavior of price after strong All-Ti

Count█ OVERVIEW
A library of functions for counting the number of times (frequency) that elements occur in an array or matrix.
█ USAGE
Import the Count library.
import joebaus/count/1 as c
Create an array or matrix that is a `float`, `int`, `string`, or `bool` type to count elements from, t

Holographic Market Microstructure | AlphaNattHolographic Market Microstructure | AlphaNatt
A multidimensional, holographically-rendered framework designed to expose the invisible forces shaping every candle — liquidity voids, smart money footprints, order flow imbalances, and structural evolution — in real time.
---
📘 Overview
The Hol

See all indicators and strategies
Community trends
CEAT LTD: Demand Is Quietly Winning This BattleThis chart tells a very classic supply–demand story where emotions and patience are clearly separated. On the surface, recent price action may look weak or confusing, but when you zoom out and read it through the lens of demand–supply and price action, the bigger picture becomes very clear.
🔥 High
Supreme Industries - Strong Weekly Demand Zone + Unfilled GapOn the weekly chart of Supreme Industries, price is approaching a strong confluence area near ₹3145 – ₹3200.
There are three major technical factors aligning at this zone 👇
1️⃣ Weekly Demand Zone:
Price has previously reversed from this area, showing strong buyer interest.
Now, once again, the pric

Adaniports As per the daily chart, price is moving within the channel. The price has faced resistance at the zone 1520 and is moving towards the lower trend line of the channel. It can take support from the 1480 zone.
If the price breaks the channel and sustains below 1465 zone, it means bears are gaining stre

SUPREMEIND High-Volume Reversal Attempt💹 Supreme Industries Ltd (NSE: SUPREMEIND)
Sector: Consumer Durables / Plastics | CMP: 3405.8
View: Neutral to Bullish — High-Volume Reversal Attempt
SUPREMEIND has witnessed a sharp corrective phase from its prior swing high near 4739, followed by a decisive reaction from the lower demand zone ar

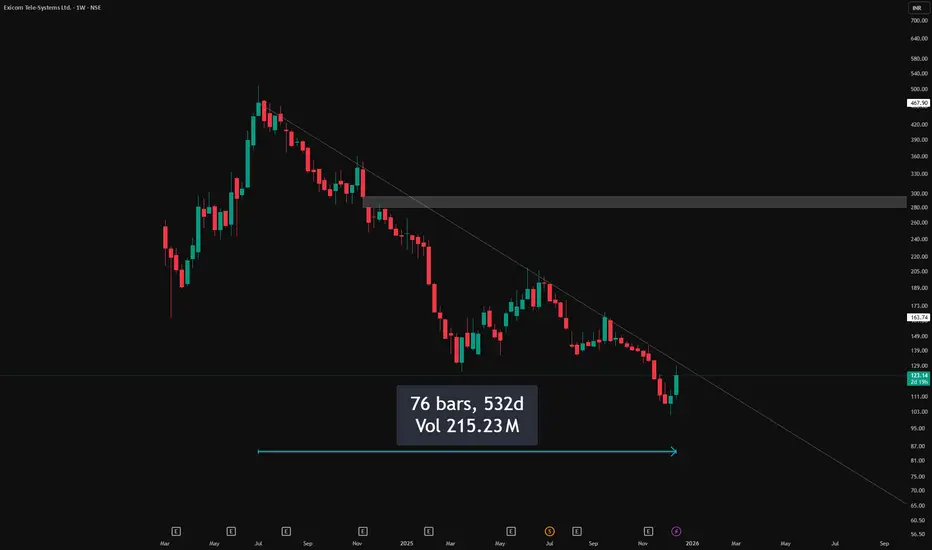
Clean Trendline Respect on Weekly Chart – 500 DaysPattern Context
Price has been respecting a well-defined descending trendline on the weekly timeframe, with each rally stalling below the previous swing high and reinforcing the broader lower‑high, lower‑low sequence.
Candlestick Behavior
Showing how supply continues to respond at the same diagonal
WABAG - Price Reversal from support zoneWABAG is bouncing back from support zone on daily time frame. Can expect risk reward ratio of 1:3.

GMR AIRPORT Please consult your financial advisor before investing.This is only for learning purpose of chart.
We are NISM certified EQ and MCX trader but not SEBI register investment advisor.
IF STOCK CROOSS THE LEVEL OF 115-119 MY TGT IS 135-142..
STOCK IS BEARISH BELOW 96-95..

PEL : Golden Retracement • Demand Reaction • Risk-Defined Trade📊 PRIMAL ENTERPRISES | 2H STRUCTURE-BASED SWING SETUP
Golden Retracement | Demand Reaction | Risk-Defined Trade
📌 Chart Context & Market Structure
Price has completed a strong impulsive decline from the prior swing high and is now reacting from the Golden Retracement Zone (Fib 50%–78%), whic

Praj Ind (D): Aggressive Bullish Rev, Value Buy at Major SupportTimeframe: Daily | Scale: Linear
After a brutal 11-month downtrend, the stock has staged a violent "V-shaped" recovery from a 4-year historical support zone. This move is backed by the highest volume in months, signaling a potential trend change or a significant relief rally.
🚀 1. The "Why" (Cat

Safe Enterprises Retail Fixtures LtdDate 17.12.2025
Safe Enterprises Retail Fixtures
Timeframe : 4 Hours Chart
About
It designs, manufactures, supplies, and installs shop fittings and retail fixtures, providing customized solutions across various retail segments such as fashion, electronics, and department stores.
Product Portfo

See all stocks ideas
No scheduled reports
Today
N
NEPHROPLUSNephrocare Health Services Limited
Exchange
BSE
Offer price
5.088
USD
Today
U
UNISEMUnisem Agritech Limited
Exchange
BSE
Offer price
0.70 - 0.72
USD
Today
M
MGCIUnisem Agritech Limited
Exchange
BSE
Offer price
0.70 - 0.72
USD
Today
2
2539Nephrocare Health Services Limited
Exchange
BSE
Offer price
5.088
USD
Today
S
SHIPWAVESShipwaves Online Limited
Exchange
BSE
Offer price
0.140
USD
Today
P
PARKHOSPSPark Medi World Limited
Exchange
BSE
Offer price
1.792
USD
Tomorrow
PANRHRS Aluglaze Ltd.
Exchange
BSE
Offer price
1.04 - 1.07
USD
Dec 19
S
SHOTAshwini Container Movers Limited
Exchange
NSE
Offer price
1.49 - 1.57
USD
Dec 19
E
EXIMROUTESExim Routes Limited
Exchange
NSE
Offer price
0.92 - 0.97
USD
Dec 19
2
2616ICICI Prudential Asset Management Company Ltd.
Exchange
BSE
Offer price
22.81 - 23.96
USD
See more events
Community trends
Bitcoin UpdateBTC is down ~2% today but has recovered from the lows and is holding above key support at $86,180 — showing strong respect for the trendline.
Key Levels:
🟢 Support: $86,180 → if this breaks, next major support is $75,000
🔵 Resistance: ~$92,000
🟩 Major Resistance: ~$100,000
Positioning:
I remain lo
ETH Next Prediction || CRYPTOETH is in a macro downtrend after rejection from the 4,700–4,800 zone. Price is trading below the weekly trendline and inside a descending channel.
RSI (Weekly):
RSI has rolled over from mid-range and is heading down → weak momentum No bullish divergence visible yet.
ETH broke down from a descend

XAUUSD GOLD Analysis on (16 Dec 2025)#XAUUSD UPDATEDE
Current price - 4287
Buy Limited - 4252-4236(Strong buy zone)
If price stay above 4218 then next target ,4300,4350 and 4380 and below that 4198
Plan;If price break 4252-4236 area,and stay above 4255,we will place buy order in gold with target of 4300,4350 and 4380 & stop loss sh

BTCUSDT at a Critical Crossroad: 84,670 Breakdown Could Trigger BTCUSDT Price Analysis: Is a Major Breakdown Coming?
🚨 Crypto traders, this is a level you cannot ignore.
BTCUSDT is hovering near a crucial support at 84,670 — and the market is showing signs of stress.
🔑 Why 84,670 Is So Important
This level is acting as a decision zone for Bitcoin.
If BTC hol

A Bullish Idea A relife Rally Idea, just an Idea
BTC has not been able to push lower. The Low has been stuck for 3 weeks. We think we might have broken the rising wage.
Ideas.
1. Might got to 91k - 98k. If you check the chart in 2021, exactly this kind of chart appeared, and BTC went straight to 69k from 41k. I

ETHUSD Bull Trap? - Final Breakdown Setup Is Almost Locked InETH is still stuck inside a clear falling channel, and the entire pattern is behaving like a corrective downtrend. The recent bounce from 2620 looks sharp, but it’s still just a counter-trend move. Nothing here screams trend reversal yet.
Wave 3 ending at 2620 , and now the price is rising for a

DIOGONAL BREAK DOWN OF ETHERIUMETHUSD – Ending Diagonal Completed, Wave 5 Reversal Underway
Ethereum has completed a classic ending diagonal at the top of Wave (5), and the structure has now broken down exactly as expected.
Price action showed:
Clear loss of momentum near the upper diagonal boundary
A final push that failed t

BTC USD Buy IdeaBTC USD Major Trend Bearish , Buy Looking for Shrtterm Pullback Buy Oppurtunities, Now The Entry at 86600 (At Support)SL at 86200(Support) Target at 88000 (Resistance)

BTC Weekly market update !BTC on the weekly just broke the uptrend line that’s been protecting price for months. When this happens on higher timeframes, the next move usually isn’t random — it often decides the next major leg.
📌 2. Pattern Overview
We’re looking at a weekly trendline break + shift in control. Buyers were co

BTC Weekly downtrend & Potential Reversal zoneson 27th Oct, BTC had its buyside sweep on Daily chart and later confirmed to be the Lower High for its weekly bearish trend reversal.
(Marked with grey arrow)
Earlier we had the bullish fib marking 2nd swing target of 124.4k & that marked the end of bullish trend in October this year.
With curren

See all crypto ideas
Crude oil break trand line lowerI think this is bounce back time this pattern all time repet 2021 to 2024 oct , nov dec down jan go gap next 3 candle is go up side next target and liquid is 5400,5600,6000 .

MCX COPPER: RSI Overheated – Prepare for the Final ClimaxTicker: COPPER1! Timeframe: Weekly (1W)
Key Observations
1. Wave Structure
MCX Copper is mirroring the global structure, confined within a perfect rising channel.
The market is in the final stages of Wave 5.
2. The RSI Warning (Crucial)
RSI is at 81.15: This is an extreme "Overbought" reading.
I

XAU/USD: Rejected at Sell, Awaiting Support Reaction◆ Market Context (M30)
Price has twice swept Liquidity Sell around the peak area but failed to hold, indicating weakening buying pressure at premium. Previously, the market had a Liquidity Sweep + Trap at the bottom, then created an upward BOS, so the current decline is seen as a rebalancing pullbac

XAUUSD – Lana Prefers SELL, BUY Only for Short-Term ScalpingXAUUSD – Lana Prefers SELL, BUY Only for Short-Term Scalping 💛
Quick Summary
Short-term trend: Downward pressure dominates
Timeframe: H1
Strategy: Focus on SELL; BUY only for quick scalping at liquidity zones
Note: Today features multiple US data releases and events, so volatility may be higher

Gold Bulls Eye Major Resistance – Can They Break Through?Gold continues to trade in an upward trend, recovering strongly from recent lows. On the 4-hour chart, price is moving closer to a falling resistance trendline, which has acted as a major barrier in the past. This makes the upcoming resistance zone very important for short-term traders.
The next ke

Gold Trading Strategy for 17th December 2025## 🟡 GOLD (XAU/USD) – Intraday Trading Strategy 💰
### 📈 BUY SETUP (Bullish Scenario) 🚀
🟢 **Buy Trigger:**
* Enter **BUY** only **above the HIGH of the 30‑minute candle**
* Candle must **CLOSE above $4320** ⏱️
✅ **Confirmation Logic:**
* Strong bullish candle close above resistance
* Indicates bu

silver spot viewsilver spot cmp 62.70 is in 3 wave
4 wave 47.00, 43.00, 39.00, 35.00 take support continue 5 wave
65.00 above monthly close or sustain strongly is sl
view is only study purpose only , we are not recommend any trade or investment

XAUUSD ANALYSISI am posting a chart of XAUUSD this is the possible outcomes of the wave as per myview
3rd wave is completed and the current xauusd is in correction we can see abc correction on longterm as per trukit last wave now we can see trendline liquidity is need to be taken and in upcoming days we can see go

mcx natural gas brekaout updatemcx natural gas drag down 350 near@ after made high 490@ now some possibilities here on chart--
natural gas breakout point as per chart expert 365@ if sustain abv or close above than expect 385--400--430 after break out will see rock hard buy
if break structure 350@ than again dwn side 330--320 e


See all futures ideas
EURUSD Monthly View – Trendline Breakout Sustained, Weekly Flag EURUSD has already broken above the key trendline and sustained, confirming bullish momentum. On the monthly chart, the pair is testing the previous high — a clean breakout and sustained close above this level could trigger fresh long opportunities and mark the start of a new uptrend.
On the weekly

USDJPY – Potential for a Volatile End to the WeekIt’s the last full trading week of the year before the Christmas break but that doesn’t necessarily mean that FX markets will be quiet. The calendar is still packed full of important risk events, and when combined with the possibility for decreasing levels of liquidity into Friday’s close it could

NZDCADin NZDCAD based on trending bearish prise i take my trade.
perfect impulsive brake previous structure and restest the AOI zone.
tuching EMA in 1hr
not A+ setup but B+
creating the HEAD and SHOLDER patern on 2H TF.
lets see what happen.
pestionce is the key.

EUR/USD Decision PhaseEUR/USD Decision Phase
Recent candles indicate a slowdown in upside follow-through, implying that short-term positioning may be crowded. This pause does not immediately invalidate the broader constructive tone but introduces the risk of a corrective rotation as liquidity is rebalanced. The projecte

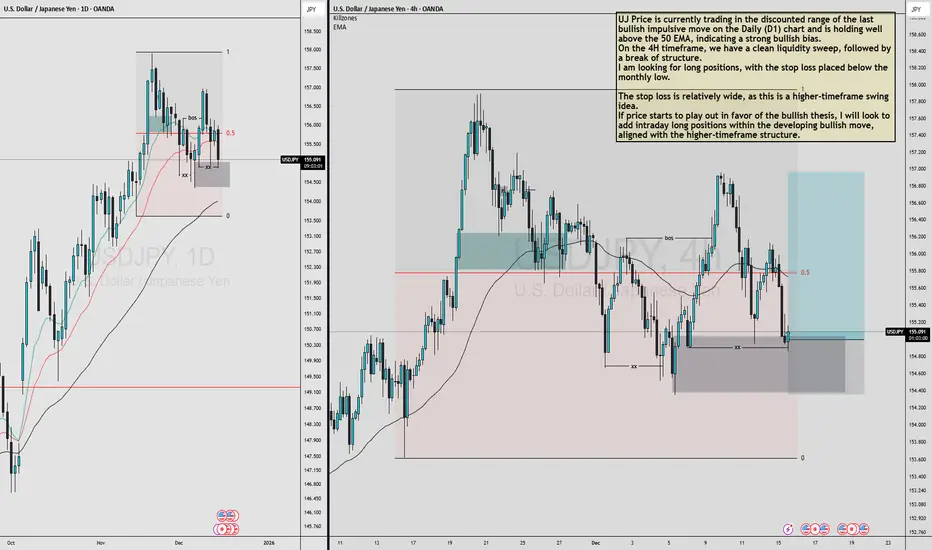
USDJPY MULTI TIMEFRAME ANALYSIS UJ Price is currently trading in the discounted range of the last bullish impulsive move on the Daily (D1) chart and is holding well above the 50 EMA, indicating a strong bullish bias.
On the 4H timeframe, we have a clean liquidity sweep, followed by a break of structure.
I am looking for long posit
AUD/CAD Bullish in Daily time frameTechnically : AUD/CAD is technically ready for bullish move. As the wave 1( impulse) followed by wave 2 (Correction), Wave 3 (impulse), followed by wave 4(Correction). Wave 5 Start will be determined by Fundamental connection.
Fundamental Data : CAD CPI will be published tomorrow. Based on the re

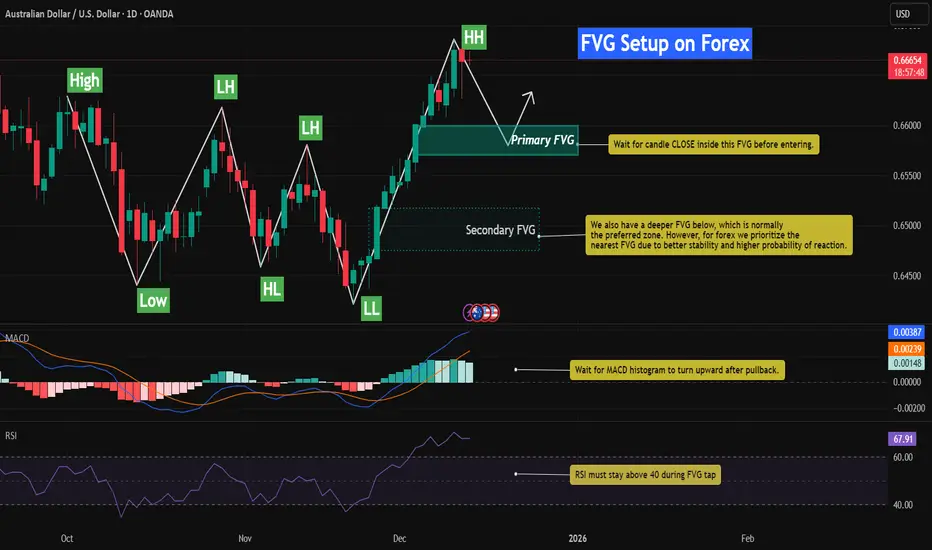
Bullish FVG Retracement With RSI & MACD📈 AUDUSD – Bullish FVG Retracement With RSI & MACD Momentum Confluence
This chart highlights a well-defined bullish structure on AUDUSD, characterized by a sequence of Higher Lows (HL) followed by a clean Higher High (HH). The latest impulsive leg upward created multiple Fair Value Gaps (FVGs), ea
USDJPY LONGprice came to retest the daily demand area and gave a ltf confirmation on 15.
study the reaction at marked levels

NZDUSD Short | 15m | Structural Breakdown After ExhaustionNZDUSD showed a clear loss of momentum after an extended upside leg. Price consolidated near the highs with diminishing impulsiveness, forming a distribution-style structure. The break back below the micro-range support confirmed weakness.
The short entry is based on:
• Rejection from the intraday

Eur cad trade A good resistance in EurCad if this resistance break and up move continue the good trade we will capture focus on level and patiencly wait for level breakthrough

See all forex ideas
| - | - | - | - | - | - | - | - | ||
| - | - | - | - | - | - | - | - | ||
| - | - | - | - | - | - | - | - | ||
| - | - | - | - | - | - | - | - | ||
| - | - | - | - | - | - | - | - | ||
| - | - | - | - | - | - | - | - | ||
| - | - | - | - | - | - | - | - | ||
| - | - | - | - | - | - | - | - | ||
| - | - | - | - | - | - | - | - |
Trade directly on Supercharts through our supported, fully-verified, and user-reviewed brokers.


