SAIL : LongTrend: The stock is forming a cup and handle pattern, which is a bullish continuation setup. It has broken out above the neckline around 140 levels, showing strength. The trend has turned positive after a long consolidation phase.
Volume: There is a clear increase in volume during the breakout, whi

The best trades require research, then commitment.
Get started for free$0 forever, no credit card needed

Scott "Kidd" PoteetThe unlikely astronaut

Where the world does markets
Join 100 million traders and investors taking the future into their own hands.

Bajaj Finserv: Resistance Breaks, Q2 Results Await🔍 Technical Analysis
Bajaj Finserv Limited has delivered an impressive super bullish rally since 2010, establishing itself as a blue-chip financial services stock. Multiple times since 2021, the stock faced resistance at the ₹2,000 level, which acted as a psychological and technical barrier.
Howe

Crompton | A Reversal Imminent?DISCLAIMER: This idea is NOT a trade recommendation but only my observation. Please take your trades based on your own analysis.
Points to note:
-----------------
1. RSI shows a bullish divergence with price.
2. The rejection of selling comes inside a Weekly Demand zone.
3. The high volume inside

Sobha- A breakout of consolidation is on cardsRealty sector has been performing well post Q2 results announcements.
Sobha has posted stellar Q2 numbers but it might be one off quarter as well.
Technically, stock is looking ripe for a good flag breakout of consolidation.
We might soon see a breakout coming but sustainment of breakout is crucial

Sambhv Steel Tubes cmp 121.45 by the Daily Chart since listedSambhv Steel Tubes cmp 121.45 by the Daily Chart since listed
- Support Zone 107 to 116 Price Band
- Breakout done from the Falling Price Channel
- Rising Price Channel taking upside momentum
- Volumes gradually picking up indicating continued uptrend
- Resistance Zone 125 to 135 Price Band then 1

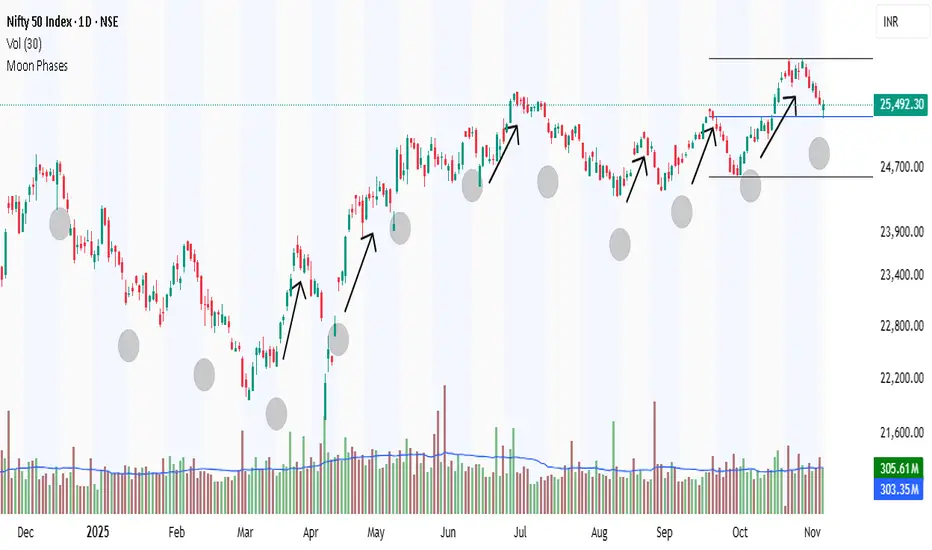
The Moon's phases are the changing mode (NIFTY)The Moon's phases are the changing shapes of the Moon's illuminated portion as seen from Earth, caused by its orbit around our planet. The Sun always lights half of the Moon, but our view of that lit half varies over a cycle lasting about 29.5 days (a synodic month). There are eight primary phases,
IDBI Bank and the Bullish Cup & Handle Pattern📈 Technical Analysis Spotlight: IDBI Bank and the Bullish Cup & Handle Pattern
In the world of technical analysis, chart patterns often serve as powerful indicators of potential price movements. One such pattern, the Cup and Handle, has recently emerged on the daily chart of IDBI Bank Limited, offer

Possible Nifty Resistance to supportMultiple bullish confluences in Nifty at current level is seen.
1. There is good resistance to support possible in Nifty nr ATH.
2. Good cup and handle pattern.
3. There is support nr weelky 20sma.
If nifty closes above Friday's high than it will trigger buy which can take nifty to 29000+ levels

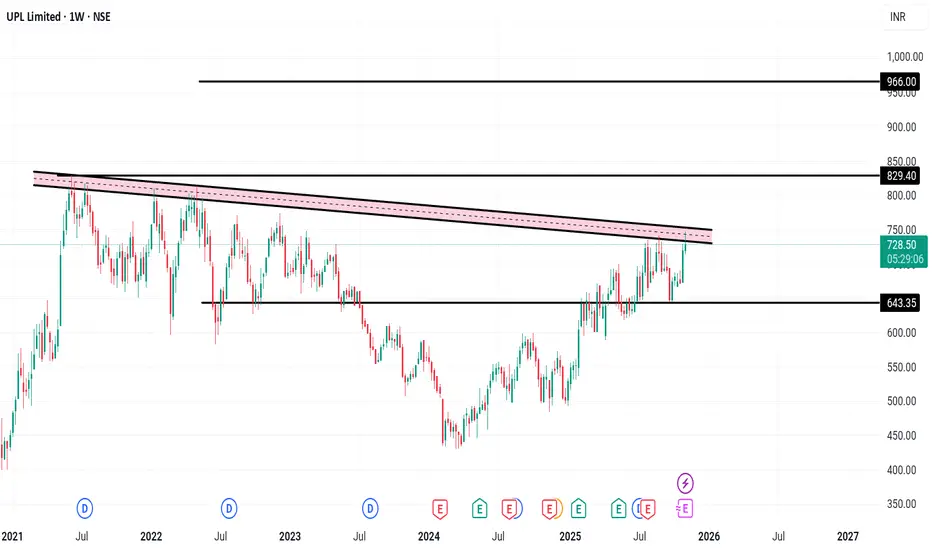
UPL Limited – Weekly Chart Analysis
📊 UPL Limited – Weekly Chart Analysis
Company Overview:
UPL Limited is a global leader in sustainable agricultural solutions, ranked among the top five agricultural solutions companies worldwide. The company operates across multiple countries, offering an integrated portfolio of patented and po
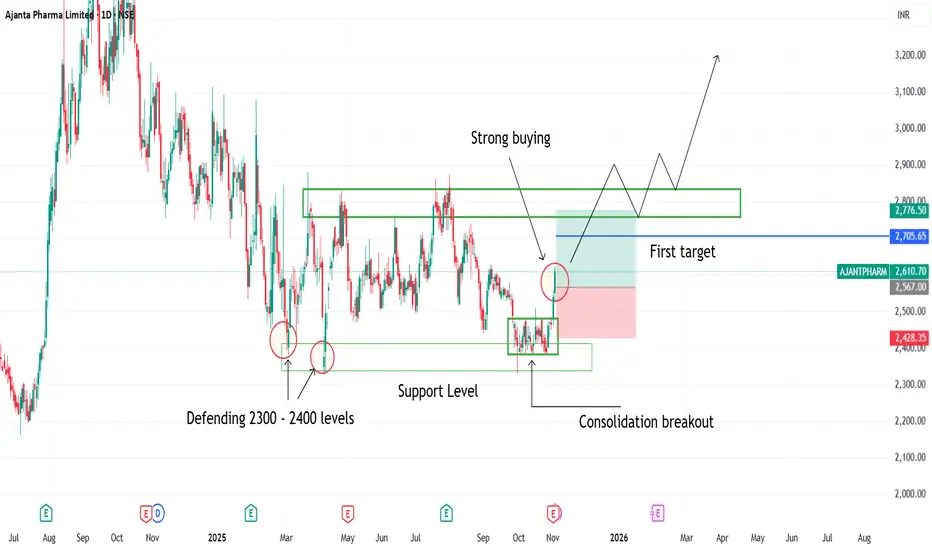
Consolidation breakout seen in ajanta pharma1. Consolidation breakout seen in ajanta pharma
2. Buyers defending 2300 2400 levels
3. Strong Bullish candles indicating strong buyers strength
4. Consolidation breakout has been happened on support levels
See all editors' picks ideas
PriceFormatLibrary for automatically converting price values to formatted strings
matching the same format that TradingView uses to display open/high/low/close prices on the chart.
█ OVERVIEW
This library is intended for Pine Coders who are authors of scripts that display numbers onto a user's charts. T

LogNormalLibrary "LogNormal"
A collection of functions used to model skewed distributions as log-normal.
Prices are commonly modeled using log-normal distributions (ie. Black-Scholes) because they exhibit multiplicative changes with long tails; skewed exponential growth and high variance. This approach i

Range Oscillator (Zeiierman)█ Overview
Range Oscillator (Zeiierman) is a dynamic market oscillator designed to visualize how far the price is trading relative to its equilibrium range. Instead of relying on traditional overbought/oversold thresholds, it uses adaptive range detection and heatmap coloring to reveal where pri

Volume Surprise [LuxAlgo]The Volume Surprise tool displays the trading volume alongside the expected volume at that time, allowing users to spot unexpected trading activity on the chart easily.
The tool includes an extrapolation of the estimated volume for future periods, allowing forecasting future trading activity.
🔶 U

Smooth Theil-SenI wanted to build a Theil-Sen estimator that could run on more than one bar and produce smoother output than the standard implementation. Theil-Sen regression is a non-parametric method that calculates the median slope between all pairs of points in your dataset, which makes it extremely robust to o

Fair Value Gaps by DGTFair Value Gaps
A refined, multi-timeframe Fair Value Gap (FVG) detection tool that brings institutional imbalance zones to life directly on your chart.
Designed for precision, it visualizes how price delivers into inefficiencies across chart, higher, and lower (intrabar) timeframes — offering a fl

TASC 2025.11 The Points and Line Chart█ OVERVIEW
This script implements the Points and Line Chart described by Mohamed Ashraf Mahfouz and Mohamed Meregy in the November 2025 edition of the TASC Traders' Tips , "Efficient Display of Irregular Time Series”. This novel chart type interprets regular time series chart data to create an ir

Simplified Percentile ClusteringSimplified Percentile Clustering (SPC) is a clustering system for trend regime analysis.
Instead of relying on heavy iterative algorithms such as k-means, SPC takes a deterministic approach: it uses percentiles and running averages to form cluster centers directly from the data, producing smoo

Adaptive Volume Delta Map---
📊 Adaptive Volume Delta Map (AVDM)
What is Adaptive Volume Delta Map (AVDM)?
The Adaptive Volume Delta Map (AVDM) is a smart, multi-timeframe indicator that visualizes buy and sell volume imbalances directly on the chart.
It adapts automatically to the best available data resolution

Dynamic Equity Allocation Model"Cash is Trash"? Not Always. Here's Why Science Beats Guesswork.
Every retail trader knows the frustration: you draw support and resistance lines, you spot patterns, you follow market gurus on social media—and still, when the next bear market hits, your portfolio bleeds red. Meanwhile, institution

See all indicators and strategies
Community trends
SAIL : LongTrend: The stock is forming a cup and handle pattern, which is a bullish continuation setup. It has broken out above the neckline around 140 levels, showing strength. The trend has turned positive after a long consolidation phase.
Volume: There is a clear increase in volume during the breakout, whi
Sobha- A breakout of consolidation is on cardsRealty sector has been performing well post Q2 results announcements.
Sobha has posted stellar Q2 numbers but it might be one off quarter as well.
Technically, stock is looking ripe for a good flag breakout of consolidation.
We might soon see a breakout coming but sustainment of breakout is crucial
Crompton | A Reversal Imminent?DISCLAIMER: This idea is NOT a trade recommendation but only my observation. Please take your trades based on your own analysis.
Points to note:
-----------------
1. RSI shows a bullish divergence with price.
2. The rejection of selling comes inside a Weekly Demand zone.
3. The high volume inside
Bullish- expecting much more to go aheadThis is my study and I may be 100% wrong. not recommended for investing.
As per my study on weekly time frame cup with handle pattern is formed and break out good volume as well as follow up candle and volume is very positive, I assume it will resume the breakout and will follow the same trend at l

Bajaj Finserv: Resistance Breaks, Q2 Results Await🔍 Technical Analysis
Bajaj Finserv Limited has delivered an impressive super bullish rally since 2010, establishing itself as a blue-chip financial services stock. Multiple times since 2021, the stock faced resistance at the ₹2,000 level, which acted as a psychological and technical barrier.
Howe
Trent Ltd – Double Zigzag Correction in PlayAfter topping out at ₹8,345, Trent has been locked in a larger corrective structure that now appears to be unfolding as a W–X–Y double zigzag on the weekly chart.
Wave Count
Wave W bottomed at ₹4,715 as a clear ABC.
The rally to ₹6,261 completed Wave X.
Price is now progressing in Wave Y, w

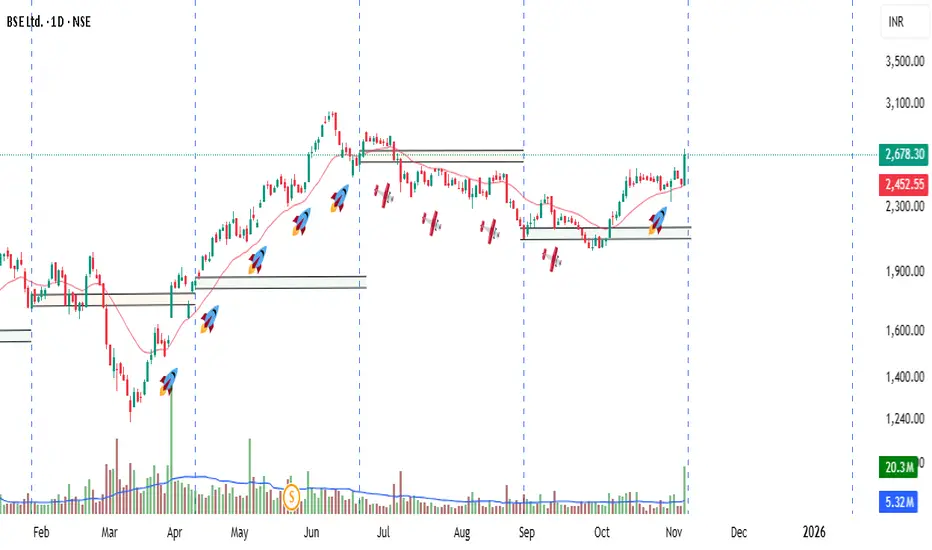
Time cycle as your line of control, this is its specialty (BSE)Time cycles are routines that allow you to map a stock movement by measuring the number of days or periods over which the stocks highs and lows occur. But this does not prove whether a reversal will occur in the next time cycle; it is only a possibility.
Regardless of the outcome, the candle formed
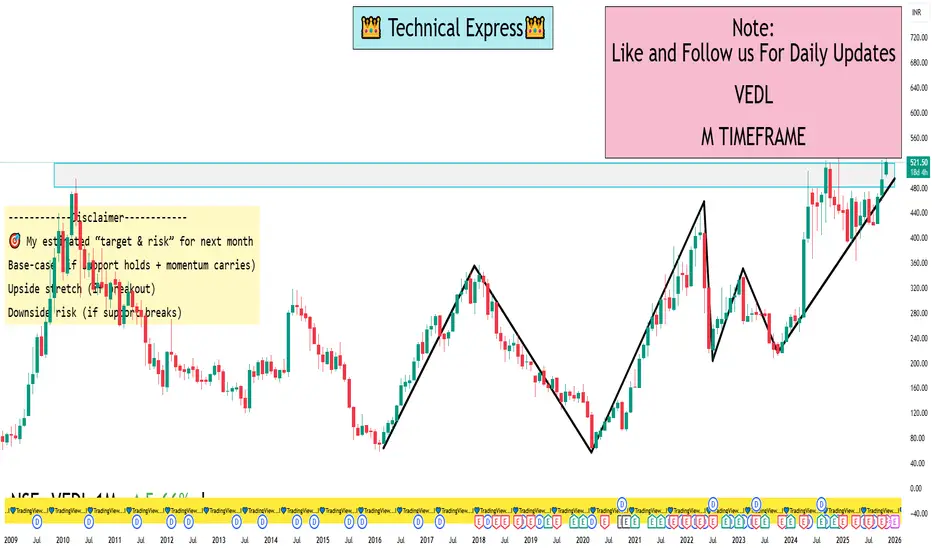
VEDL 1 Month View 📐 Key levels to watch (1-month horizon)
Support zones
Strong near-term support: ~ ₹ 503.
Next support layer: ~ ₹ 490-483 zone.
If broader breakdown: ~ ₹ 451-466 area (per monthly Fibonacci/Support).
Resistance zones
Immediate resistance: ~ ₹ 522-525.
🎯 My estimated “target & risk” for next m
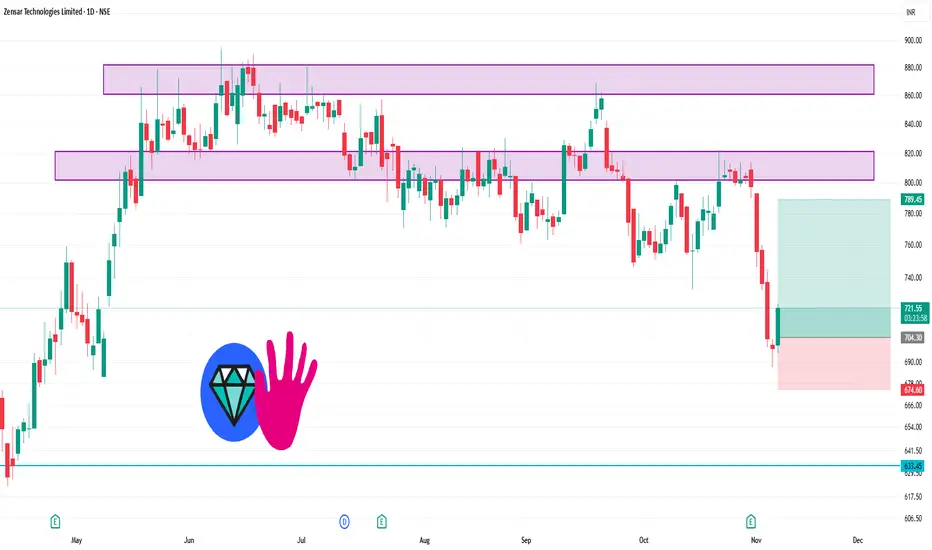
ZENSARTECH 1 Day Time Frame 🎯 Possible Trading Plan (for analysis only)
If bullish: Buy near ₹735–₹740 support with target ₹765 → ₹780 and stop-loss below ₹720.
If breakout: Above ₹780, momentum could extend toward ₹810–₹830 range.
If breakdown: Below ₹720, short-term weakness toward ₹700 possible.
Sambhv Steel Tubes cmp 121.45 by the Daily Chart since listedSambhv Steel Tubes cmp 121.45 by the Daily Chart since listed
- Support Zone 107 to 116 Price Band
- Breakout done from the Falling Price Channel
- Rising Price Channel taking upside momentum
- Volumes gradually picking up indicating continued uptrend
- Resistance Zone 125 to 135 Price Band then 1
See all stocks ideas
Tomorrow
TORNTPOWERTorrent Power Limited
Actual
—
Estimate
13.52
INR
Tomorrow
GMRP&UIGMR Power and Urban Infra Ltd
Actual
—
Estimate
—
Tomorrow
BOSCHLTDBosch Limited
Actual
—
Estimate
204.46
INR
Tomorrow
CENTUMCentum Electronics Limited
Actual
—
Estimate
—
Tomorrow
MOILMoil Limited
Actual
—
Estimate
2.60
INR
Tomorrow
FERMENTAFermenta Biotech Ltd
Actual
—
Estimate
—
Tomorrow
JYOTIRESJyoti Resins & Adhesives Ltd.
Actual
—
Estimate
—
Tomorrow
PURETROPPuretrop Fruits Ltd
Actual
—
Estimate
—
See more events
Community trends

#BITCOIN TECH UPDATE: BEARISH IN CONTROL#BITCOIN TECH UPDATE: BEARISH IN CONTROL
CRYPTOCAP:BTC is down 14% from $115K retest, clean rejection.
Trend remains bearish, structure forming lower highs & lower lows.
Key Zones:
Relief zone: $105K–$108K (short setup area).
Major support: $94K → break below = $76K next.
Momentum:
Selling pres

Weekly analysis BTC with 4R trade ideaLast weeks’ trade has performed well and already moved ~15K points and still going on. Further to this week analysis, we expect good reversal trade from the zone of 89700 to 90385. Still we have ~11k points movement pending to reach to this level. Price would be showing weakness in sell side and re
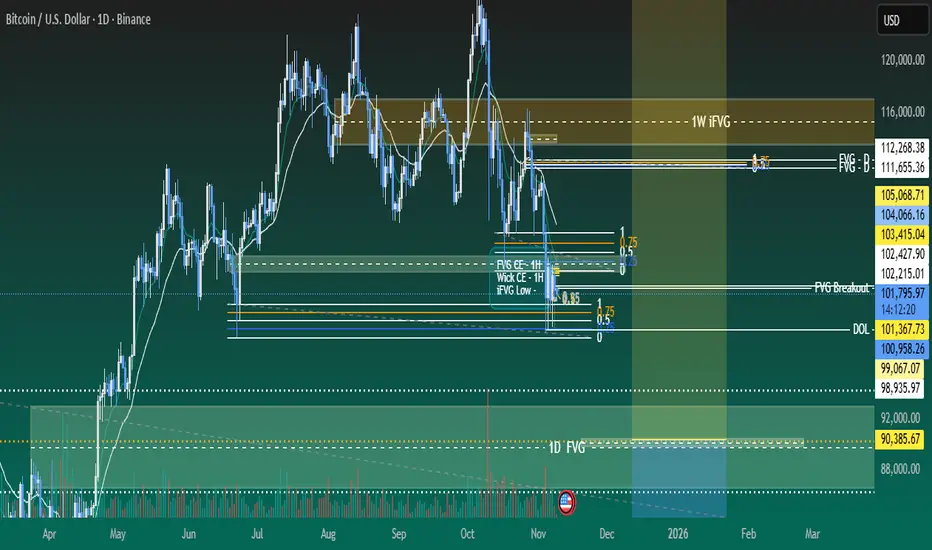
Fair Value Gap Retracements in a Downtrend📈 BTC/USD – Understanding Fair Value Gap Retracements in a Downtrend
The current market structure on the daily timeframe highlights a clear bearish trend, where price continues to form lower highs and lower lows.
After a strong downward impulse, a Fair Value Gap (FVG) has formed — representing an

ETHUSD SHOWING A GOOD UP MOVE WITH 1:10 RISK REWARDETHUSD SHOWING A GOOD
UP MOVE WITH 1:10 RISK REWARD
DUE TO THESE REASON
A. its following a rectangle pattern that stocked the market
which preventing the market to move any one direction now it trying to break the strong resistant lable
B. after the break of this rectangle it will boost the marke

Bitcoin_Short Elliot WaveBitcoin appears to be completing an ABC pattern, potentially reaching up to 106,000. I anticipate a downside move below 99,000 once it tests resistance around 106,000. A short position could be considered near that level with a tight stop-loss.Please do your own research before taking any trade deci

Btc signal 1900+ points captured in btc using the secret tools in tradingview
@TradingView thank you so much for making this easy 😀
#onetradeaday

BTC/USD Bullish Pennant – Breakout Entry SetupBTC/USD Bullish Pe✅ BTC/USD Pennant Breakout – Technical Analysis
Chart Breakdown
The chart shows Bitcoin forming a bullish pennant pattern on the 45-min timeframe.
A pennant typically forms after a strong impulsive move (pole), followed by price compression between:
Descending trendline (upper)
Ascending/flat tre

$BTC LongLooks like bottom is in and 4hrs timeframe looks pretty decent to me for the next move at least to 108K$ and that will be the area where i will be more cautious and look into the daily timeframe and if we manage to break above the daily OB i believe we will make a new ATH

BTC/USDT Timeframe (4-hour)BTC/USDT Timeframe (4-hour)
Current price: ≈ $105,845
My drawn:
A descending trendline (showing previous resistance)
Ichimoku Cloud, and
Two target points marked with green arrows.
---
🔍 Chart Interpretation
From my image:
Price has broken above the descending trendline.
It’s also movin

See all crypto ideas
Gold – Distribution Before DropGold – Distribution Before Drop
Gold is showing signs of exhaustion after the recent corrective bounce. The 3H market structure highlights a clear distribution pattern, as price continues to reject from the 4,100–4,250 supply zone. Repeated Break of Structure (BOS) signals that bearish momentum rem

Gold Trading Strategy Reference for Next Week✅ Daily Chart Analysis
Gold has continued to fluctuate within a tight range, repeatedly surging and then pulling back sharply. The overall movement remains around the 4000 level, with 30–40 points of volatility. After a long period of consolidation, the market appears to be gathering momentum, sugge
Gold Retests FVG Preparing for a New Uptrend, Target 4,120 USD📊 Market Structure
Gold has officially broken the bearish structure (BoS + ChoCH) by surpassing the 4,025 USD zone, confirming a significant shift in market momentum.
Following a series of consecutive BoS and a break of the downtrend line, the price is entering a balanced retest phase (FVG 4,03

XAUUSDGold is in Last phase of clearing sell side liquidity. Wait for the price to hit the supply and show rejection. It can fall down to the temporary support or demand zone. Then again can built Sell side liquidity . Keep Patience. price might go down first before hitting the supply zone.

LiamTrading – XAUUSD | Early Week Bullish Scenario...LiamTrading – XAUUSD | Early Week Bullish Scenario: Successful Box Breakout, Watch for Retest at 4056 & Deep Buy at 3998–4000
The price has just broken out of the accumulation box and accelerated as per the weekend scenario. Bullish inclination for the day, with a near-term target of 4080 → 4110; t

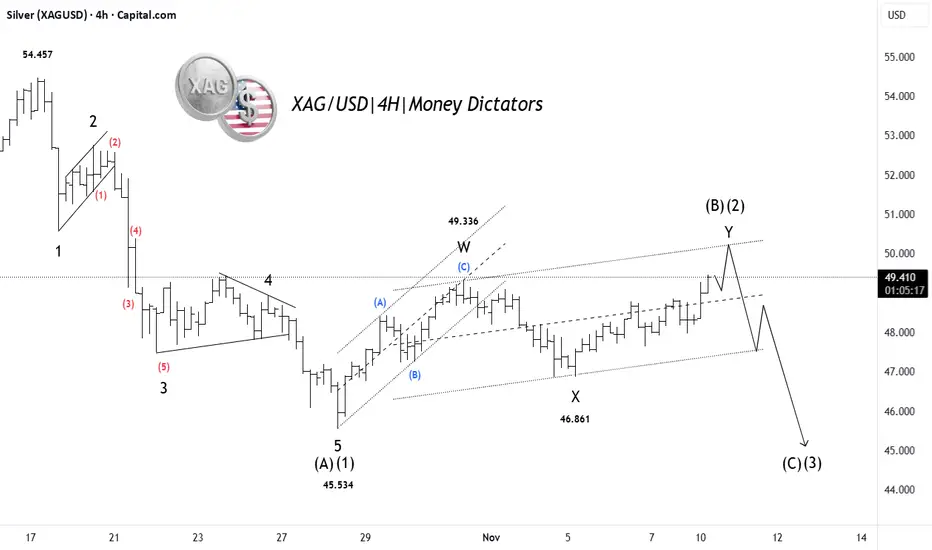
Silver Correction Ending: Major Drop AheadSilver (XAG/USD) has completed a 5-wave decline, marking the end of Wave (A)/(1) near the 45.53 level. Since then, price has been retracing upward in a complex W–X–Y corrective structure, which appears to be forming the final leg of Wave (B)/(2). The rise is losing strength near the upper channel, h
GOLD SHOWING A GOOD UP MOVE WITH 1:10 RISK REWARD GOLD SHOWING A GOOD UP MOVE WITH 1:10 RISK REWARD
DUE TO THESE REASON
A. its following a rectangle pattern that stocked the market
which preventing the market to move any one direction now it trying to break the strong resistant lable
B. after the break of this rectangle it will boost the market

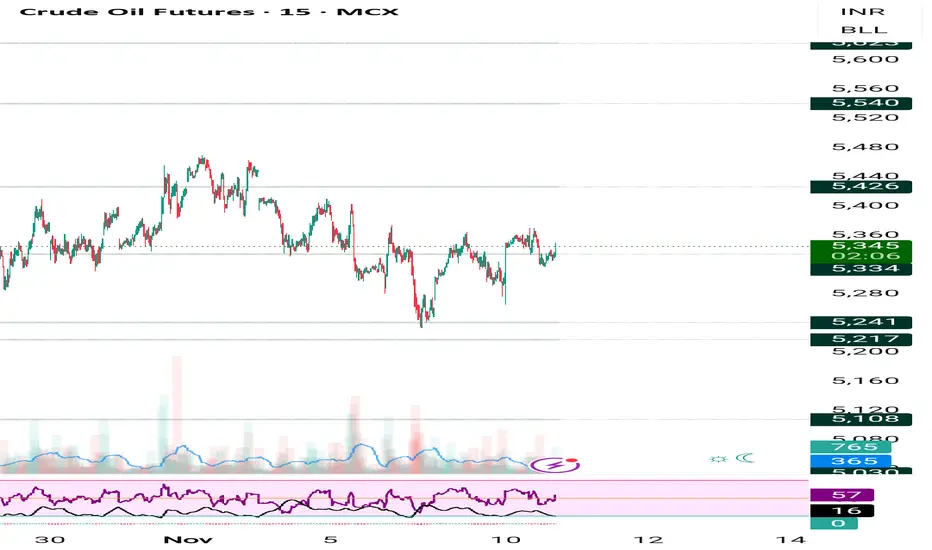
Now we are holding buy trade @5280 , target 5410,5490,5560🔑 Key Highlights (Locked Permanently)
- Supports/Resistances: 5250 is the critical support; breach flips bias.
- Indicators: ADX >25, RSI 63, PCR 0.91 — all thresholds confirmed.
- Liquidity: Turnover ₹12,400 Cr, VWAP 5345 — strong institutional activity.
- Volatility: IV 16.2%, RV 14.5% — bot
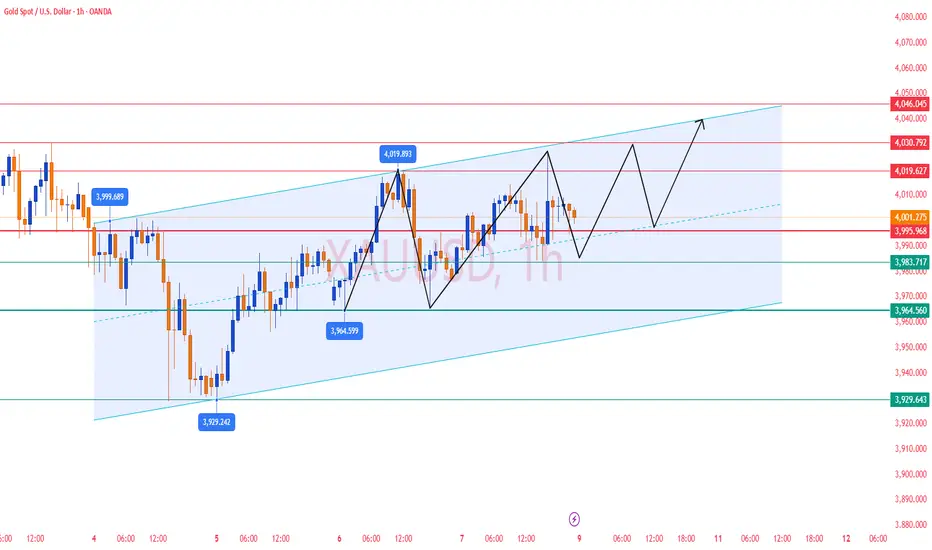
Gold 1H – Is This Pump Temporary or the Start of a Bigger Move?🟡 XAUUSD – Intraday Smart Money Plan | by Ryan_TitanTrader
📈 Market Context
Gold extended its bullish leg overnight, driven by a sharp upside displacement following a clean ChoCH on the H1 structure.
However, the impulsive rally is now pushing deep into premium territory, where higher-timeframe sup

Silver Triangle BreakoutSilver is attempting breakout forming a ascending triangle pattern on 1h and 4h timeframe. It is also trading above 200ema.

See all futures ideas
GBPUSD MULTI TIMEFRAME ANALYSIS Hello traders , here is the full multi time frame analysis for this pair, let me know in the comment section below if you have any questions , the entry will be taken only if all rules of the strategies will be satisfied. wait for more price action to develop before taking any position. I suggest yo

EURUSD Weekly Outlook - 10/11/205 to 14/11/2025Wassup Lads!
So this week we can see that EU closed sharply into the week rejecting the lows, there's a strong rejection candle on the weekly time frame and price has displaced higher forming a daily swing point and a daily fair value gap as well, so what I would be looking for price is to do this -

GBP/USD on the 1-hour timeframe.GBP/USD on the 1-hour timeframe.
There’s a bullish breakout setup drawn, with an upward projection (two labeled “Target Points”).
The breakout seems to be from a descending channel, now shifting to a bullish channel or reversal structure.
From what’s visible:
Current price is around 1.3180 – 1.

EURUSD – Bullish Setup Toward 1.16EURUSD – Bullish Setup Toward 1.17
EURUSD is showing strong signs of a bullish reversal after an extended period of downside movement. The 3H chart highlights several Market Structure Shifts (MSS) and Breaks of Structure (BOS) suggesting that bearish momentum is fading and buyers are regaining cont

Expected eurusd sell upto April 2026Long term expectations for eurusd
Forecasts suggest the EUR/USD pair is likely to remain under selling pressure until April 2026, with projections showing declines toward the 1.06–1.09 range before a potential rebound later in 2026.
TICKMILL:EURUSD
---
EUR/USD Sell Outlook up to April 2026

GBPJPYAs you can see price is clearly in an downtrend. Nice push to the downside, and nice recovery back up. And with 4 points being made ( H,L,HL,LL) downtrend is confirmed. I marked 4H supply that aligns with 202.000 handle.
While on the 4H is a downtrend, on daily timeframe, price is in a bullish leg

EURUSD for next month.-> 7 NovPrice is reacting and seeing some `upward` moment before reaching to our `demand` zone.
Expecting a bull in next few week.

AUDUSD - SELLAUD/USD Sell Setup 🦘💵
📉 Primary Trade:
Sell @ 0.6502 — Previous day NY session high
Looking for rejection or liquidity grab around this level.
📉 Backup Trade:
Sell @ 0.6519 — Previous day London session high
Secondary zone if price breaks above NY high.

GBP AUD 0.01 LOT BUY 6/11/2025 23.35
📊 Forex Update (GBP/AUD)
मैंने 0.01 lot की Buy ली है, मार्केट सपोर्ट पर है।
2 दिन वेट करूंगा, अगला अपडेट जल्द दूंगा।
⚠️ Disclaimer: यह मेरी निजी राय है, निवेश सलाह नहीं।
👉 अपनी समझ से काम लें और पूरे भरोसे के साथ ट्रेड करें।
— Irshad Ali
---
📊 Forex Update (GBP/AUD)
Took Buy 0.01 lot, market n


See all forex ideas
| - | - | - | - | - | - | - | - | ||
| - | - | - | - | - | - | - | - | ||
| - | - | - | - | - | - | - | - | ||
| - | - | - | - | - | - | - | - | ||
| - | - | - | - | - | - | - | - | ||
| - | - | - | - | - | - | - | - | ||
| - | - | - | - | - | - | - | - | ||
| - | - | - | - | - | - | - | - | ||
| - | - | - | - | - | - | - | - |
Trade directly on the supercharts through our supported, fully-verified and user-reviewed brokers.


