#JKTYRE - Cup & Handle / IHNS BO in DTFScript: JKTYRE
Key highlights: 💡⚡
📈 Cup & Handle / IHNS BO in DTF
📈 Volume spike seen during Breakout
📈 MACD Bounce
📈 RS Line making 52WH
✅Boost and follow to never miss a new idea! ✅
⚠️ Important: Always Exit the trade before any Event.
⚠️ Important: Always maintain your Risk:Reward Ratio as 1
Your 2025 space mission is here
Suit up and get ready to explore every highlight of your trading galaxy.


EURUSD-Short-15MThe trade was initiated based on a high-probability setup identified through a confluence of technical factors.
Higher Timeframe (HTF) Analysis: Price action on a higher timeframe (15 MIn) demonstrated a perfect retracement into a previously identified order block (OB). This order block represente

HEROMOTOCO - Rejection From Strong Resistance, Momentum Cooling💹 Hero MotoCorp Ltd (NSE: HEROMOTOCO)
Sector: Automobiles | CMP: 5817
View: Bearish — Rejection From Strong Resistance, Momentum Cooling
HEROMOTOCO has recently faced a sharp rejection from its upper resistance zone near the 6100–6200 region after a strong prior rally, indicating supply emergence

BANKNIFTY at a Make-or-Break ZoneNIFTYBANK is currently trading at a critical confluence zone where a downward-sloping resistance trendline is meeting a well-defined rising support area on the 1-hour timeframe. This price compression indicates indecision and typically precedes a sharp directional move. The index has repeatedly resp

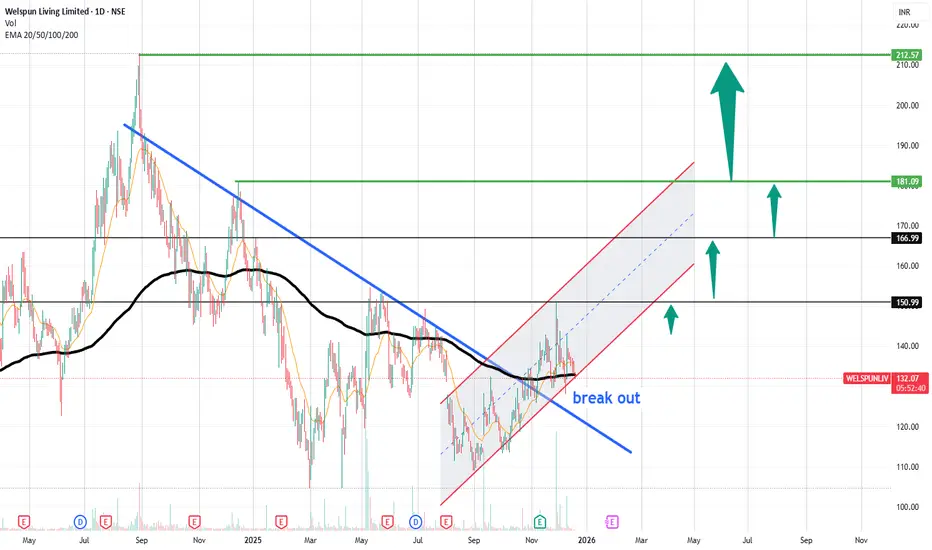
WELSPUNLIV | Trend Reversal with Strong VolumeWelspun Living Ltd. (NSE: WELSPUNLIV) is showing signs of a significant trend reversal as it breaks out of a downward channel, supported by a surge in volume. After multiple attempts to move higher, the price action has finally broken above the crucial resistance at ₹132.90, signaling the potential
Nifty 50 Analysis for Short and Long TermIn the video, few points that are discussed are :
Nifty 50 is sustaining on long term chart.
Nifty 50 is sideways to bearish on short term chart.
Check the past chart and control your emotions in short term up and down moves.

CEAT LTD: Demand Is Quietly Winning This BattleThis chart tells a very classic supply–demand story where emotions and patience are clearly separated. On the surface, recent price action may look weak or confusing, but when you zoom out and read it through the lens of demand–supply and price action, the bigger picture becomes very clear.
🔥 High

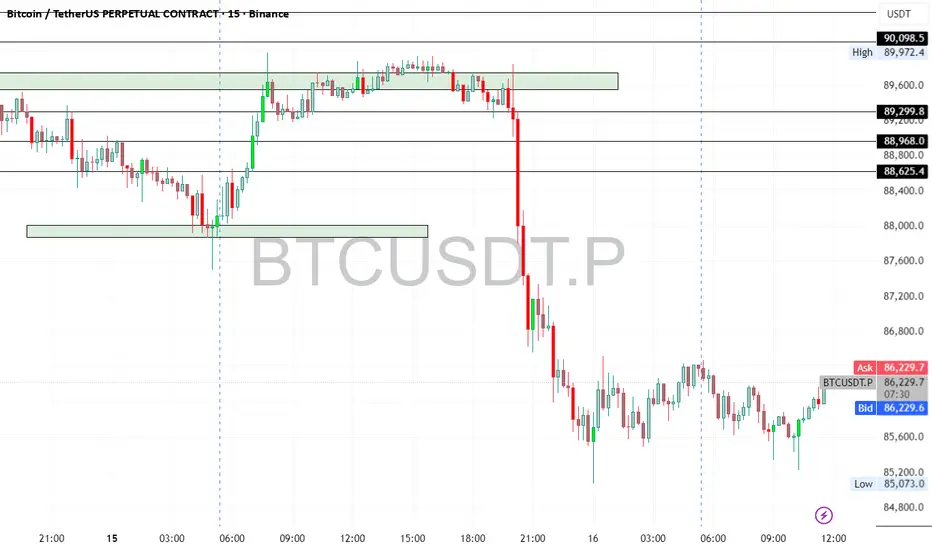
Bitcoin UpdateBTC is down ~2% today but has recovered from the lows and is holding above key support at $86,180 — showing strong respect for the trendline.
Key Levels:
🟢 Support: $86,180 → if this breaks, next major support is $75,000
🔵 Resistance: ~$92,000
🟩 Major Resistance: ~$100,000
Positioning:
I remain lo
RR Kabel Ltd | Volume Area High Breakout Setup RR Kabel is currently trading above the Volume Area High, indicating strong acceptance at higher levels. Price is hovering near a key resistance zone and showing signs of a potential breakout with volume expansion.
Technical View:
Acceptance above VAH → bullish bias
Strong base formation afte

Varun BeveragesDate 15.12.2025
Varun Beverages
Timeframe : Weekly Chart
About
(1) Varun Beverages has been associated with PepsiCo since the 1990s
(2) Operations spans 10 countries with franchise rights & distribution rights
Brands
(1) PepsiCo. franchised Brands - Pepsi, Tropicana, Slice, 7UP, Sting, Kurkure,

See all editors' picks ideas
Multi-Ticker Anchored CandlesMulti-Ticker Anchored Candles (MTAC) is a simple tool for overlaying up to 3 tickers onto the same chart. This is achieved by interpreting each symbol's OHLC data as percentages, then plotting their candle points relative to the main chart's open. This allows for a simple comparison of tickers to tr

Vdubus Divergence Wave Pattern Generator V1The Vdubus Divergence Wave Theory
10 years in the making & now finally thanks to AI I have attempted to put my Trading strategy & logic into a visual representation of how I analyse and project market using Core price action & MacD. Enjoy :)
A Proprietary Structural & Momentum Confluence System

Per Bak Self-Organized CriticalityTL;DR: This indicator measures market fragility. It measures the system's vulnerability to cascade failures and phase transitions. I've added four independent stress vectors: tail risk, volatility regime, credit stress, and positioning extremes. This allows us to quantify how susceptible markets are

Volatility Risk PremiumTHE INSURANCE PREMIUM OF THE STOCK MARKET
Every day, millions of investors face a fundamental question that has puzzled economists for decades: how much should protection against market crashes cost? The answer lies in a phenomenon called the Volatility Risk Premium, and understanding it may fundam

Volume Gaps & Imbalances (Zeiierman)█ Overview
Volume Gaps & Imbalances (Zeiierman) is an advanced market-structure and order-flow visualizer that maps where the market traded, where it did not, and how buyer-vs-seller pressure accumulated across the entire price range.
The core of the indicator is a price-by-price volume prof

Match Finder [theUltimator5]Match Finder is the dating app of indicators. It takes your current ticker and finds the most compatible match over a recent time period. The match may not be Mr. right, but it is Mr. right now. It doesn't forecast future connection, but it tells you current compatibility for today.
Jokes aside,

Trend Line Methods (TLM)Trend Line Methods (TLM)
Overview
Trend Line Methods (TLM) is a visual study designed to help traders explore trend structure using two complementary, auto-drawn trend channels. The script focuses on how price interacts with rising or falling boundaries over time. It does not generate trade sign

Breakouts & Pullbacks [Trendoscope®]🎲 Breakouts & Pullbacks - All-Time High Breakout Analyzer
Probability-Based Post-Breakout Behavior Statistics | Real-Time Pullback & Runup Tracker
A professional-grade Pine Script v6 indicator designed specifically for analyzing the historical and real-time behavior of price after strong All-Ti

Count█ OVERVIEW
A library of functions for counting the number of times (frequency) that elements occur in an array or matrix.
█ USAGE
Import the Count library.
import joebaus/count/1 as c
Create an array or matrix that is a `float`, `int`, `string`, or `bool` type to count elements from, t

Holographic Market Microstructure | AlphaNattHolographic Market Microstructure | AlphaNatt
A multidimensional, holographically-rendered framework designed to expose the invisible forces shaping every candle — liquidity voids, smart money footprints, order flow imbalances, and structural evolution — in real time.
---
📘 Overview
The Hol

See all indicators and strategies
Community trends
#JKTYRE - Cup & Handle / IHNS BO in DTFScript: JKTYRE
Key highlights: 💡⚡
📈 Cup & Handle / IHNS BO in DTF
📈 Volume spike seen during Breakout
📈 MACD Bounce
📈 RS Line making 52WH
✅Boost and follow to never miss a new idea! ✅
⚠️ Important: Always Exit the trade before any Event.
⚠️ Important: Always maintain your Risk:Reward Ratio as 1
TVSMOTOR- FLAG PATTERN BOTVS Motor has formed a classic flag pattern after a strong upward move. The sharp rise shows momentum, and the current sideways-to-down consolidation is the market cooling off, not reversing.
This structure usually represents continuation, where price digests earlier gains before the next move. As

Why Syngene International is a Long-Term Growth Play!Syngene International isn’t just another stock — it’s one of India’s leaders in integrated CRDMO (Contract Research, Development & Manufacturing) services, powering global pharma, biotech & biotech innovation. 💡
syngeneintl.com
📊 Bullish fundamentals ahead:
✔️ Earnings & revenue projected to grow

WELSPUNLIV | Trend Reversal with Strong VolumeWelspun Living Ltd. (NSE: WELSPUNLIV) is showing signs of a significant trend reversal as it breaks out of a downward channel, supported by a surge in volume. After multiple attempts to move higher, the price action has finally broken above the crucial resistance at ₹132.90, signaling the potential
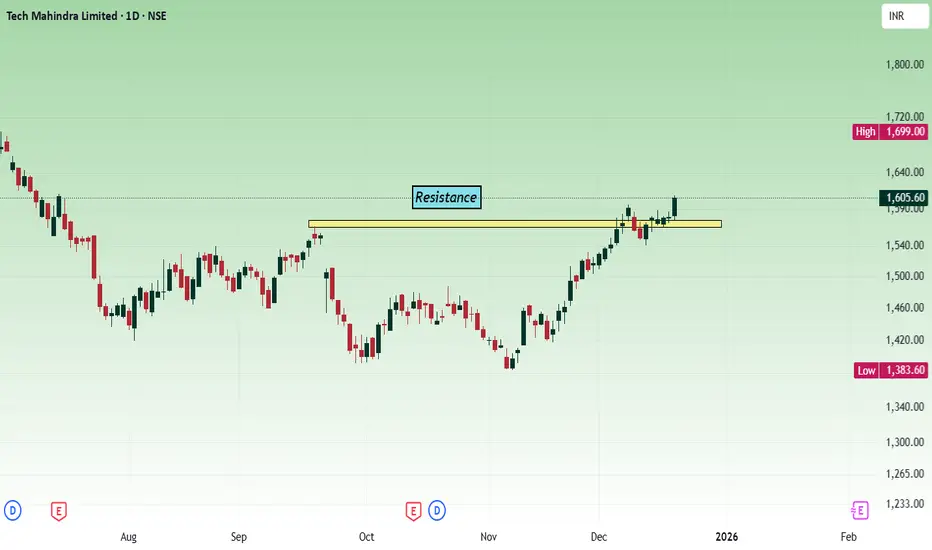
TechM - Multi time frame analysisThe price has broken the resistance at the 1560 - 1580 zone, unable to sustain, fall back and once again took support. Today's movement shows bullish strength.
As per the daily chart, the price has broken the trend line. Strong weekly close will confirm the bullish movement.
Buy above the 1595 - 16
Bullish Setup on Laurus LabLaurus Lab Hourly Chart
F&O Segment stock
Bullish Pattern (ascending triangle) spotted on hourly chart.
There is a breakout on hourly RSI indicating momentum in the stock and there can be a breakout about resistance zone on price chart. Target comes around 1095
Laurus lab is a high beta stock it can

Influx Healthtech LtdDate 19.12.2025
Influx Healthtech
Timeframe : Day Chart
Highlight : zero-debt small-cap company beating in valuation ratios to many large cap cos.
About
(1) Incorporated in September 2020
(2) Healthcare-focused company specialising in contract manufacturing
(3) Catering Business-to-Business (B2

BTST To Swing OpportunityWaaree Energies
Smart Move near closing time
CMP 4065
SL CLB 3090
Tgt 3240 & Beyond
⚠️ Note: Stick to levels, follow discipline & use TSL (Trailing Stop Loss) once target starts approaching.
Let’s stay hopeful that the move continues as per our expectations! 📈
💡 Liked the idea?
Then don’t forg

VEDL - Multi year breakoutThis a 3M time frame chart. Simple, clean and elegant. Please note this a very broad time frame chart so this cannot be a swing trade or short term trade, the minimum time of investment should be 6M.
We can target a return in the range of 60%-100%

HDFCAMC - Demand Reclaim, Institutional Participation Visible💹 HDFC Asset Management Co. Ltd (NSE: HDFCAMC)
Sector: Financial Services – Asset Management | CMP: 2723
View: Bullish — Demand Reclaim, Institutional Participation Visible
HDFCAMC has staged a sharp recovery from its lower demand zone, supported by a strong bullish candle and clear volume expansi

See all stocks ideas
No scheduled reports
Today
E
EXIMROUTESExim Routes Limited
Exchange
NSE
Offer price
0.974
USD
Today
A
ASHWINIAshwini Container Movers Limited
Exchange
NSE
Offer price
1.49 - 1.57
USD
Today
I
ICICIAMCICICI Prudential Asset Management Company Ltd.
Exchange
BSE
Offer price
22.64 - 23.78
USD
Today
S
SHOTAshwini Container Movers Limited
Exchange
NSE
Offer price
1.49 - 1.57
USD
Dec 22
2
2651Neptune Logitek Ltd.
Exchange
BSE
Offer price
1.402
USD
Dec 23
N
NVFYKSH International Ltd.
Exchange
BSE
Offer price
4.02 - 4.23
USD
Dec 24
H
HYPE3Global Ocean Logistics India Ltd.
Exchange
BSE
Offer price
0.81 - 0.86
USD
Dec 24
5
544512Marc Technocrats Limited
Exchange
NSE
Offer price
0.98 - 1.03
USD
Dec 30
5
544562Gujarat Kidney & Super Speciality Ltd.
Exchange
NSE
Offer price
—
Dec 30
N
NFLDSundrex Oil Co. Ltd.
Exchange
NSE
Offer price
0.90 - 0.96
USD
See more events
Community trends
Btc swing trading layout Price was respecting an ascending trendline (higher lows).
That trendline has now broken → structure shift from bullish to bearish.
After the break, price is trying to move back up = pullback / retest phase.
Retest / Supply zone: 87,800 – 88,800
This is the broken trendline + previous support tur

Update BTC retest previous Ascending Chanel BTC is currently retesting the previous ascending channel around 88k after dump.
Probablity
1. Nutral Dump to 84k - Confirmation only after 5 min bearish Divergence - 55%
2. Invalidation close above 88k in 4 hours - 20%
Note: Please ignore the previous chart TA

BTCUSD Buy IdeaBTC USD Major Trend Is Bearish But Short Term Trend Is Bullish So Taking Advantage of that By Targeting Nearest Resistance Area Buy at 86400 SL At 85800(Support) Target at 87050(Resistance)

BitcoinBitcoin is currently trading in a clear downtrend on the daily timeframe. The chart shows a sequence of lower highs and lower lows, highlighted by repeated rising trendlines that break to the downside, confirming bearish continuation.

Bitcoin AI tool data Analysis showing accumulation on lower pricParameter Data
Asset Name Bitcoin (BTC/USDT) Spot
Price Movement 🟨 Neutral/Consolidation (LTP: $88,000 | +1.12% 24h)
Current Trade 🟨 ACCUMULATE (Spot buying preferred over high-leverage)
SMC Structure 🟨 Consolidation within Bullish Macro (Testing 4H Order Block)
Trap/Liquidity Zones 🟥 Bullish Trap:

Btc view Btc sell Cmp add more 88660, 89200, 89800
Target 84300 ,81300, 75000
sl 91120 above
view is for study purpose only , we are not recommend any trade or investment

"ETH/USDT Forecast""ETH/USDT Forecast"
The market shows evidence of strong participation earlier, where price moved with speed and consistency, reflecting clear intent. That phase established direction and control without prolonged hesitation.
As price progressed, momentum began to ease. Movement slowed, reactions b

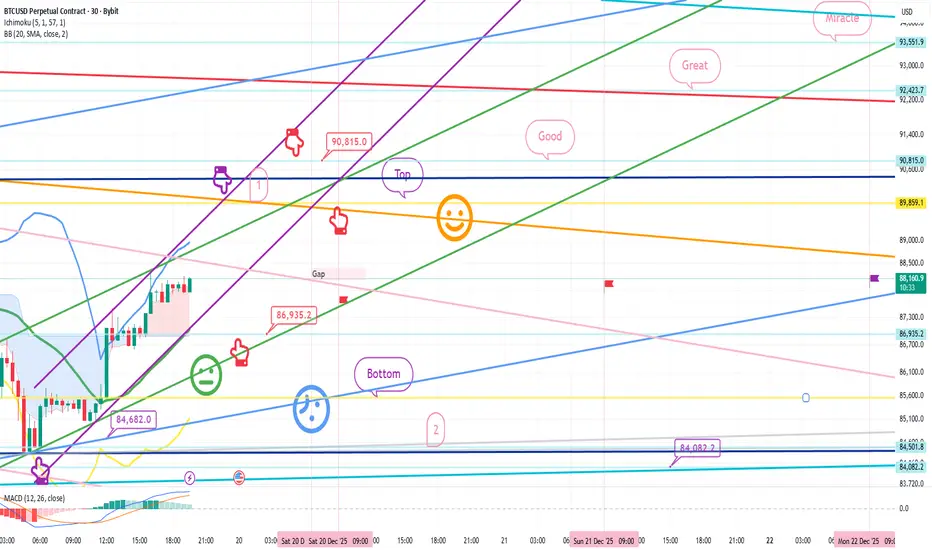
Bitcoin Bybit chart analysis December 19
Hello
It's a Bitcoin Guide.
If you "follow"
You can receive real-time movement paths and comment notifications on major sections.
If my analysis was helpful,
Please click the booster button at the bottom.
This is a Bitcoin 30-minute chart.
Shortly, at 10:30 AM and 12:00 PM, the Nasdaq indicato
ETH UNDER PRESSURE - BREAKDOWN Ethereum slipped below the $3,000 support, following heavy selling in spot ETH ETFs. Net outflows hit $224.7M in a single day, the largest exit in weeks, extending total ETF selling to $286.5M over the past three days. Notably, BlackRock and Grayscale led the withdrawals, with zero inflows recorded

Ethereum in an Ascending Channel | A Mid-Term Correction Before?Ethereum (ETH) is still trading within a long-term ascending channel, maintaining its overall bullish structure. However, at the current stage, the price appears to be undergoing a medium-term correction.
From a technical perspective, this corrective move may extend toward the $2,200 support zone,

See all crypto ideas
Gold view For London Session Gold to Take for Long for Liquidity Suppourt At downside and marekt strucutre is bullish on 5 min tf as well as at good fib level

GOLD BULLISH STRUCTURE SETUP LONG TIME BULLISH SETUP DIRECTION In gold when gold channel lower touch and make a bullish engle candle of h4 time frame then enter long time

Silver comex be ready for downmove heavy fall AI tool data Parameter Data
Asset Name 🟦 Silver Futures (COMEX / SI)
Price Movement 🟥 Minor Pullback (-1.91% Today / +130% YTD)
Current Trade 🟨 WAIT / BUY ON DIPS (Targeting $70.00+)
SMC Structure 🟩 Strong Bullish Order Flow (High-level consolidation)
Trap/Liquidity Zones 🟥 Bullish Trap: Above $67.50 / 🟩 Demand

XAUUSD | 1H | Liquidity-Based SetupPrice is currently trading inside a well-defined range, with liquidity clearly resting on both sides.
• The equal highs / range high above act as buy-side liquidity, likely to be raided before any meaningful directional move.
• A liquidity sweep to the upside is expected first, tapping into premium

sell trade in niftyselling nifty with sl of 25 points for a target of bottom liquidity sweep .
Nifty taking rejection from liquidity sweep top . if price sustains we can see a good fall till liquidity sweep bottom . more bearish levels are not yet validated . we can see more fall till mid reversal .

As same As Expected easily gives 1:3 RR guysAs I told you in previous post after getting medicated this Demand zone with perfect candelstick conformation and LTF conformation go long As you can see market easily gave us 1:3 Risk Reward
Enjoy your profits Guys
Follow me for more

XAUUSD M30: Watching BUY 4,317–4,303, Targets 4,337–4,3461) Market Context (M30) – SMC & Price Structure
• The chart is on the M30 timeframe (not H1).
• After the impulsive move up, price has entered a consolidation / corrective phase , with BOS and ChoCH signals indicating a rotation of order flow around the equilibrium zone.
• Price is currently

Gold After Liquidity Grab: Short side intraday move, R you readyHello Everyone, let's analyse Gold as this once again tested a major resistance zone, but instead of giving a clean breakout, price briefly moved above the level and then quickly reversed. This move was not strength, it was a liquidity grab.
In simple words, smart money pushed price above resistanc

XAUUSD | Awaiting Reaction at OB + Fibo to Confirm Next Move◆ Market Context (M30)
The price is maintaining an uptrend with a supporting trendline. After a strong push creating a short-term peak, the market enters a pullback to rebalance. The current decline has not broken the upward structure.
◆ SMC & Price Action
• The rapid decline creates an OB + Fibo S

Gold Trading Strategy for 19th December 2025🟡 GOLD (XAUUSD) – Intraday Trading Plan
📈 BUY SETUP (Bullish Scenario)
🕒 Timeframe: 30-Minute Candle
🔹 Entry Condition:
Buy above the HIGH of the 30-minute candle
Candle must close above 4351
🔹 Buy Entry Zone:
➡️ Above 4351 (Confirmed Close)
🎯 Targets:
Target 1: 4368
Target 2: 4378
Target 3: 4388

See all futures ideas
Triangle Compression Zone🔎 Overview
The Triangle Compression Zone highlights a phase where price transitions from directional movement into consolidation. After an initial trend, price begins to contract between converging support and resistance lines, signaling reduced volatility and temporary market balance.
-------

CHFJPY – Bias-Driven HFT Buy OpportunityThis my first Idea I share in public. Bias-driven HFT buy on CHFJPY, aligned with the higher-timeframe Monthly bullish structure. Price is holding above key support and reacting from a discount zone. Entry is taken in line with structure continuation, with SL below the current daily candle and targe

EUR/USD Decision PhaseEUR/USD Decision Phase
Recent candles indicate a slowdown in upside follow-through, implying that short-term positioning may be crowded. This pause does not immediately invalidate the broader constructive tone but introduces the risk of a corrective rotation as liquidity is rebalanced. The projecte

EURUSD-Short-15MThe trade was initiated based on a high-probability setup identified through a confluence of technical factors.
Higher Timeframe (HTF) Analysis: Price action on a higher timeframe (15 MIn) demonstrated a perfect retracement into a previously identified order block (OB). This order block represente
EURUSD Monthly View – Trendline Breakout Sustained, Weekly Flag EURUSD has already broken above the key trendline and sustained, confirming bullish momentum. On the monthly chart, the pair is testing the previous high — a clean breakout and sustained close above this level could trigger fresh long opportunities and mark the start of a new uptrend.
On the weekly

USDJPY – Potential for a Volatile End to the WeekIt’s the last full trading week of the year before the Christmas break but that doesn’t necessarily mean that FX markets will be quiet. The calendar is still packed full of important risk events, and when combined with the possibility for decreasing levels of liquidity into Friday’s close it could

AUDCHF
Massive AOI in daily TF.
impulsive brake and come to retest the previous structure.
1. in daily TF:- After long time finaly brake the consodetion.
Become bearish to bullish.
2. in 4h TF:- Come for retesting the AOI or previous structore.
Wating for (CHOCH) change of carectore.

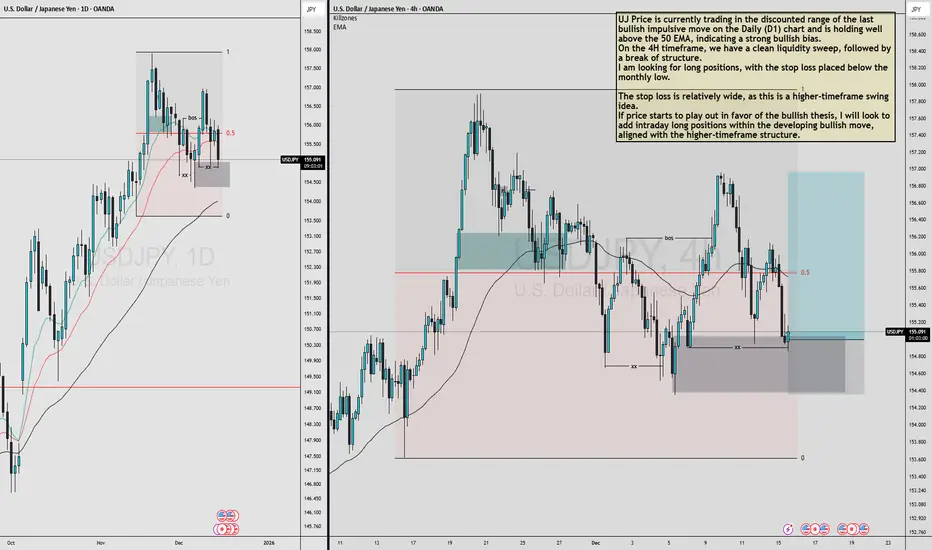
USDJPY MULTI TIMEFRAME ANALYSIS UJ Price is currently trading in the discounted range of the last bullish impulsive move on the Daily (D1) chart and is holding well above the 50 EMA, indicating a strong bullish bias.
On the 4H timeframe, we have a clean liquidity sweep, followed by a break of structure.
I am looking for long posit
AUD/CAD Bullish in Daily time frameTechnically : AUD/CAD is technically ready for bullish move. As the wave 1( impulse) followed by wave 2 (Correction), Wave 3 (impulse), followed by wave 4(Correction). Wave 5 Start will be determined by Fundamental connection.
Fundamental Data : CAD CPI will be published tomorrow. Based on the re

USDJPY LONGprice came to retest the daily demand area and gave a ltf confirmation on 15.
study the reaction at marked levels

See all forex ideas
| - | - | - | - | - | - | - | - | ||
| - | - | - | - | - | - | - | - | ||
| - | - | - | - | - | - | - | - | ||
| - | - | - | - | - | - | - | - | ||
| - | - | - | - | - | - | - | - | ||
| - | - | - | - | - | - | - | - | ||
| - | - | - | - | - | - | - | - | ||
| - | - | - | - | - | - | - | - | ||
| - | - | - | - | - | - | - | - |
Trade directly on Supercharts through our supported, fully-verified, and user-reviewed brokers.


