Money moves the market - Bank NiftyTraders say price moves the market. Bulls or bears move the market etc... But the fact is, money moves the market. You cannot ignore Bank Nifty when analyzing Nifty. When bank sector is supporting, Nifty gives a trending move.
Public sector bank stocks are on the move, while private sector bank stoc

The best trades require research, then commitment.
Get started for free$0 forever, no credit card needed

Scott "Kidd" PoteetThe unlikely astronaut

Where the world does markets
Join 100 million traders and investors taking the future into their own hands.

L&T Multiyear BreakoutLarsen & Toubro Limited - Multi-Timeframe Breakout Analysis
Current Price:4,004.40
CRITICAL SETUP ALERT
L&T is at a pivotal moment with breakouts confirmed on weekly and monthly timeframes. The stock is now in a crucial period that will determine the validity of this range breakout.
KEY TECHNICAL

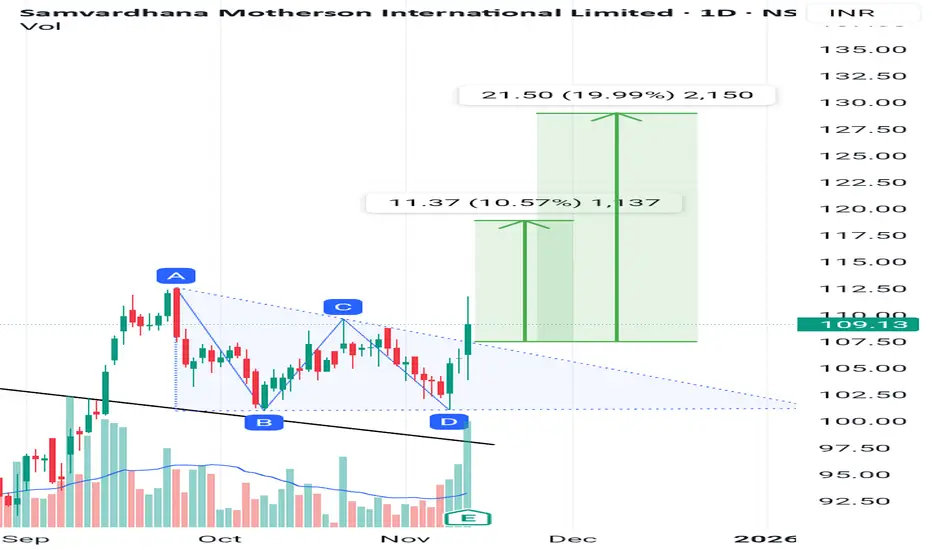
Samvardhana Motherson just made a triangle breakout.will it sustJust broke out of triangle pattern with good volume spike. Volumes are 3 times the average.
It brokeout of treandline on 12 September and gave a move of 10% before entring into consolidation of triangle pattern.
It just broke out of the pattern giving bullish signal.
Indicators
RSI is >60 which is
Asian Paints Turns Colorful Again!Hello Mates! Here’s a chart that really caught my attention this week Asian Paints showing strength after a long phase of quiet sideways movement. The structure is clean, the breakout is sharp, and the message from price action is clear momentum is shifting again.
After spending almost two years in

BANK NIFTY - Technical Analysis Bank Nifty is showing an interesting setup on the weekly chart.
After breaking out above its previous all-time high, the index has started contracting in a tight range, indicating healthy consolidation.
On the daily timeframe, it continues to take support near the 9 EMA, and during minor dips, it

DALMIA BHARATHello & welcome to this analysis
Technical Outlook:
In the monthly time frame its completing the formation of a Cup & Handle breakout suggesting upside levels for medium term 2800 - 3500, for long term 3800 - 5000
Accumulation can be done in the range of 1900 (on downside) 2300 (on the upside).
T

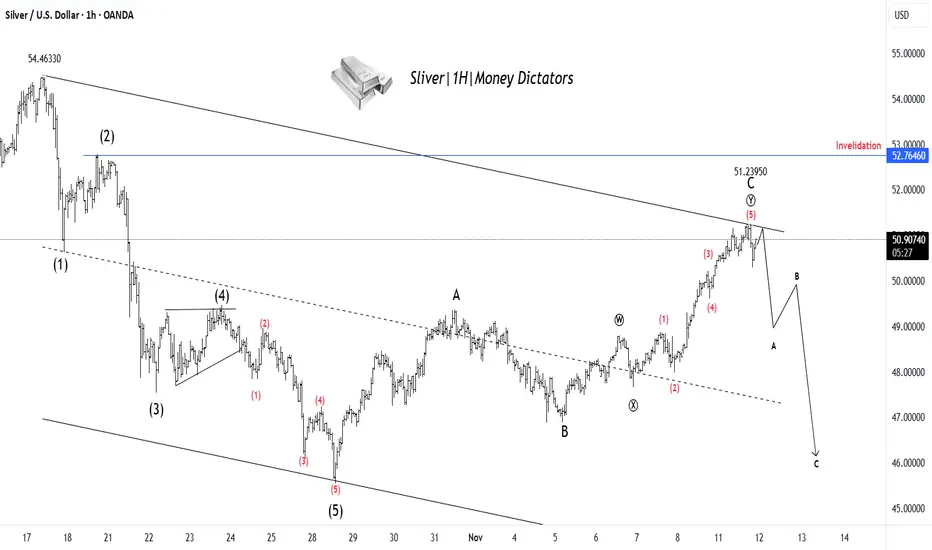
XAG/USD Set for Decline After Finishing Wave YSilver has completed a clear 5-wave upward move, ending near the 51.23 zone, which likely marks the completion of Wave C of the corrective structure. Price action shows rejection from the upper trendline, signaling that buying momentum is fading. This suggests the start of a new A–B–C corrective dec
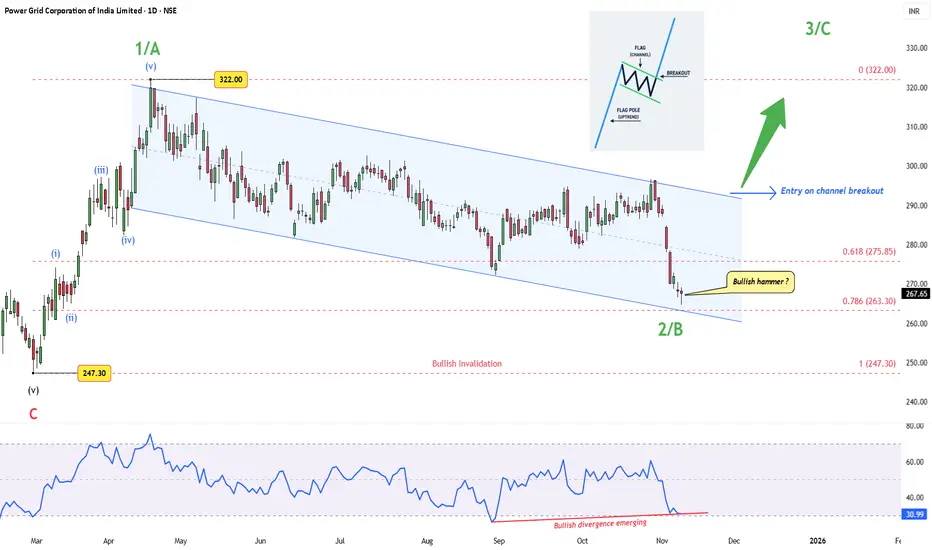
Power Grid – A Flag Within a WaveAfter completing a clean five-wave rally from ₹247.30 to ₹322, Power Grid has spent months in a controlled drift lower — a textbook corrective channel, likely forming Wave 2/B of the next major leg.
Price now sits near the 0.786 retracement (₹263 zone), showing early signs of exhaustion. A “ Bullis
Breakout retesting apollo HospitalBest ever result
ATH breakout & re-testing
Price should start new rally.
Price should not break the strong support of 7500
This is only for educational purpose no any trade recommendation

SAIL : LongTrend: The stock is forming a cup and handle pattern, which is a bullish continuation setup. It has broken out above the neckline around 140 levels, showing strength. The trend has turned positive after a long consolidation phase.
Volume: There is a clear increase in volume during the breakout, whi

See all editors' picks ideas
PriceFormatLibrary for automatically converting price values to formatted strings
matching the same format that TradingView uses to display open/high/low/close prices on the chart.
█ OVERVIEW
This library is intended for Pine Coders who are authors of scripts that display numbers onto a user's charts. T

LogNormalLibrary "LogNormal"
A collection of functions used to model skewed distributions as log-normal.
Prices are commonly modeled using log-normal distributions (ie. Black-Scholes) because they exhibit multiplicative changes with long tails; skewed exponential growth and high variance. This approach i

Range Oscillator (Zeiierman)█ Overview
Range Oscillator (Zeiierman) is a dynamic market oscillator designed to visualize how far the price is trading relative to its equilibrium range. Instead of relying on traditional overbought/oversold thresholds, it uses adaptive range detection and heatmap coloring to reveal where pri

Volume Surprise [LuxAlgo]The Volume Surprise tool displays the trading volume alongside the expected volume at that time, allowing users to spot unexpected trading activity on the chart easily.
The tool includes an extrapolation of the estimated volume for future periods, allowing forecasting future trading activity.
🔶 U

Smooth Theil-SenI wanted to build a Theil-Sen estimator that could run on more than one bar and produce smoother output than the standard implementation. Theil-Sen regression is a non-parametric method that calculates the median slope between all pairs of points in your dataset, which makes it extremely robust to o

Fair Value Gaps by DGTFair Value Gaps
A refined, multi-timeframe Fair Value Gap (FVG) detection tool that brings institutional imbalance zones to life directly on your chart.
Designed for precision, it visualizes how price delivers into inefficiencies across chart, higher, and lower (intrabar) timeframes — offering a fl

TASC 2025.11 The Points and Line Chart█ OVERVIEW
This script implements the Points and Line Chart described by Mohamed Ashraf Mahfouz and Mohamed Meregy in the November 2025 edition of the TASC Traders' Tips , "Efficient Display of Irregular Time Series”. This novel chart type interprets regular time series chart data to create an ir

Simplified Percentile ClusteringSimplified Percentile Clustering (SPC) is a clustering system for trend regime analysis.
Instead of relying on heavy iterative algorithms such as k-means, SPC takes a deterministic approach: it uses percentiles and running averages to form cluster centers directly from the data, producing smoo

Adaptive Volume Delta Map---
📊 Adaptive Volume Delta Map (AVDM)
What is Adaptive Volume Delta Map (AVDM)?
The Adaptive Volume Delta Map (AVDM) is a smart, multi-timeframe indicator that visualizes buy and sell volume imbalances directly on the chart.
It adapts automatically to the best available data resolution

Dynamic Equity Allocation Model"Cash is Trash"? Not Always. Here's Why Science Beats Guesswork.
Every retail trader knows the frustration: you draw support and resistance lines, you spot patterns, you follow market gurus on social media—and still, when the next bear market hits, your portfolio bleeds red. Meanwhile, institution

See all indicators and strategies
Community trends
L&T Multiyear BreakoutLarsen & Toubro Limited - Multi-Timeframe Breakout Analysis
Current Price:4,004.40
CRITICAL SETUP ALERT
L&T is at a pivotal moment with breakouts confirmed on weekly and monthly timeframes. The stock is now in a crucial period that will determine the validity of this range breakout.
KEY TECHNICAL
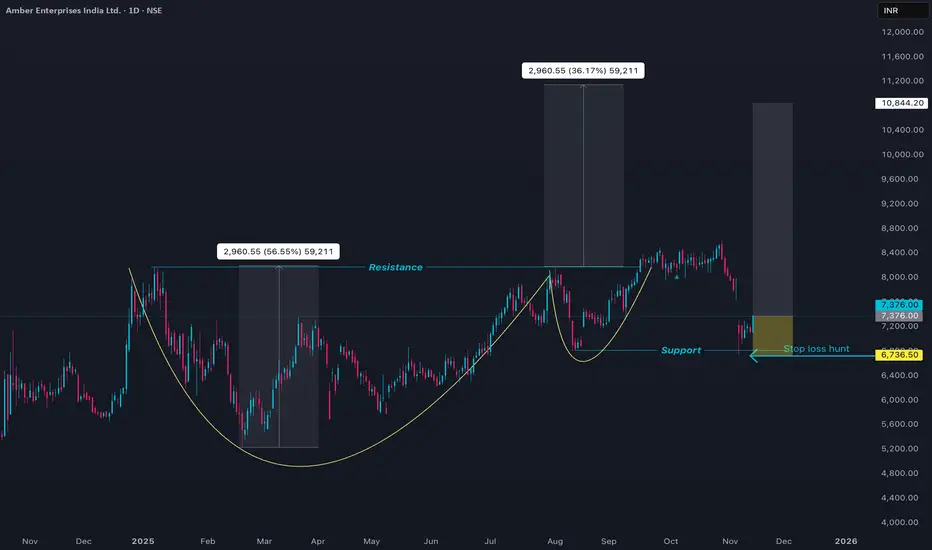
AMBER Re entry set upProbabilities to enter a trade
1. pattern cup & handle
2. Break out failed
3. stop loss hunt is also over
we have 3 probabilities that price may shoot up
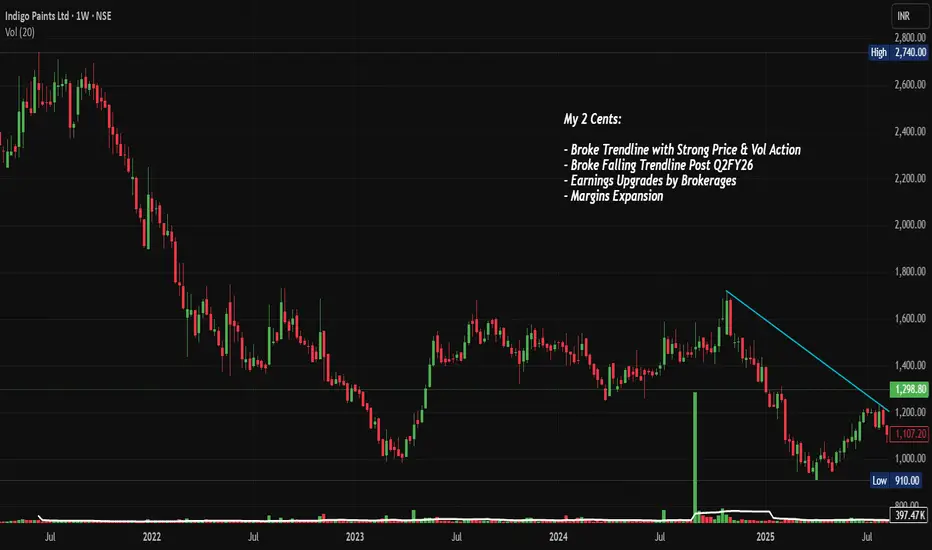
INDIGOPNTS: Trendline Breakout Post Q2FY26, Chart of the WeekWhy NSE:INDIGOPNTS Could Be Your Next Multi-Bagger: Breaking Out After a Brutal 60% Correction Post Good Q2 FY26 Numbers: Let's Analyze in Chart of The Week
As per the Latest SEBI Mandate, this isn't a Trading/Investment RECOMMENDATION nor for Educational Purposes; it is just for Informational p
Double Top FormationTataSteel has formed a double top on a weekly timeframe which indicates caution, one can initiate a short (swing) trade below the weekly lows with a strict SL of 185 on closing basis.

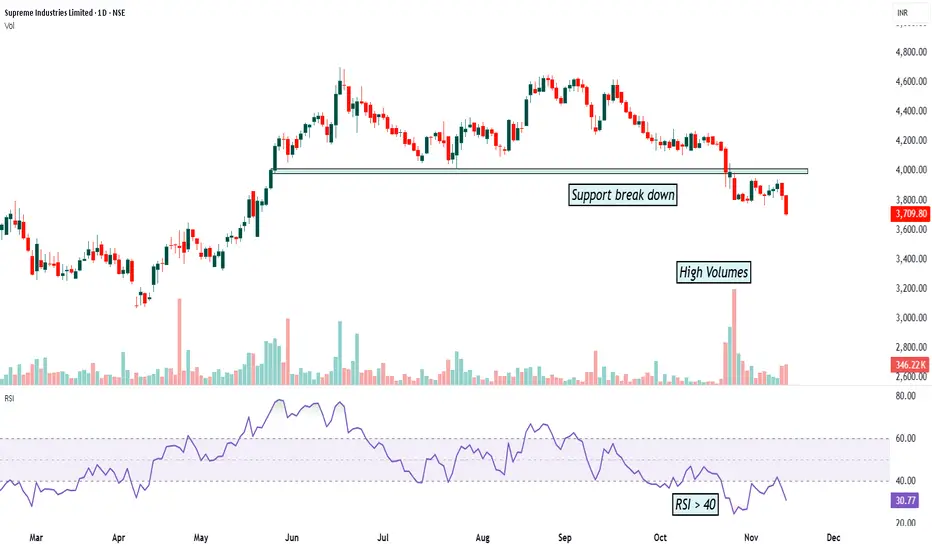
SUPREMEIND- Support break downThe chart shows that the stock has broken an important support level. This support had held the price many times in the past, but now the price has fallen below it. The breakdown has happened with high selling volume, which means more sellers are participating and the move is strong.
RSI is also be
Cup & Handle Breakout Opportunity in Reliance IndustriesReliance Industries, currently trading near ₹1518 on the weekly charts, is showing signs of a cup & handle breakout at the top of a consolidation zone. This pattern, combined with strong Relative Strength Index (RSI) readings across multiple timeframes, highlights a potential bullish opportunity.
🔍

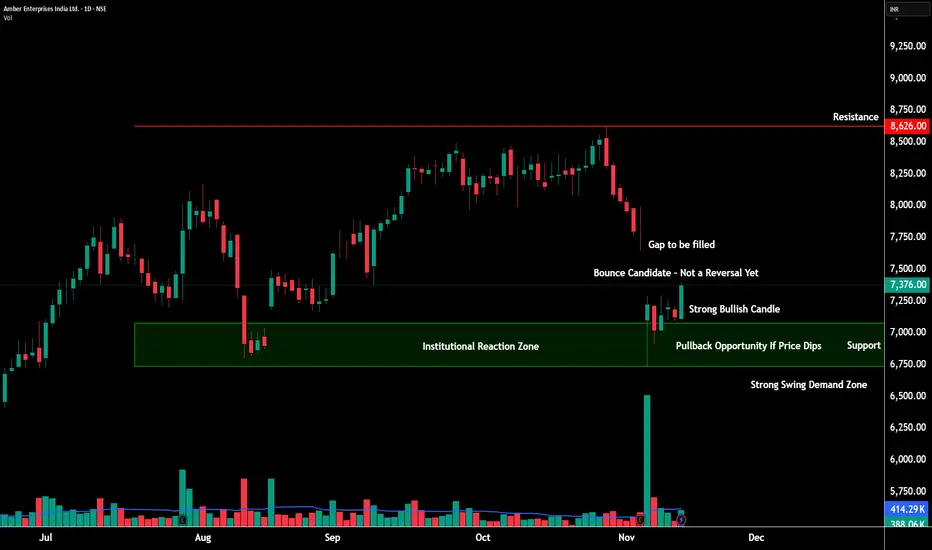
AMBER at a Critical Turning Point – Trend Shift or Just a Bounce💹 Amber Enterprises Ltd (NSE: AMBER)
Sector: Consumer Durables | CMP: 7376 | View: Early Reversal Attempt Inside Downtrend Structure
Chart Pattern: NA
Candlestick Pattern: Bullish Engulfing
📊 Price Action – What’s Really Happening?
Amber finally showed signs of life after a sharp slide from 8600
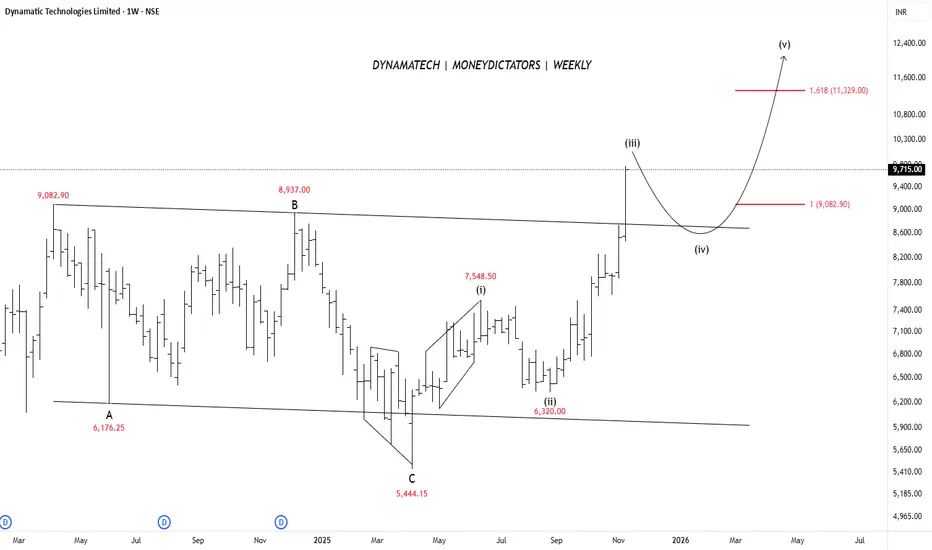
Dynamatech Has Given a Clean Wave Map to the ₹11,300 ZoneDynamatic Technologies has already completed its big A-B-C correction, meaning the downtrend is over. After this, the stock started a fresh upward Elliott Wave cycle, and waves (i), (ii), and (iii) are already complete. This confirms that the stock has entered a new bullish phase.
Right now, the pr
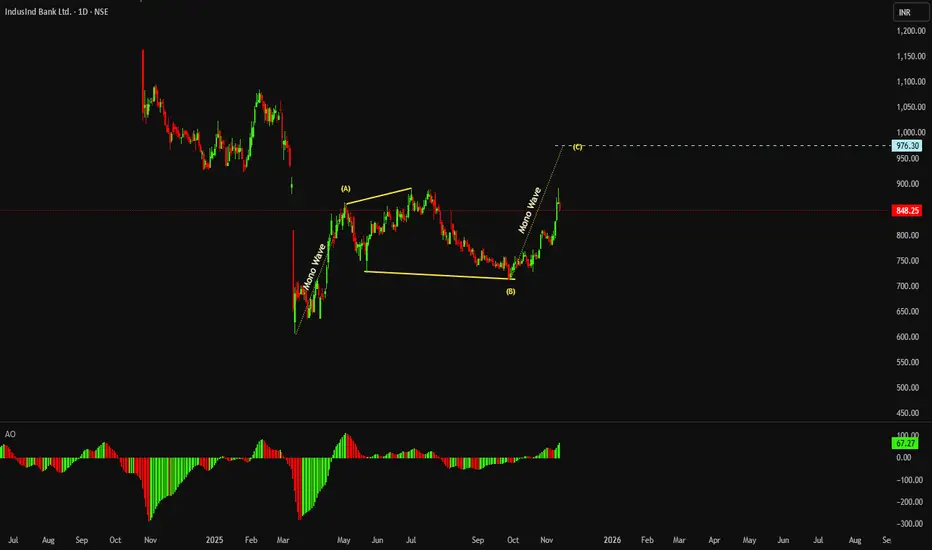
Mono Wave In This Chart Pattern Example I have Visually Represented Mono Wave identification
Friends its Important to note the behavior of Price along the side of its movement is
important , as a single strong move on daily suggest the movement is Mono Wave or Representation of fast displacement of price
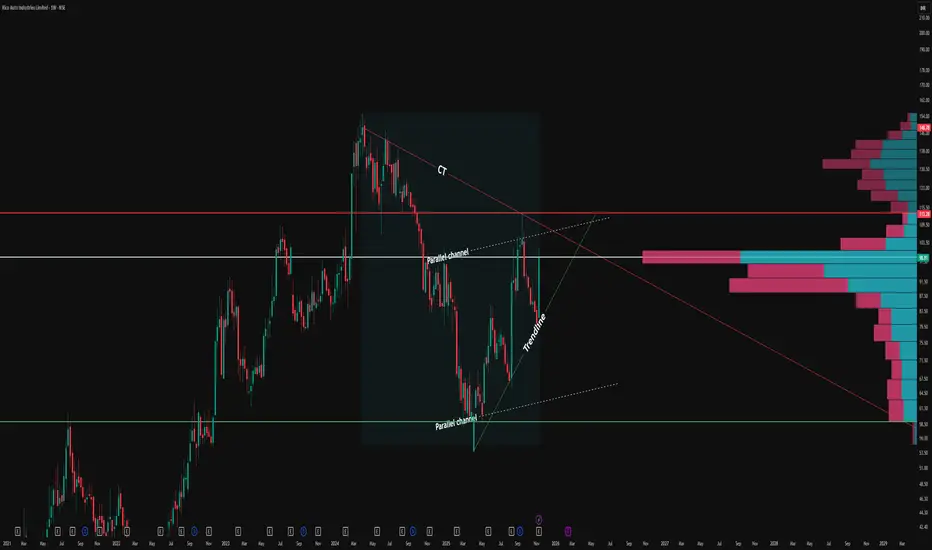
How Counter Trendlines and Parallel Channels Reveal Price StructThe CT (Counter Trendline) as the prime technical feature. The red CT line distinctly marks recurring lower high rejections, shaping significant supply pockets and creating low-liquidity price zones at every inflection point.
Each touch validates the CT’s relevance, highlighting how price is repea
See all stocks ideas
Community trends
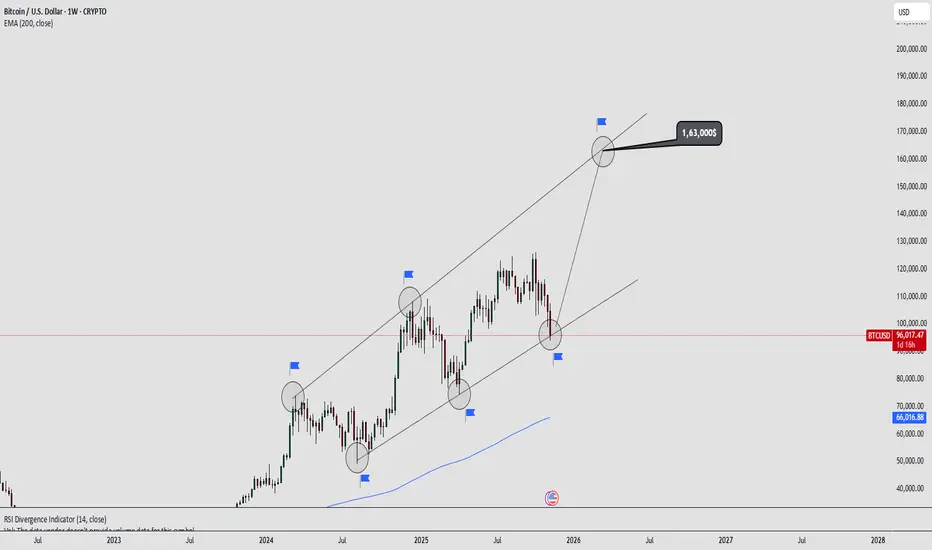
Bitcoin Long-Term Channel Analysis | BTCUSD to $163K Target |Bitcoin is currently respecting a multi-year ascending channel on the weekly chart. The price recently touched the lower trendline support, suggesting that the long-term structure is still intact.
This setup highlights a classic “higher highs and higher lows” pattern within the parallel channel, sh
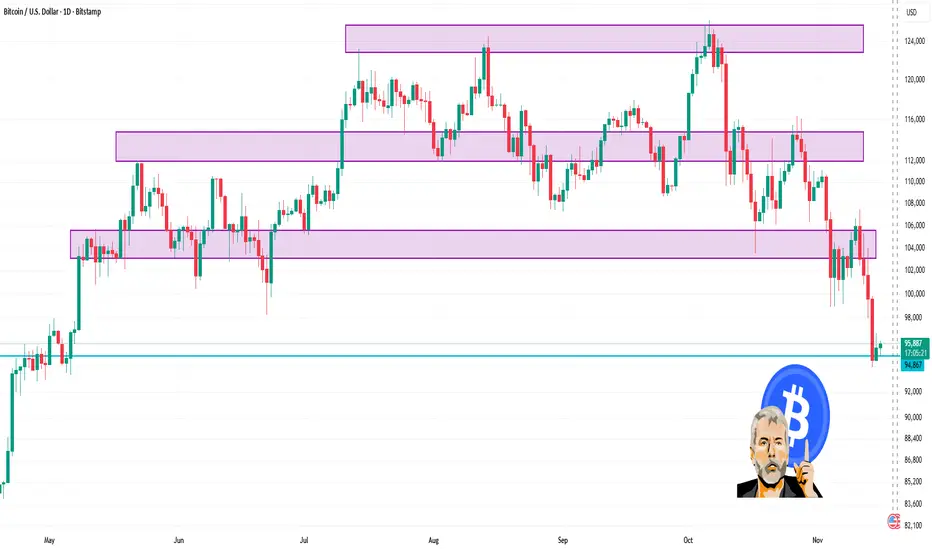
#BTC Technical Update: Structure Playing Out With Precision#BTC Technical Update: Structure Playing Out With Precision
CRYPTOCAP:BTC has tapped the $95K zone, completing the corrective leg projected when price was rejecting the $115K–$110K range.
Key downside levels already reached:
➡️ $105K ✔️
➡️ $93K ✔️
As long as price fails to break and close above
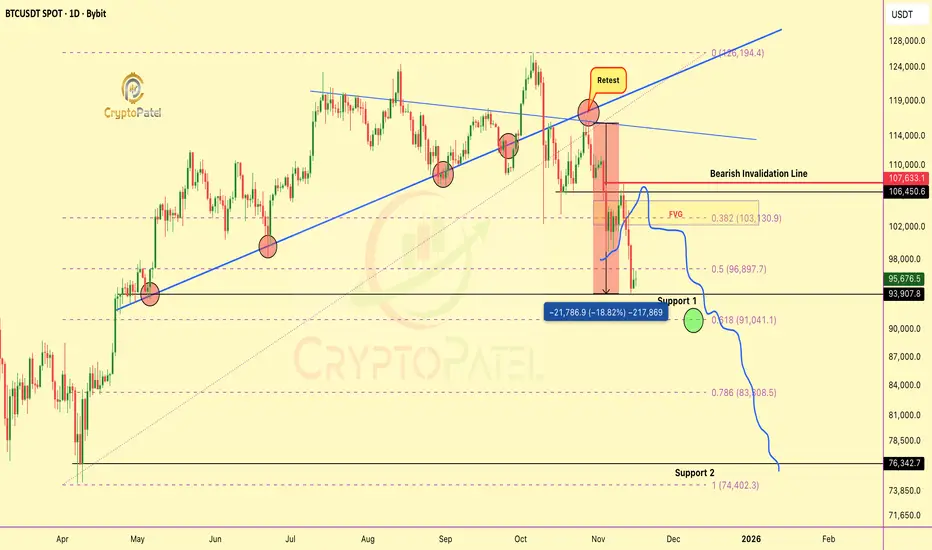


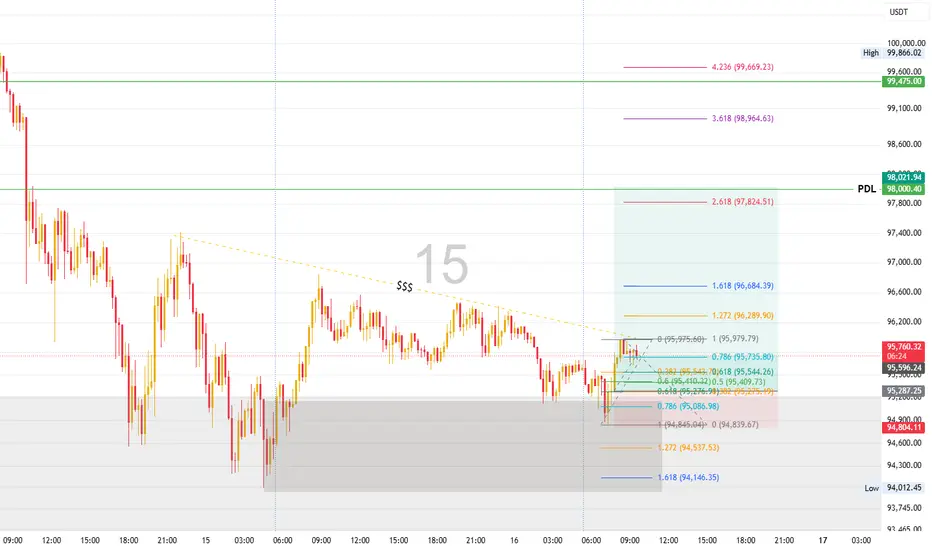
BTCUSD Retest Play: Buying the Dip Toward PDLYesterday BTC failed to tap the Previous Day’s Low (PDL), leaving an untouched liquidity pool below.
Today, price has already formed a liquidity buy zone at 95,665.95, which sits in a premium area.
I’m expecting BTC to potentially test the PDL, so I’m planning to buy on the dip.
📌 Entry: 95,279.63
BTC 1 Day Time Frame 🔍 Price snapshot:
1. It’s trading in the vicinity of ~US$95,900 (as per latest data) per coin.
2. Daily range (roughly) sits between ~US$94,800 and ~US$96,400 (depending on source).
3. Technical summary on the daily timeframe is leaning toward a “Strong Sell / Sell” bias per one analytics page.
BTC Weekly analysis and sell/Buy scenarios....BTC moved as per our plan throughout last week more than 13K points so far, and still in down trend. Price is continuously creating BOSs and moving toward our target of 90K. Meanwhile during sniper delivery, it has created some pull back zones, which can be tested before reaching to our target. So

BTC at strong support levelBTC seems to have completed wave E of an expanding triangle.
-- EXPANDING TRIANGLE--
Wave E is generally equal to (101-161.8)% of Wave C.
In rare cases it could also be equal to 261.8% of Wave A or Wave C
---------------------------------
Wave E is already equal to twice of wave C and if it sust


See all crypto ideas
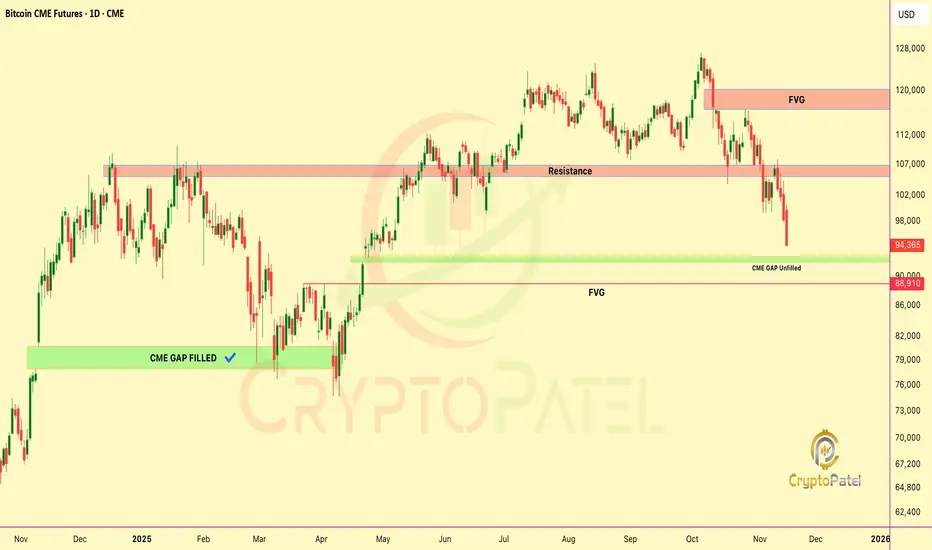
Bitcoin Next move $70k or $120k?CRYPTOCAP:BTC Is About to Bounce From the Level Everyone Is Ignoring
CME Gap 👉 $91,170
FVG below 👉 $89,020
Both zones = liquidity magnets.
No upside CME gaps left… only 1 upside FVG at $120,370
My view:
Fill → Sweep → Strong bounce expected from $89K–$91K range.
Next major draw = $120K FVG.
NF
Gold/XAUSSD weekly analysis and possible sell/buy scenarios....Currently gold is showing pressure and generating sell signals. There are multiple sell opportunities developed in Gold in different time frames. And we can anticipate couple of opportunities out of these will trigger. Gold has already created CISD on HTF and tested daily FVG and changed delivery an

GOLD: The Bigger Picture is Finally Getting Clearer !Gold finally showed some clarity after weeks of structure, and now the bigger picture is lining up perfectly across the daily and multi-year weekly charts. The rejection from the 4250–4350 zone triggered the first meaningful retracement after a parabolic rally, and price is now hovering right abov

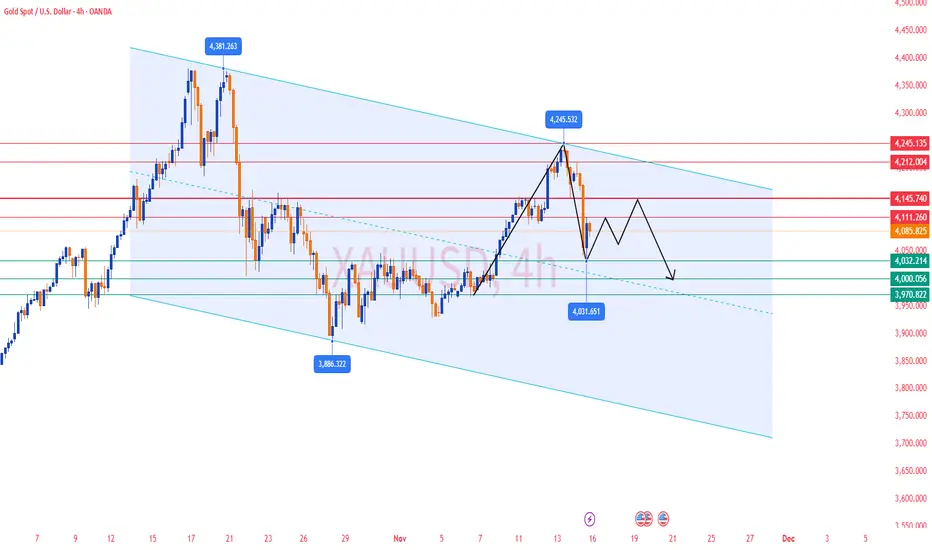
LiamTrading – XAUUSD H1 | Two scenarios for the new weekLiamTrading – XAUUSD H1 | Two scenarios for the new week: wait for reactions at 4100 & Fibonacci zone – prioritise bullish trades when the market recovers
Gold is completing a technical rebound after a sharp drop, and H1 is showing two clear scenarios for the new week. The medium-term trend remains

XAUUSD: Continuing Uptrend with Potential Expansion to $4,280OANDA:XAUUSD has shown strong performance in the ascending channel, and I expect this trend to continue as shown in my chart, with a target price of $4,280.
The current area represents a key turning point, where prices could find support allowing them to rise, or they may break down, which could l

Gold Trading Strategy for Next Week✅ From the daily chart, gold closed with a large bearish candle, showing a clear decline. Short-term rebound pressure is heavy and market sentiment has turned bearish. The 4000 psychological level is the key support: if it holds, gold may continue to fluctuate within the upper range; if it breaks, t
XAUUSD MULTI TIMEFRAME ANALYSIS Hello traders , here is the full multi time frame analysis for this pair, let me know in the comment section below if you have any questions , the entry will be taken only if all rules of the strategies will be satisfied. wait for more price action to develop before taking any position. I suggest yo

Gold (Neowave Trading Idea)Hello everyone
# Gold is started walking again in daily charts and its going or atleast try for the time being to break its all time again.
## Stoploss will be 3964 if breaks dont sell just exit.
Thanks

Elliott Wave Analysis – XAUUSD (Week 3, November)
1. Momentum
W1 Timeframe
W1 momentum is preparing to turn upward. This suggests that within 1–2 weeks, weekly momentum may reverse, potentially starting a medium-term bullish phase lasting 4–5 weeks. It also signals that the current bearish trend may weaken next week.
D1 Timeframe
D1 momentum has

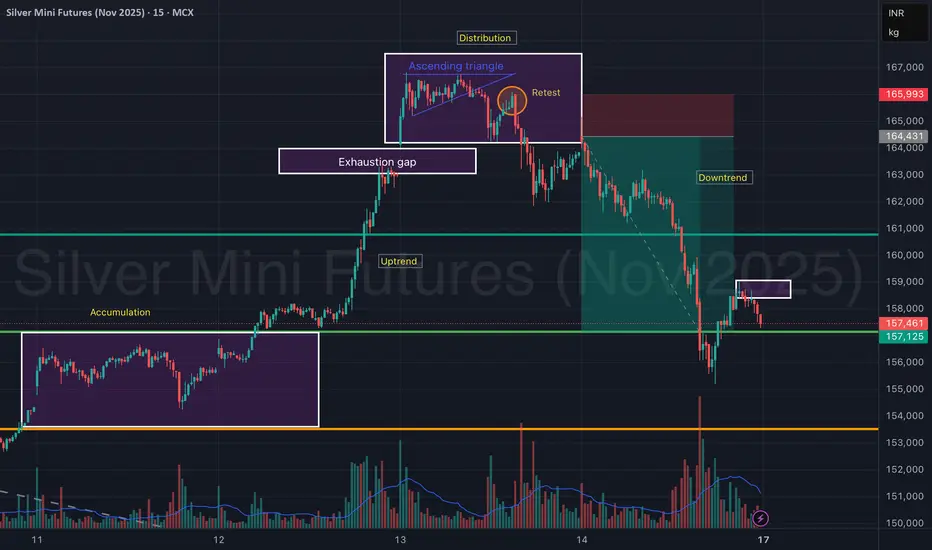
Silver Mini Futures (Nov 2025) – Accumulation to Distribution Silver Mini Futures on the 15-min chart clearly showcases a complete market cycle structure — transitioning from accumulation → uptrend → distribution → downtrend, providing an excellent study in price behavior and volume confirmation.
The move began with accumulation around ₹1,55,000, followed by
See all futures ideas
EUR/USD – Growth Opportunity After Positive DataThe EUR/USD pair is currently trading around 1.1612, up by 0.2% ahead of the September industrial production data from the Eurozone. This data is expected to show a 0.7% recovery for the month, following a sharp 1.2% decline the previous month. This is a positive signal for the Euro and could

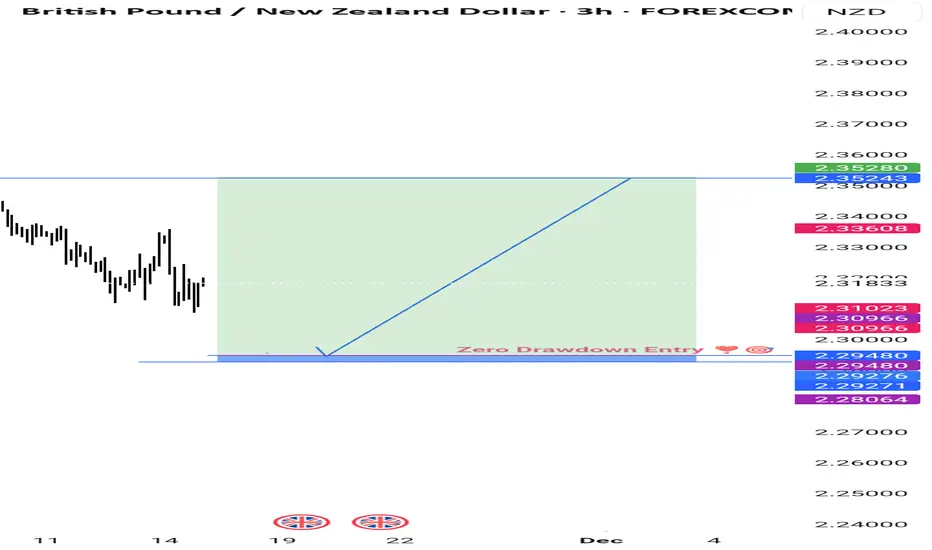
Zero DD Entry - Geometrical Analysis Self-similarity is a property where an object is partly or entirely similar to itself when viewed at different scales. This means that if you zoom in on a part of the object, it looks like the whole object, and this pattern can repeat infinitely for mathematical fractals. Many natural phenomena, suc
USDJPY MULTI TIMEFRAME ANALYSIS Hello traders , here is the full multi time frame analysis for this pair, let me know in the comment section below if you have any questions , the entry will be taken only if all rules of the strategies will be satisfied. wait for more price action to develop before taking any position. I suggest yo

EURUSD – Bullish Setup Toward 1.16EURUSD – Bullish Setup Toward 1.17
EURUSD is showing strong signs of a bullish reversal after an extended period of downside movement. The 3H chart highlights several Market Structure Shifts (MSS) and Breaks of Structure (BOS) suggesting that bearish momentum is fading and buyers are regaining cont

USDJPY Vulnerable to Deep Pullback After Wave 5USDJPY has completed a full 5-wave rising structure inside a clear wedge pattern, which usually signals exhaustion. The final Wave (5) shows weakening momentum, and price is beginning to slip below the wedge support — an early sign that the trend may be reversing. This suggests the pair is likely en

TRADE JOURNAL GBPUSD LONG 13/11/2025Wassup Lads!!
As discussed earlier we were looking to go long after either eurusd or gbpusd tapped into the daily FVG, so yesterday gbpusd tapped into the daily FVG turtle souping the lows, confirmed long by the strong rejection and formation of a bullish orderflow. I had set an alert on the orderbl

EUR/USD Target CompletedTarget Completed EUR/USD Market. 100% Success Fundamentals Analysis.
(Sudarshana N Adhikari)

AUDCAD_Short Elliot Wave I anticipate AUDCAD to form an ABC pattern targeting 0.9060, with a strict stop-loss at 0.9216. The risk-to-reward ratio is 1:4. Please conduct your own research before executing any trade.

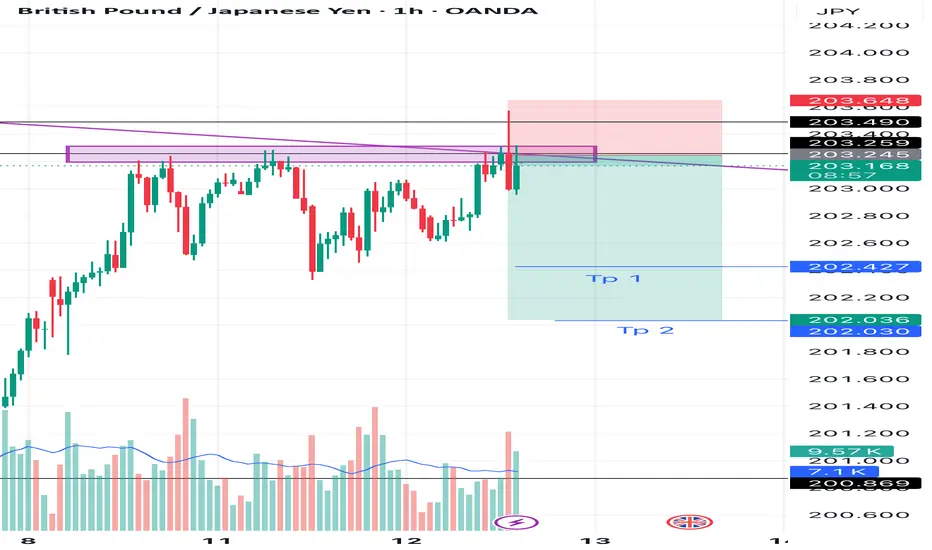
GBPJPY SHORT 1H TIME FRAME I am sitting in short of GBPJPY on 1H Time frame
Logic :- i can clearly see a good rejection with huge volumes from resistance and buyers are trapped, Sellers are gaining control so i am going for 1:2/3.
Let’s see one can take with proper SL gand targets given ✅
Trust the process 🚀, A lot more to
NZD CAD ShortThis idea is for educational purpose only , this is not a recommendation of buy or sell ,

See all forex ideas
| - | - | - | - | - | - | - | - | ||
| - | - | - | - | - | - | - | - | ||
| - | - | - | - | - | - | - | - | ||
| - | - | - | - | - | - | - | - | ||
| - | - | - | - | - | - | - | - | ||
| - | - | - | - | - | - | - | - | ||
| - | - | - | - | - | - | - | - | ||
| - | - | - | - | - | - | - | - | ||
| - | - | - | - | - | - | - | - |
Trade directly on the supercharts through our supported, fully-verified and user-reviewed brokers.


