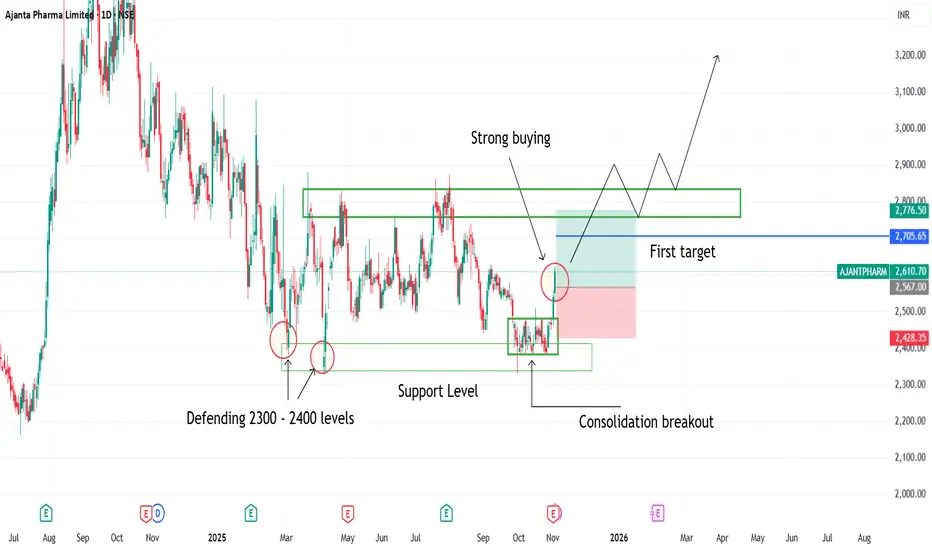
Consolidation breakout seen in ajanta pharma1. Consolidation breakout seen in ajanta pharma
2. Buyers defending 2300 2400 levels
3. Strong Bullish candles indicating strong buyers strength
4. Consolidation breakout has been happened on support levels

The best trades require research, then commitment.
Get started for free$0 forever, no credit card needed

Scott "Kidd" PoteetThe unlikely astronaut

Where the world does markets
Join 100 million traders and investors taking the future into their own hands.
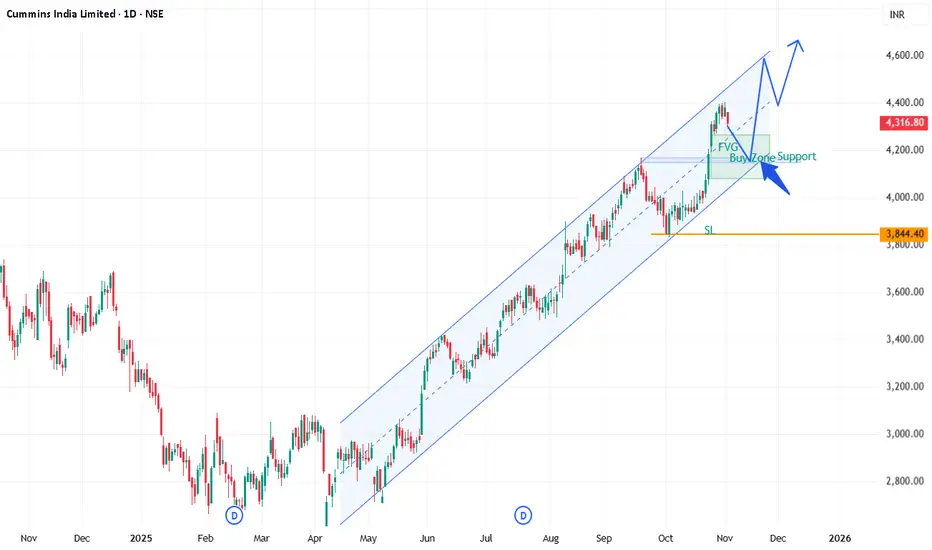
CUMMINSINDCUMMINSIND, Channel support, FVG entry, risk:reward 1:1.5
Cummins India Limited (CUMMINSIND) reported strong financial results for the second quarter (Q2) of FY 2025-26:
Revenue: ₹2,444 crore, up 31% YoY and 8% QoQ, driven by 47% domestic sales growth despite a 13% YoY export decline.
Net Prof
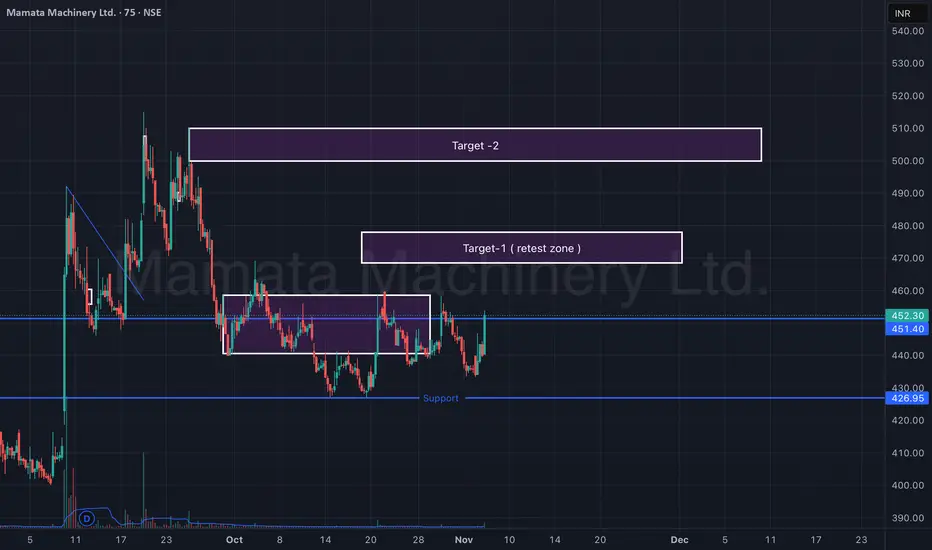
Mamata Machinery Ltd – Support Reversal & Retest Zone (75-min)Mamata Machinery is showing early signs of reversal from a strong support zone around ₹425–₹430. After forming a double-bottom-like structure, the stock has bounced sharply with rising volumes, indicating a possible short-term trend reversal.
Currently, price action is approaching a retest zone (Ta
KPILAscending Channel (Main Structure)
• The stock is trading within an upward-sloping channel, making higher highs and higher lows.
• The lower trendline acts as dynamic support, and the upper trendline as resistance.
Rectangle / Box Range (Recent Phase)
• Price consolidated between 1,220–1,310 for

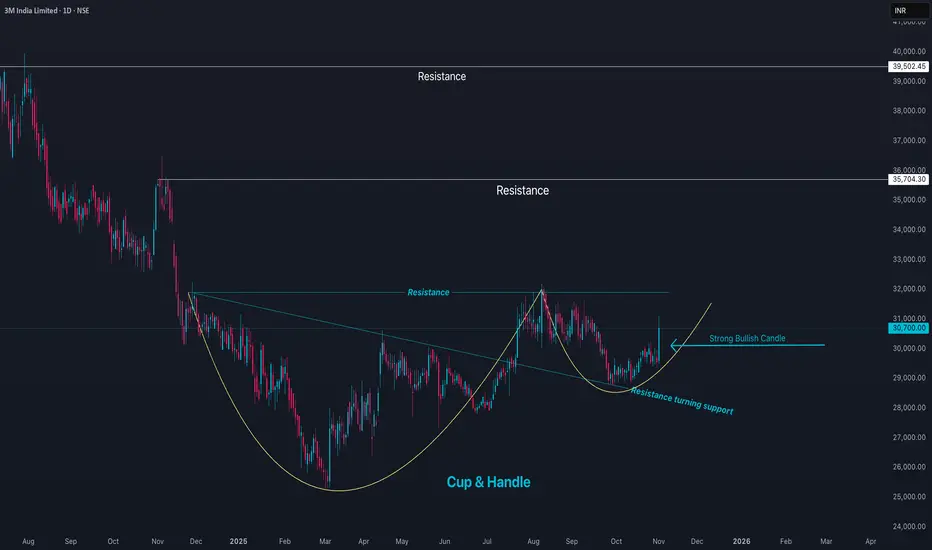
3MINDIA Price Action3M India Limited (3MINDIA) is currently trading around ₹30,865, marking a strong 4.4% rise in the latest session. The stock has a 52-week high near ₹37,133 and a low around ₹25,718, placing it closer to the upper end of its annual range. The market capitalization is approximately ₹33,300 crore.
3M
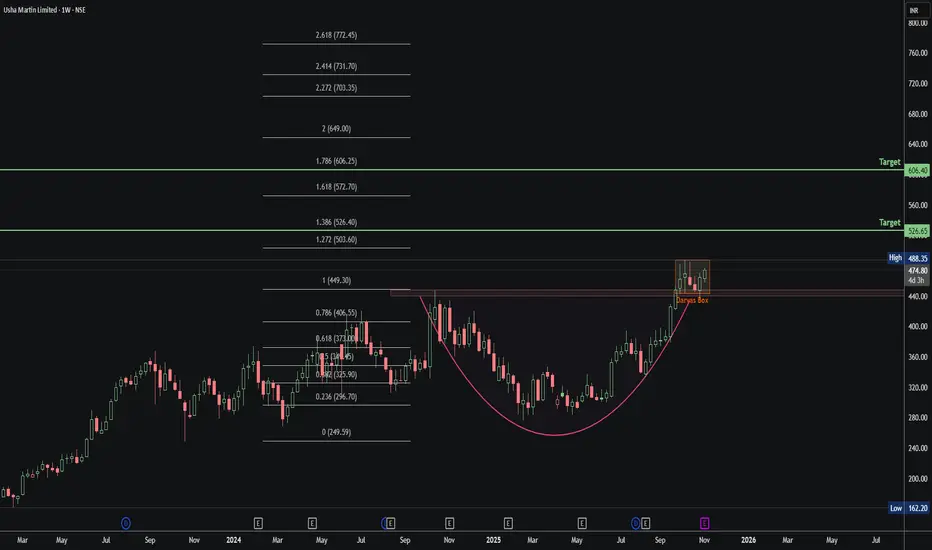
Usha Martin: Cup & Handle Breakout Loading!🧩 1. Cup & Handle Setup
Smooth U-shaped Cup with a tight Darvas Box Handle on top.
Classic bullish continuation structure — breakout confirmation above ₹488.
📈 2. Fibonacci Outlook
0.786 (₹406) → Neckline retest
1.0 (₹449) → Cup breakout
1.272 (₹503) / 1.386 (₹526) → 🎯 Short-term targets
1.61
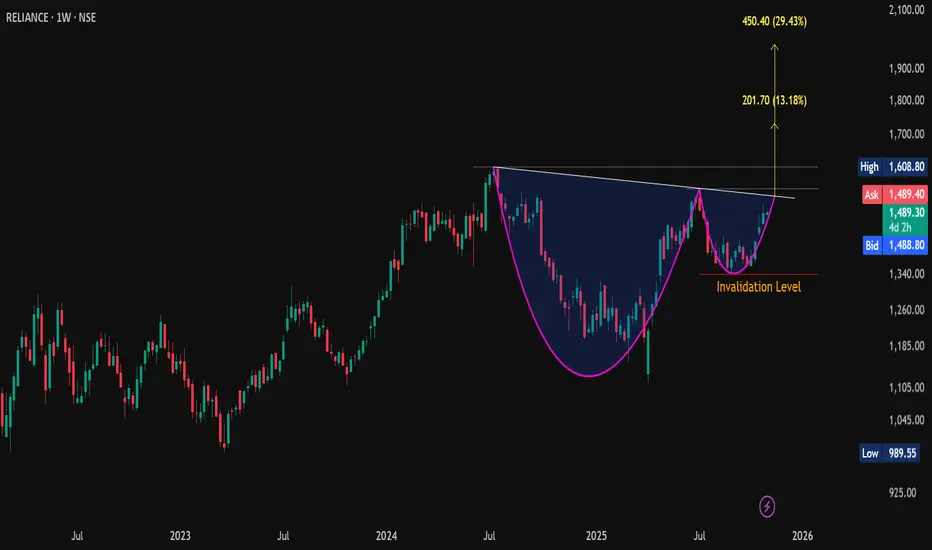
#Reliance | Cup & Handle Breakout Setup📊 CMP: 1489
💥 Breakout Level: WCB above Handle Neckline
🎯 Pattern Targets: 1730 / 1980+ (16 & 33% from CMP)
🛡 Support: 1456 / 1407-1409
🚧 Resistance: 1527-1551 / 1597-1609
❌ Invalidation Level: Below 1340.60 (WCB)
#CupnHandle #ChartPattern #PriceAction #SwingTrade
📌 Disclaimer: Thi
Privi Speciality Chemicals Ltd – Weekly Breakout SetupPrivi has shown a clean breakout from a long consolidation zone, backed by steady volume expansion. After months of range-bound action, the stock finally broke above ₹2,600 and is now sustaining well above its breakout zone — indicating the start of a new upward leg.
Price action shows strong bullis

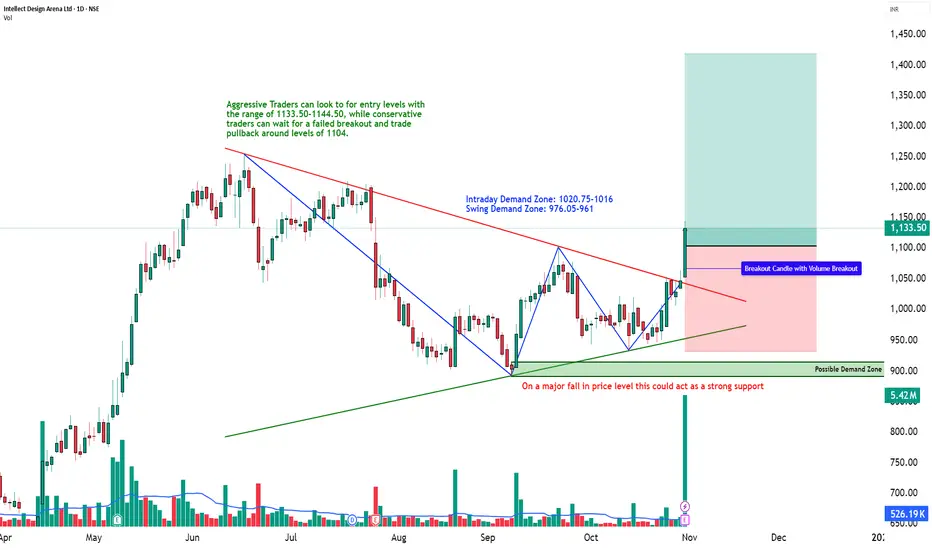
Descending Triangle Breakout with Institutional Volume | STWP💹 Intellect Design Arena Ltd (NSE: INTELLECT)
Sector: IT – FinTech Solutions | CMP: ₹1,133.50 | View: Bullish Momentum Breakout Setup
📊 Price Action:
Intellect Design Arena has delivered a strong bullish breakout from its multi-month descending trendline, marking a structural shift from a consolida
NIFTY Breakout Retest — Bulls Getting ReadyNIFTY appears to be forming a classic Cup and Handle pattern, a strong bullish continuation setup. Recently, the index successfully broke out above the handle resistance zone, confirming the pattern’s validity. Currently, it is pulling back to retest the breakout level, which often serves as a healt

See all editors' picks ideas
LogNormalLibrary "LogNormal"
A collection of functions used to model skewed distributions as log-normal.
Prices are commonly modeled using log-normal distributions (ie. Black-Scholes) because they exhibit multiplicative changes with long tails; skewed exponential growth and high variance. This approach i

Range Oscillator (Zeiierman)█ Overview
Range Oscillator (Zeiierman) is a dynamic market oscillator designed to visualize how far the price is trading relative to its equilibrium range. Instead of relying on traditional overbought/oversold thresholds, it uses adaptive range detection and heatmap coloring to reveal where pri

Volume Surprise [LuxAlgo]The Volume Surprise tool displays the trading volume alongside the expected volume at that time, allowing users to spot unexpected trading activity on the chart easily.
The tool includes an extrapolation of the estimated volume for future periods, allowing forecasting future trading activity.
🔶 U

Smooth Theil-SenI wanted to build a Theil-Sen estimator that could run on more than one bar and produce smoother output than the standard implementation. Theil-Sen regression is a non-parametric method that calculates the median slope between all pairs of points in your dataset, which makes it extremely robust to o

Fair Value Gaps by DGTFair Value Gaps
A refined, multi-timeframe Fair Value Gap (FVG) detection tool that brings institutional imbalance zones to life directly on your chart.
Designed for precision, it visualizes how price delivers into inefficiencies across chart, higher, and lower (intrabar) timeframes — offering a fl

TASC 2025.11 The Points and Line Chart█ OVERVIEW
This script implements the Points and Line Chart described by Mohamed Ashraf Mahfouz and Mohamed Meregy in the November 2025 edition of the TASC Traders' Tips , "Efficient Display of Irregular Time Series”. This novel chart type interprets regular time series chart data to create an ir

Simplified Percentile ClusteringSimplified Percentile Clustering (SPC) is a clustering system for trend regime analysis.
Instead of relying on heavy iterative algorithms such as k-means, SPC takes a deterministic approach: it uses percentiles and running averages to form cluster centers directly from the data, producing smoo

Adaptive Volume Delta Map---
📊 Adaptive Volume Delta Map (AVDM)
What is Adaptive Volume Delta Map (AVDM)?
The Adaptive Volume Delta Map (AVDM) is a smart, multi-timeframe indicator that visualizes buy and sell volume imbalances directly on the chart.
It adapts automatically to the best available data resolution

Dynamic Equity Allocation Model"Cash is Trash"? Not Always. Here's Why Science Beats Guesswork.
Every retail trader knows the frustration: you draw support and resistance lines, you spot patterns, you follow market gurus on social media—and still, when the next bear market hits, your portfolio bleeds red. Meanwhile, institution

First Passage Time - Distribution AnalysisThe First Passage Time (FPT) Distribution Analysis indicator is a sophisticated probabilistic tool that answers one of the most critical questions in trading: "How long will it take for price to reach my target, and what are the odds of getting there first?"
Unlike traditional technical indicators

See all indicators and strategies
Community trends
Darvas Box #Screener — Catch Stocks Before the Breakout!
🚨 Darvas Box #Screener — Catch Stocks Before the Breakout!
📉➡️📈
💥 Tight Consolidation = Big Momentum !
✅ Low Risk, High Reward Setups
✅ catch Big move with Trailing SL
CUMMINSINDCUMMINSIND, Channel support, FVG entry, risk:reward 1:1.5
Cummins India Limited (CUMMINSIND) reported strong financial results for the second quarter (Q2) of FY 2025-26:
Revenue: ₹2,444 crore, up 31% YoY and 8% QoQ, driven by 47% domestic sales growth despite a 13% YoY export decline.
Net Prof
Consolidation breakout seen in ajanta pharma1. Consolidation breakout seen in ajanta pharma
2. Buyers defending 2300 2400 levels
3. Strong Bullish candles indicating strong buyers strength
4. Consolidation breakout has been happened on support levels
Mamata Machinery Ltd – Support Reversal & Retest Zone (75-min)Mamata Machinery is showing early signs of reversal from a strong support zone around ₹425–₹430. After forming a double-bottom-like structure, the stock has bounced sharply with rising volumes, indicating a possible short-term trend reversal.
Currently, price action is approaching a retest zone (Ta
KPILAscending Channel (Main Structure)
• The stock is trading within an upward-sloping channel, making higher highs and higher lows.
• The lower trendline acts as dynamic support, and the upper trendline as resistance.
Rectangle / Box Range (Recent Phase)
• Price consolidated between 1,220–1,310 for
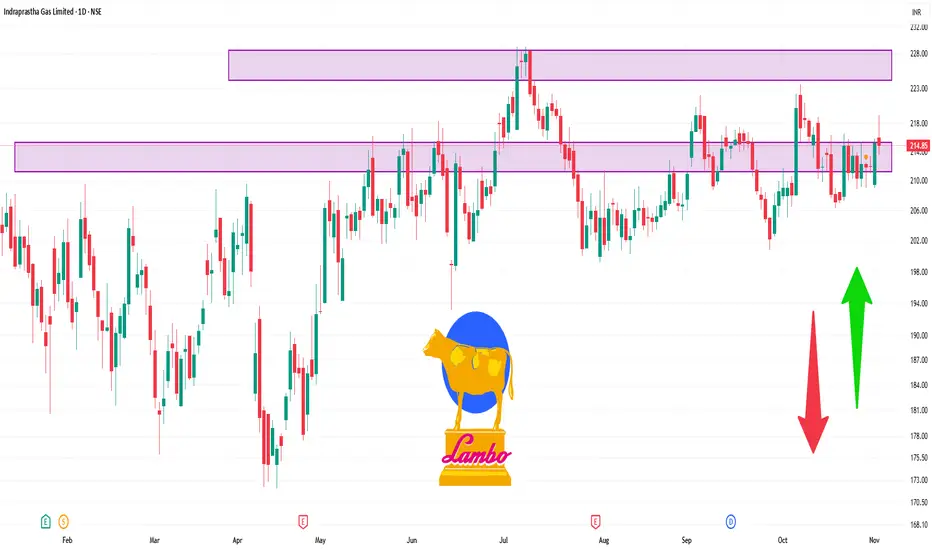
IGL 1 Day Time Frame 🔍 Current Price
Latest quoted price is ~ ₹ 212.33.
Previous close ~ ₹ 211.16.
The stock is trading above its 50-day, 100-day & 200-day moving averages (e.g., ~₹ 212.92 for 50-day) which suggests the medium-term trend remains intact.
📏 Key Pivot / Support & Resistance Levels (Daily)
Based on rece
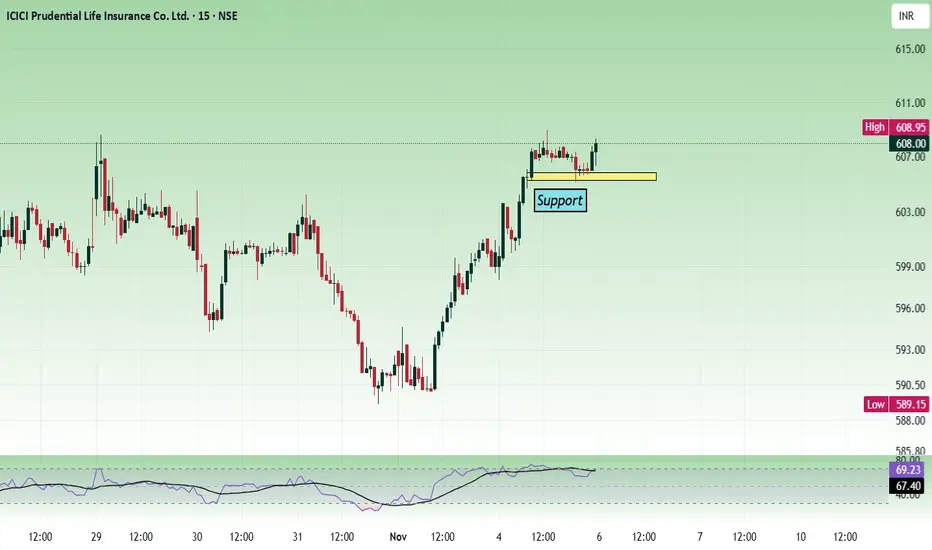
ICICI Prudential - Multi time frame analysis...In the lower time frame, the price is taking support from the support zone at 605. The daily time frame shows, the price was consolidating in the range of 580 to 610, and now it is getting ready to give a breakout.
The candle formation in the daily chart is showing strength. Buy above 604 - 606 wi
3MINDIA Price Action3M India Limited (3MINDIA) is currently trading around ₹30,865, marking a strong 4.4% rise in the latest session. The stock has a 52-week high near ₹37,133 and a low around ₹25,718, placing it closer to the upper end of its annual range. The market capitalization is approximately ₹33,300 crore.
3M
DMart(Avenue Supermarts Ltd) – A Correction Inside a CorrectionOn the daily chart, DMart(Avenue Supermarts Ltd) appears to be unfolding a clean (a)-(b)-(c) correction within the ongoing downtrend from ₹4,949.50.
The initial leg down to ₹4,111 unfolded in five waves, marking Wave (a) of the correction. A relief rally is likely next — an expected Wave (b) move th

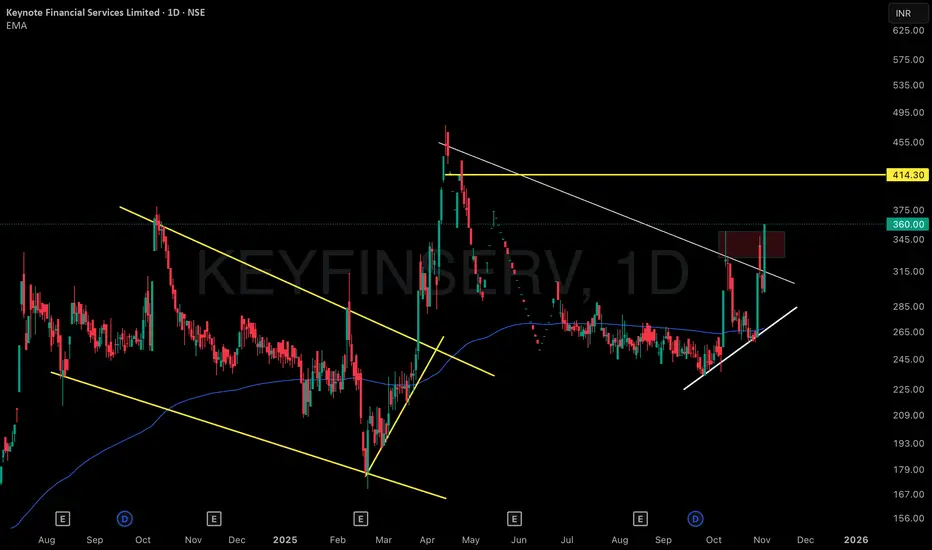
Recurring VCP Structures: Multi-Phase Consolidation & Expansion1 . This chart distinctly showcases a series of visually captivating Volatility Contraction Patterns (VCPs) across multiple phases, elegantly demarcated by yellow trendlines that map out both historical and present consolidation zones. Each contraction zone is marked by repeated, precise touches on
See all stocks ideas
Tomorrow
ZYDUSLIFEZydus Lifesciences Limited
Actual
—
Estimate
11.89
INR
Tomorrow
PARASParas Defence & Space Technologies Ltd.
Actual
—
Estimate
5.30
INR
Tomorrow
AKZOINDIAAkzo Nobel India Limited
Actual
—
Estimate
—
Tomorrow
JSLLJeena Sikho Lifecare Limited
Actual
—
Estimate
—
Tomorrow
KSCLKaveri Seed Co. Ltd.
Actual
—
Estimate
2.00
INR
Tomorrow
BSOFTBirlasoft Limited
Actual
—
Estimate
4.18
INR
Tomorrow
NCCNCC Limited
Actual
—
Estimate
3.00
INR
Tomorrow
INDIGOPNTSIndigo Paints Ltd
Actual
—
Estimate
5.60
INR
See more events
Community trends
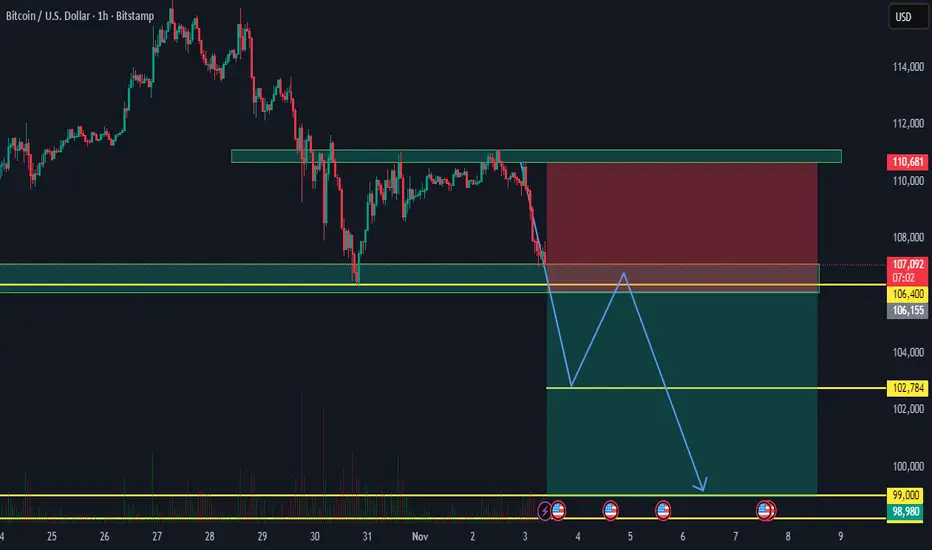
BITCOIN 1HRSWING TRADE
- EARN WITH ME DAILY 10K-20K –
BITCOIN Looking good for Downside..
When it break level 106400 and sustain.. it will go Downside...
SELL @ 106400
Target
1st 102784
2nd 99000
Enjoy trading traders.. Keep add this STOCK in your watch list..
Big Investor are welcome..
Like this Post??? H
(ETH/USD, 3-hour imeframe...(ETH/USD, 3-hour timeframe, Bitstamp):
The chart clearly shows a descending channel with price breaking below the lower boundary, confirming strong bearish momentum.
The Ichimoku Cloud is fully bearish, and price action is below all major cloud levels — confirming continuation to the downside.
My

ATTENTION: Bitcoin May Revisit $55K?⚠️ ATTENTION: Bitcoin May Revisit $55K: Here's The HTF Order Block You Need To Know
Don’t panic, this is not a bear market, just a retracement before the next leg up. My current plan:
▶️ Buy Zone: $65,000 – $55,000 (strong support)
▶️ Previous Exit: $122,000 (if you followed my earlier call)
*Char

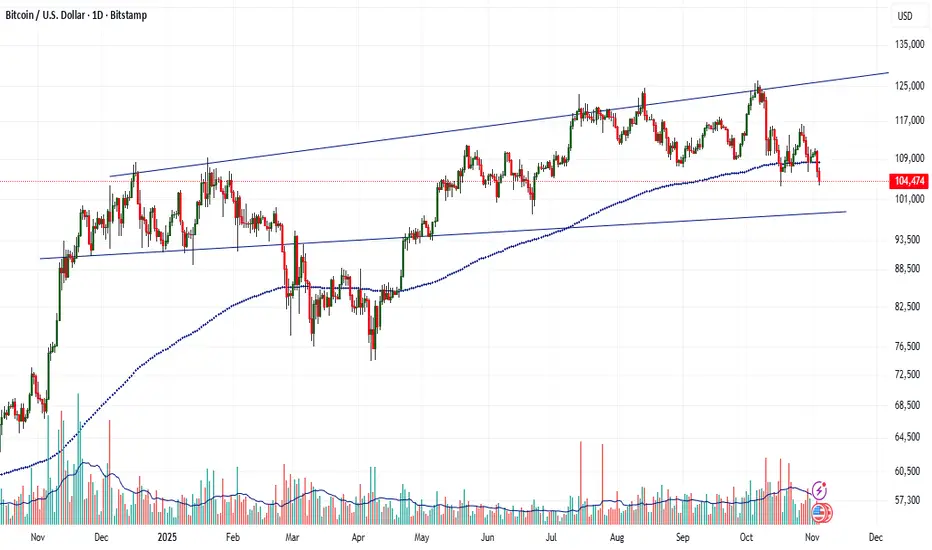
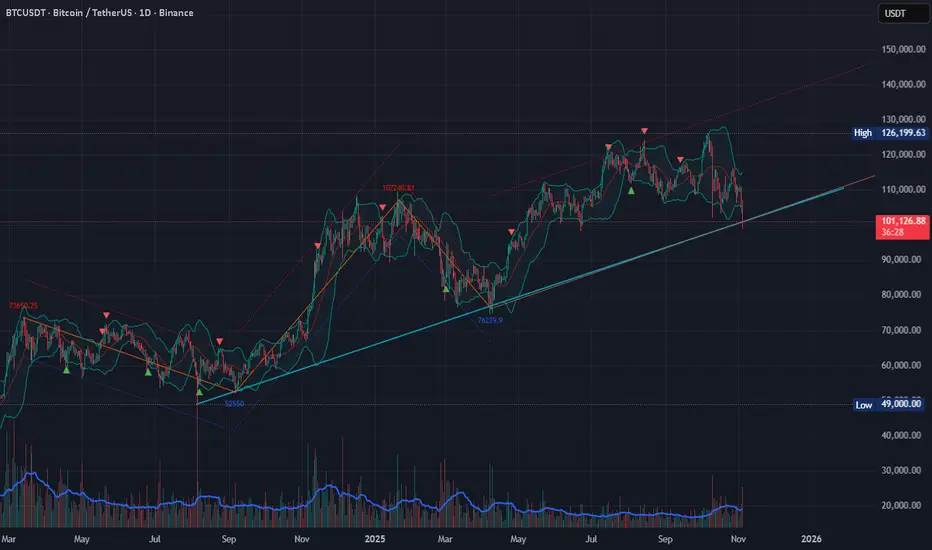
BTC New ATH or Low??BTC bounced around the 0.236 level ($98K) — a healthy retracement zone in a strong uptrend.
The corrective structure from ~$125K to ~$95K looks like a wave-4 correction.
The dotted trendline in your chart shows strong ascending support, which has held since early 2023. No major distribution signs ye

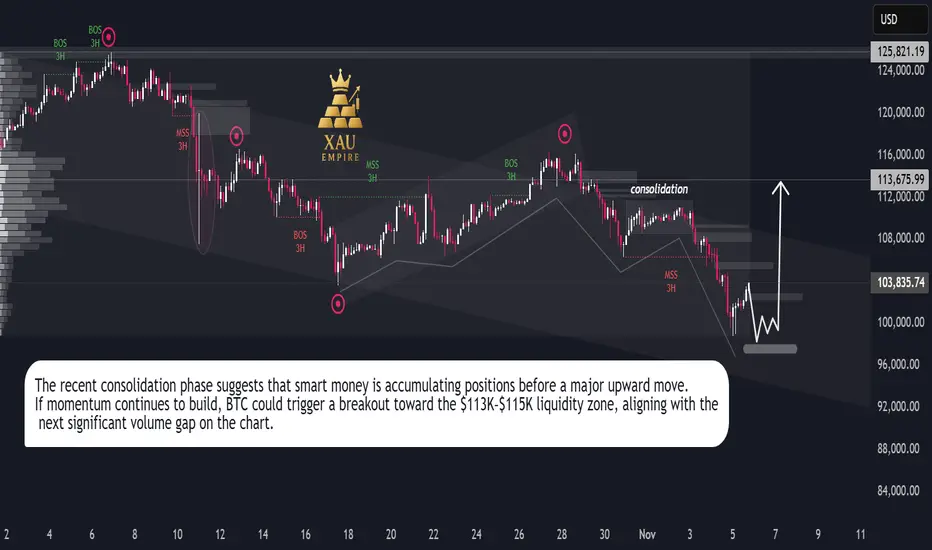
Bitcoin Bulls Target $113K**Bitcoin (BTC/USD) Analysis — November 2025**
Bitcoin has been moving within a controlled downtrend channel, facing continuous lower highs since late October. The market recently went through a **liquidity sweep**, followed by a minor **market structure shift (MSS)** on the 3-hour timeframe. This
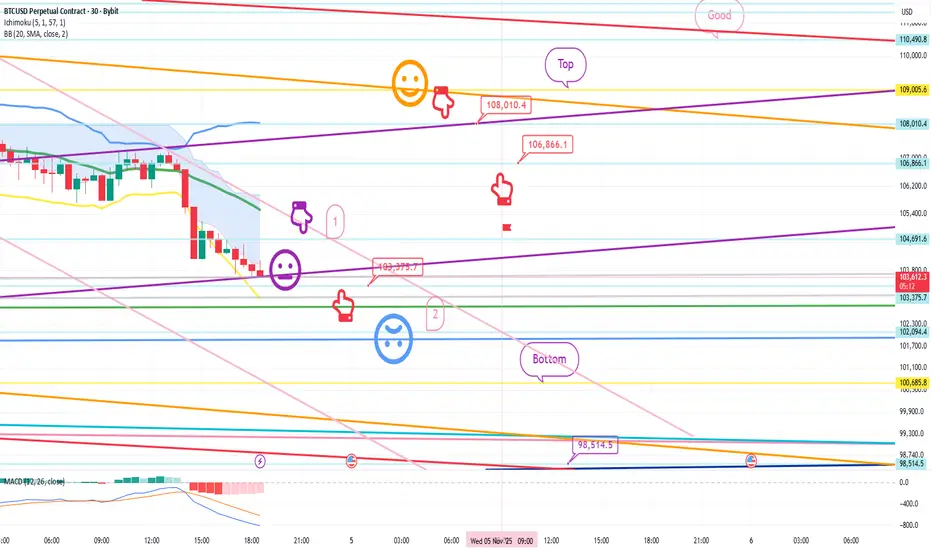
Bitcoin Bybit chart analysis November 4Hello
It's a Bitcoin Guide.
If you "follow"
You can receive real-time movement paths and comment notifications on major sections.
If my analysis was helpful,
Please click the booster button at the bottom.
This is the Bitcoin 30-minute chart.
The Nasdaq indicators will be released shortly at no
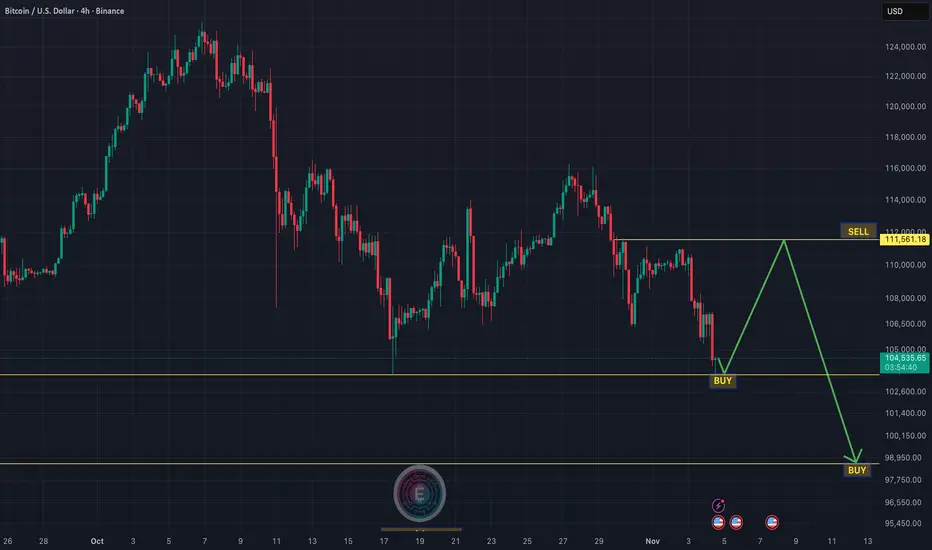
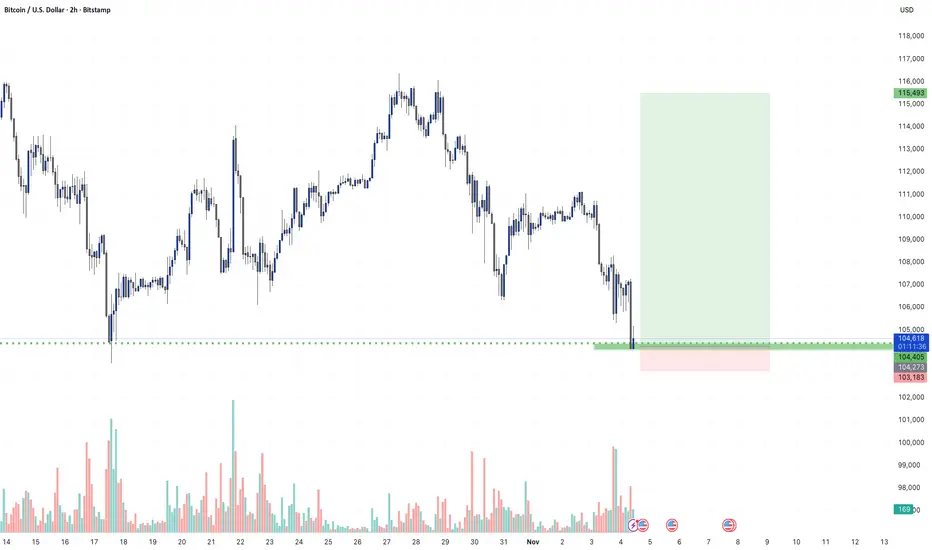
Bitcoin (BTCUSDT) Analysis - 4H TimeframeBitcoin is currently trading near a strong support zone ($104,000–$102,500), which has previously acted as a major accumulation area.
From a technical perspective, BTC seems to be completing the final leg of a correction phase, and I’m expecting a possible bounce from this region toward the upper r
LONG TERM GOALS WITH BTC After analyzing BTC data over the past 0 TO ATH, this level stands out as the true zone for a potential pullback — a key area where the market shows genuine reaction and accumulation before the next move.
watch this trendline in BTCwe clearly havea trendline here, must hold 98k,
anyway looks like capitulation like IPOs, nowsecondvawe must begin imo
See all crypto ideas
XAUUSDUS has 35 trillion dollars dept and its going to pay everyday interest of 25000 crs if jobs rates once completed we have clear about interest rate cut if i had happen US market is gonna crash and safest investment like gold ,silver and bonds gonna rise let’s hope all gonna good
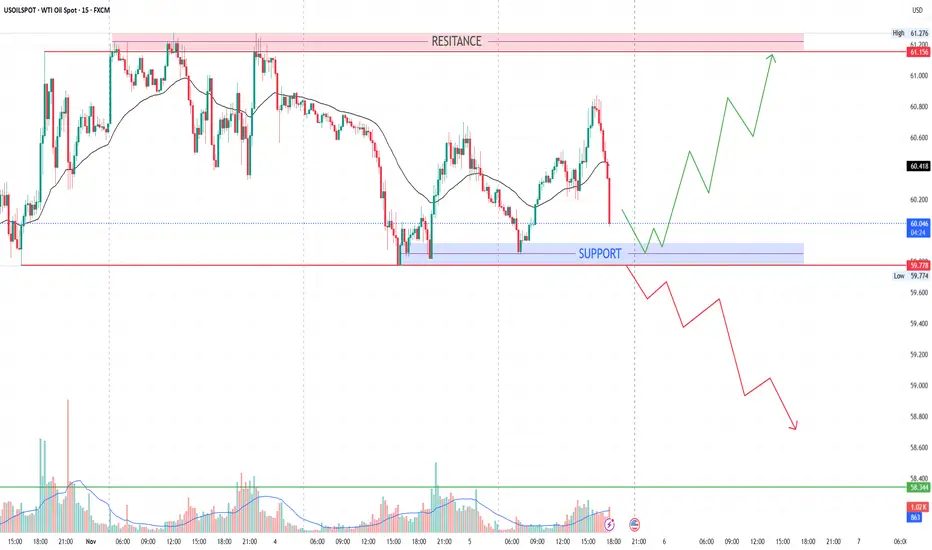
Today support & resistance for USOIL Here's a trading plan based on the provided USOILSPOT data:
**Trading Strategy**
* **Buy Entry:** Around 60.136 (as indicated in the "BUY" zone).
* **Sell Entry:** Around 60.096 (as indicated in the "SELL" zone).
* **Stop-Loss Placement:**
* For Buy Trades: Place your stop-loss slightl
XAG/USD (Silver vs USD) chart on the 2-hour timeframe...XAG/USD (Silver vs USD) chart on the 2-hour timeframe:
Price is moving within a descending channel, still below the Ichimoku cloud, indicating continued bearish pressure.
The recent candle is showing a rejection from the upper band of the channel / cloud resistance area (around 47.9–48.1).
My mar

GOLD – TRIANGLE COMPRESSION ON H4 ✨ GOLD – TRIANGLE COMPRESSION ON H4, AWAITING A STRONG BREAKOUT IN WAVE 5 ✨
💬 Gold is accumulating in a compression triangle – when silence lasts too long, the market is about to speak.
Hi everyone 💖, Kristina is back with today's perspective on gold. I hope this analysis will help you – whether y

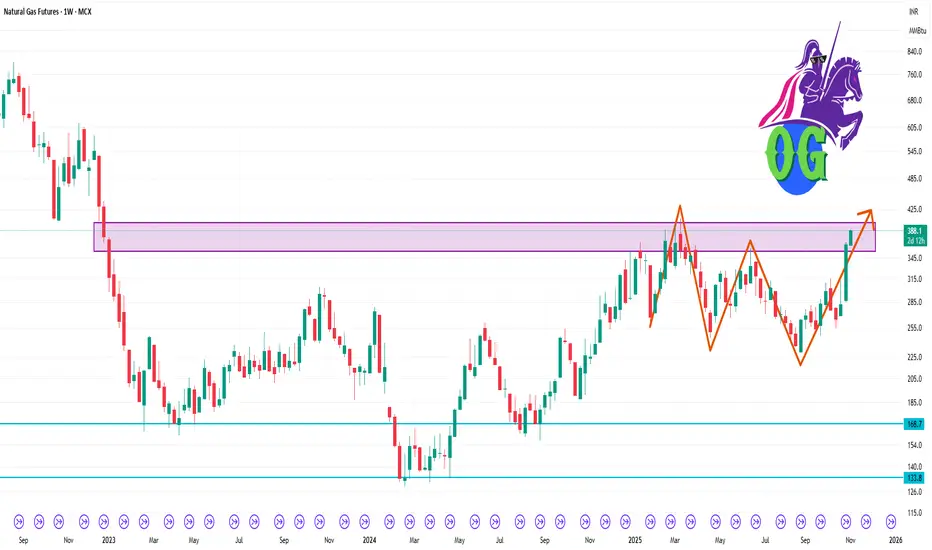
Natural Gas Futures 1 Week Time Frame 🎯 Key Levels
Support zone: ~ ₹ 270-285 per mmBtu — this appears to be a hinge demand zone based on recent pullbacks.
Intermediate support / pivot: ~ ₹ 295-310 — price has been oscillating near this zone.
Resistance zone: ~ ₹ 330-350 — breaking above this on a weekly close would shift structure mo
Gold is only bouncing backThe best phase of the gold bull run is over. The daily RSI has been relieved from the overbought condition, as has the weekly, but not the monthly. It will take a longer grinding cycle for that to happen. Gold is in a complex pattern in WXYXZ. Follow this slow grind, as it can take months to complet

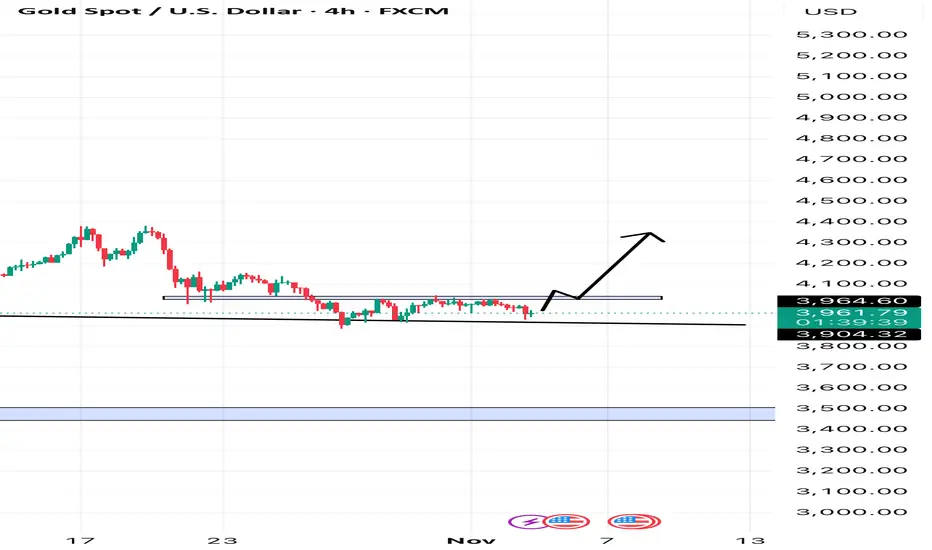
StevenTrading – XAUUSD StevenTrading – XAUUSD
The bullish scenario is activated after breaking the trendline
Hello everyone, StevenTrading is back with the latest update on the gold market.
After several sessions of accumulation, gold has officially broken the downward trendline, confirming a short-term reversal signal –

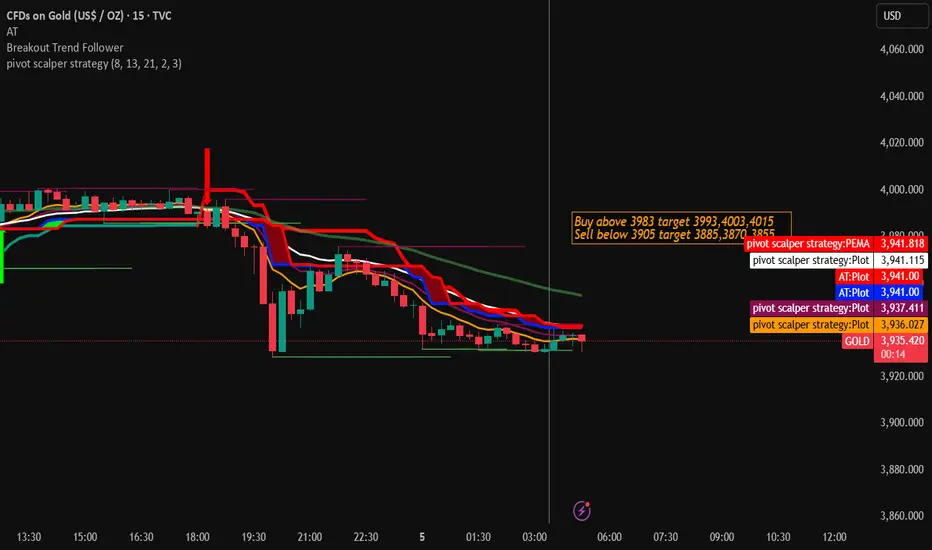
Gold Trading Strategy for 05th November 2025💰 GOLD TRADING PLAN 💰
📈 BUY PLAN:
➡️ Wait for the 1-hour candle to close above $3983.
Once it closes above that level, you can plan to buy above the high of that candle.
🎯 Targets (Profit Levels):
First target: $3993
Second target: $4003
Third target: $4015
💡 Tip: Don’t enter before the candle
Gold daily analysisintermediate 5 th wave completed rounded black numbers.Primary 3 wave also completed and now 4 th wave pull back is going on.it has not retraced 23.6 percent as of now.this rounded 3 rd wave red colour is extended one.primary 2 nd wave had retraced 50 percent of 1 st wave. we are waiting for complet

XAUUSD – Intraday H1 Plan Range-Bound Volatility(November 5, 2025)
🌐 MARKET CONTEXT
Gold is trading within a narrow range around ₹3,963 – ₹4,015, showing indecision between safe-haven demand and short-term profit-taking pressure.
After the previous New York session, price created a new local low near ₹3,962.92, then quickly rebounded as dip buye

See all futures ideas
GBP/USD (1-hour) chart...GBP/USD (1-hour) chart:
Price is moving within a descending channel, and currently testing the upper boundary of that channel.
The Ichimoku cloud above the price suggests a bearish bias, as price remains below the cloud.
There’s a projected leg down (green arrow) marked on my chart — pointing tow

USDJPY Setup preparing with 3x confluence?Intraday with M15 down to FIB Retracement zone (0.5 - 0.618) collab with FVG M15 and FVG 1H, thinking really strong support zone with setup: wait for liquility sweep --> BOS --> MSS. Confirmation: M5 - M15 need BOS or ingulfing candle really clearly strong pullup. Invalidation: 1H closed < 153.

GBP AUD BUYING SWING TIMEFRAME Buying GBPAUD on technical basis prices touched demand and gave further selling rejection and holding long till nearest supply. Also Stoploss is placed in system.

EUR/USD | Institutional Demand RejectionPrice action shows a clean liquidity sweep below the prior session’s low, tapping into a well-defined 5-min demand zone aligned with the 1H structural pivot. Orderflow shift confirmed as buy-side momentum emerged with displacement and follow-through above short-term structure.
Position initiated po

AUD/NZD Nearing Peak: Expect Controlled PullbackAUD/NZD has completed a clean 5-wave impulsive move to the upside, finishing Wave (1)/(A) near the recent peak. From here, the price looks ready to start a deeper correction in the form of Wave (2)/(B), which may pull back toward the lower support zone inside the rising channel. This corrective move

USDJPY UPDATE I’m also planning to go long on USDJPY in the next London session. I’ll be waiting for the price to sweep the previous day’s low, and once that happens, I’ll look for a intraday market structure shift before positioning myself for a long entry.
@okakotradingadmin

AUDNZD - OVERBOUGHT CONDITIONS HINTING AT A POSSIBLE REVERSALSymbol - AUDNZD
CMP - 1.1485
AUDNZD continues to maintain its upward trajectory, supported by fundamental divergence between the two economies. The Australian dollar remains resilient and continues to outperform the New Zealand dollar after the RBNZ implemented an aggressive 50 basis point rate cu

EUR/USD Outlook: Buyers Regain ControlThe EUR/USD market is beginning to show early signs of recovery momentum as sentiment gradually turns constructive. After an extended period of controlled weakness, the pair is attracting renewed interest from institutional participants positioning for a potential upward rotation in the coming sessi

USDJPY – Weekly Triangle Near a Big Decision !!The pair has been stuck inside a large weekly triangle formation, compressing price action after years of volatility. These types of structures usually lead to powerful breakouts, and the direction will depend on how the BoJ policy stance and the Fed’s rate cut cycle unfold.
Chart validation:
Pri

Trade Analysis: EUR/USDPair: EUR/USD
Entry: 1.15310
Stop Loss: 1.15547
Take Profit: 1.14801
EUR/USD is showing a short-term bearish structure with lower highs forming under resistance near 1.1550.
I’m watching for a continuation of the downtrend after a corrective pullback.
The entry is planned at 1.15310 with a stop loss

See all forex ideas
| - | - | - | - | - | - | - | - | ||
| - | - | - | - | - | - | - | - | ||
| - | - | - | - | - | - | - | - | ||
| - | - | - | - | - | - | - | - | ||
| - | - | - | - | - | - | - | - | ||
| - | - | - | - | - | - | - | - | ||
| - | - | - | - | - | - | - | - | ||
| - | - | - | - | - | - | - | - | ||
| - | - | - | - | - | - | - | - |
Trade directly on the supercharts through our supported, fully-verified and user-reviewed brokers.


