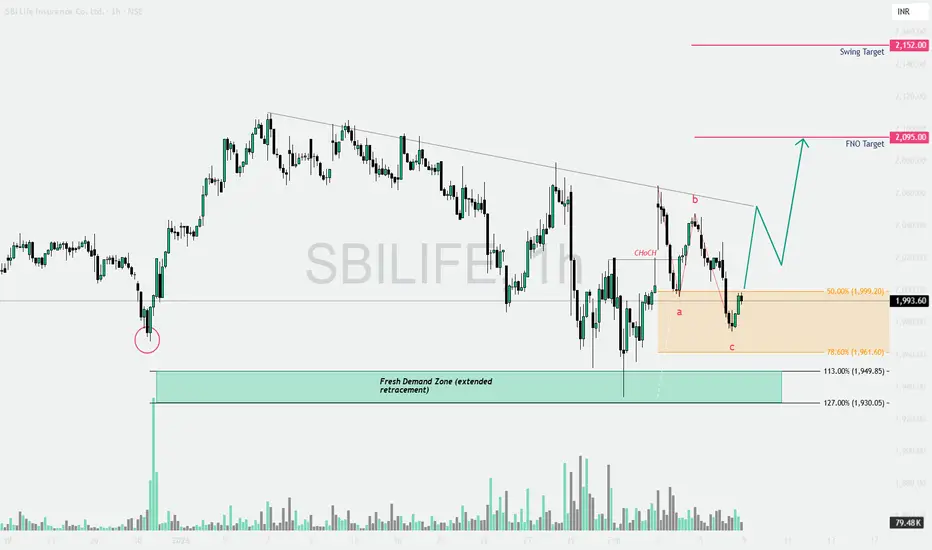
SBILIFE: "Change of Character" Signaling somethingThe Technical Breakdown (Educational Guide)
The chart displays a beautiful confluence of Smart Money Concepts (SMC) and Fibonacci retracement. If you’ve been looking for a textbook "Buy the Dip" setup, this is it! Here are 4 key educational points from this chart:
1. The Choch (Change of Character)

The best trades require research, then commitment.
Get started for free$0 forever, no credit card needed

Scott "Kidd" PoteetPolaris Dawn astronaut

Where the world does markets
Join 100 million traders and investors taking the future into their own hands.
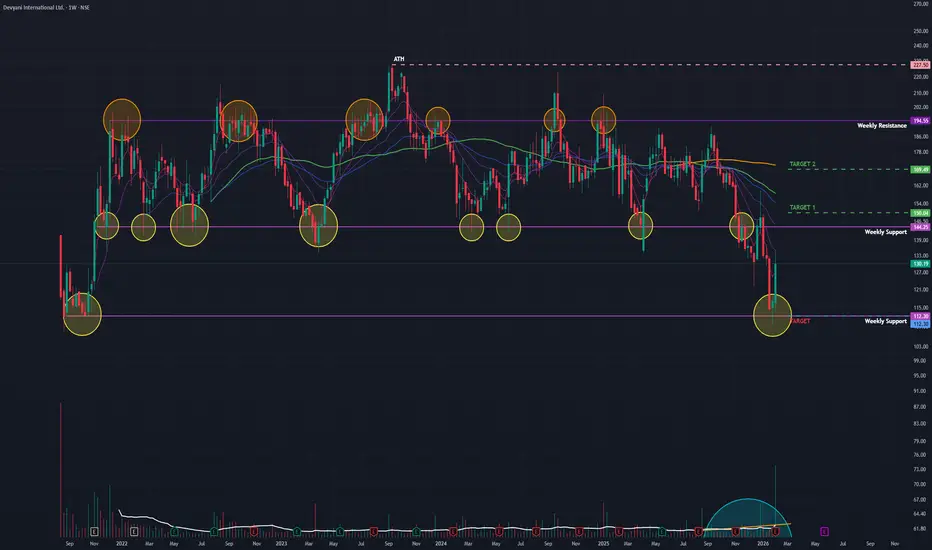
Devyani Int (W): Aggressive Bullish, Turnaround at Major Support(Timeframe: Weekly | Scale: Logarithmic)
The stock has confirmed a major "V-Shape Reversal" from its long-term support zone of ₹110. The surge is backed by "Climax Volume" and a positive reception to its Q3 operational updates, signaling that the 2-year correction might be over.
🚀 1. The Fund
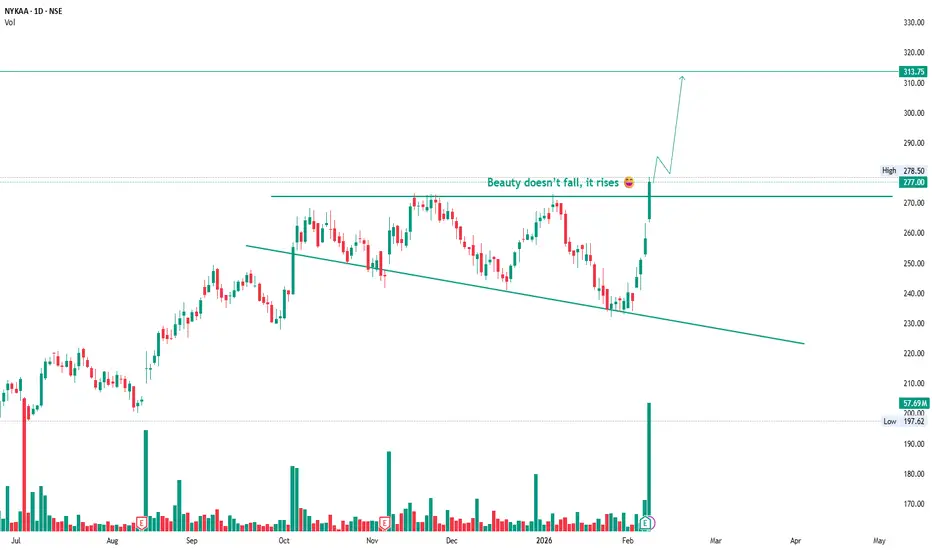
Nykaa: Descending Trendline BreakoutNykaa respected the rising structure even during the correction and never lost its trend strength.
Price held the sloping support, absorbed selling pressure, and then gave a clean breakout above the key horizontal resistance around 277 with strong volume.
This move shows acceptance above resistanc
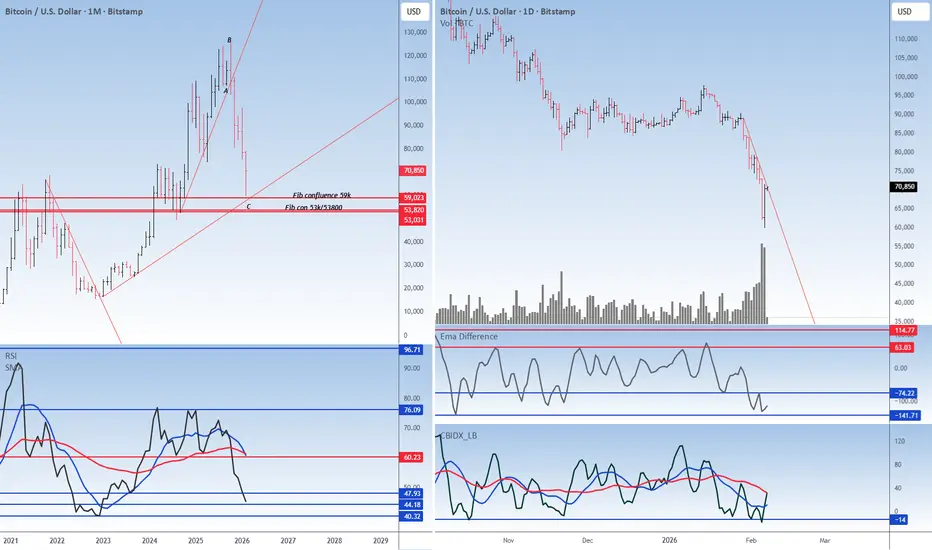
The crypto has found its supportBitcoin CMP $70690
The beauty of looking at various asset classes is that they rise and fall together. In my view the correction in the crypto is over.
Elliott- The v waves within the C wave is done. Hence to me this correction is over.
Fib- The crypto reversed just shy away from the 59K whic
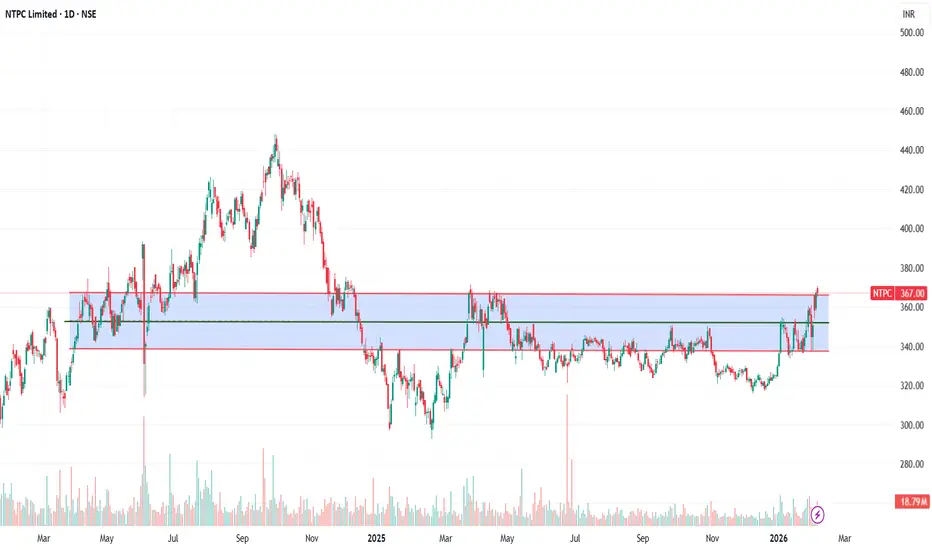
NTPC.. Moved outside the channel..NTPC.. Trying its level best to move.
Selling pressure in market pulled it back and retested the support.
Now things can be interesting..
Moved above this channel then first target can be somewhere around 370, the exact level from where it faced resistance today..
Second can be somewhere around
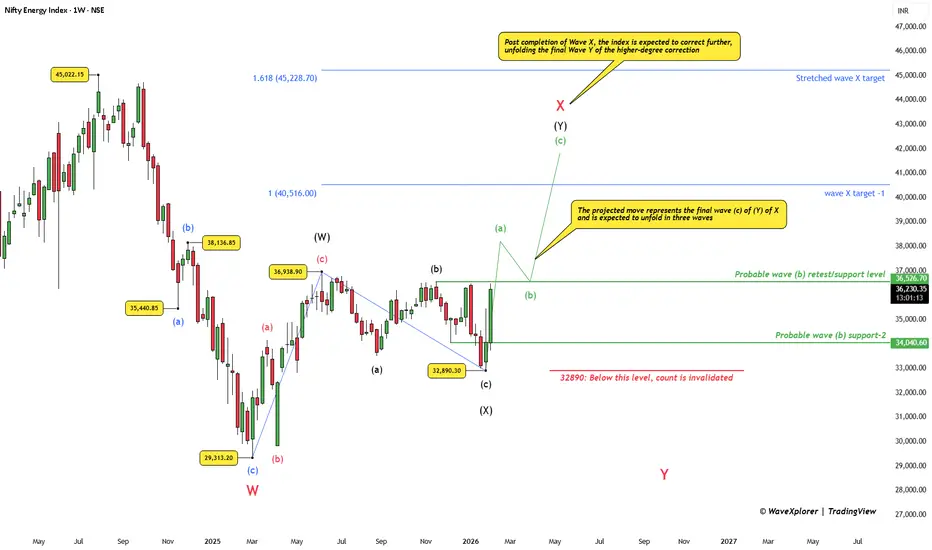
Nifty Energy: Final Bounce Before the Deeper CorrectionThe Nifty Energy Index continues to trade within a higher-degree corrective structure rather than a fresh impulsive uptrend.
The decline from the highs appears to have completed Wave W, followed by an ongoing recovery in Wave X.
In the near term, the structure allows for one more upside phase . A
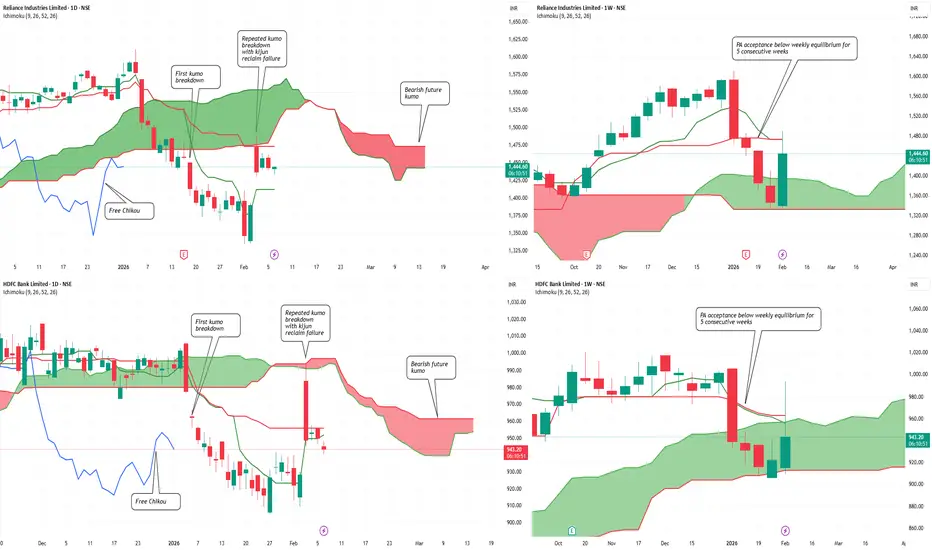
Dead Cat Bounce in Nifty? Heavyweights to Deliver The VerdictDead Cat Bounce in Nifty? Index Heavyweights to Deliver the Verdict Soon…
Both index heavyweights remain structurally weak despite the recent bounce.
On the daily timeframe, Reliance Industries and HDFC Bank have transitioned out of bullish Ichimoku regimes. Crucially, the second daily Kumo
Long term analysis of Tanla Platforms Ltd.Wrap up:-
As per chart of Tanla Platforms Ltd., it seems that correction in Tanla is over with a wxy pattern in major wave 2 and also, after breakout it has retested the support. Now, major wave 3 is about to start/started.
What I’m Watching for 🔍
As initial breakout is confirmed for a probabl

Understanding the Down Trend Line Breakout : Base chart GALLANTTUnderstanding the Down Trend Line Breakout : Base chart GALLANTT ISPAT Ltd
Introduction
Gallantt Ispat Limited, currently trading around 580.00 on its daily chart, has been moving below a persistent down trend line since August 2025. Recently, the stock has shown signs of strength by forming a doubl

JK Tyre & Industries Ltd – Weekly Chart Breakout WatchJK Tyre & Industries Limited is currently showing strong momentum, and the price action suggests that the stock may be approaching a fresh breakout above the ₹554 level.
Since this analysis is based on the weekly timeframe, the primary focus will be on a weekly breakout and weekly closing above

See all editors' picks ideas
Smart Trader, Episode 03, by Ata Sabanci, Candles and TradelinesA volume-based multi-block analysis system designed for educational purposes. This indicator helps traders understand their current market situation through aggregated block analysis, volumetric calculations, trend detection, and an AI-style narrative engine.
━━━━━━━━━━━━━━━━━━━━━━━━━━━━━━━━━━━━━━━
Pine Script® indicator

Asset Drift ModelThis Asset Drift Model is a statistical tool designed to detect whether an asset exhibits a systematic directional tendency in its historical returns. Unlike traditional momentum indicators that react to price movements, this indicator performs a formal hypothesis test to determine if the observed d
Pine Script® indicator

Hyperfork Matrix🔱 Hyperfork Matrix 🔱 A manual Andrews Pitchfork tool with action/reaction propagation lines and lattice matrix functionality. This indicator extends Dr. Alan Andrews' and Patrick Mikula's median line methodology by automating the projection of reaction and action lines at equidistant intervals, cr
Pine Script® indicator

Arbitrage Matrix [LuxAlgo]The Arbitrage Matrix is a follow-up to our Arbitrage Detector that compares the spreads in price and volume between all the major crypto exchanges and forex brokers for any given asset.
It provides traders with a comprehensive view of the entire marketplace, revealing hidden relationships among d
Pine Script® indicator

Wyckoff Schematic by Kingshuk GhoshThe "Wyckoff Schematic" is a Pine Script indicator that automatically detects and visualizes Wyckoff Method accumulation and distribution patterns in real-time. This professional tool helps traders identify smart money movements, phase transitions, and critical market structure points.
Key Features
Pine Script® indicator

Volume Cluster Profile [VCP] (Zeiierman)█ Overview
Volume Cluster Profile (Zeiierman) is a volume profile tool that builds cluster-enhanced volume-by-price maps for both the current market window and prior swing segments.
Instead of treating the profile as a raw histogram only, VCP detects the dominant volume peaks (clusters) insid
Pine Script® indicator

DeeptestDeeptest: Quantitative Backtesting Library for Pine Script
━━━━━━━━━━━━━━━━━━━━━━━━━━━━━━━━━━
█ OVERVIEW
Deeptest is a Pine Script library that provides quantitative analysis tools for strategy backtesting. It calculates over 100 statistical metrics including risk-adjusted return ratios (Sharpe
Pine Script® library

Arbitrage Detector [LuxAlgo]The Arbitrage Detector unveils hidden spreads in the crypto and forex markets. It compares the same asset on the main crypto exchanges and forex brokers and displays both prices and volumes on a dashboard, as well as the maximum spread detected on a histogram divided by four user-selected percenti
Pine Script® indicator

Multi-Distribution Volume Profile (Zeiierman)█ Overview
Multi-Distribution Volume Profile (Zeiierman) is a flexible, structure-first volume profile tool that lets you reshape how volume is distributed across price, from classic uniform profiles to advanced statistical curves like Gaussian, Lognormal, Student-t, and more.
Instead of forcin
Pine Script® indicator

Multi-Ticker Anchored CandlesMulti-Ticker Anchored Candles (MTAC) is a simple tool for overlaying up to 3 tickers onto the same chart. This is achieved by interpreting each symbol's OHLC data as percentages, then plotting their candle points relative to the main chart's open. This allows for a simple comparison of tickers to tr
Pine Script® indicator

See all indicators and strategies
Community trends
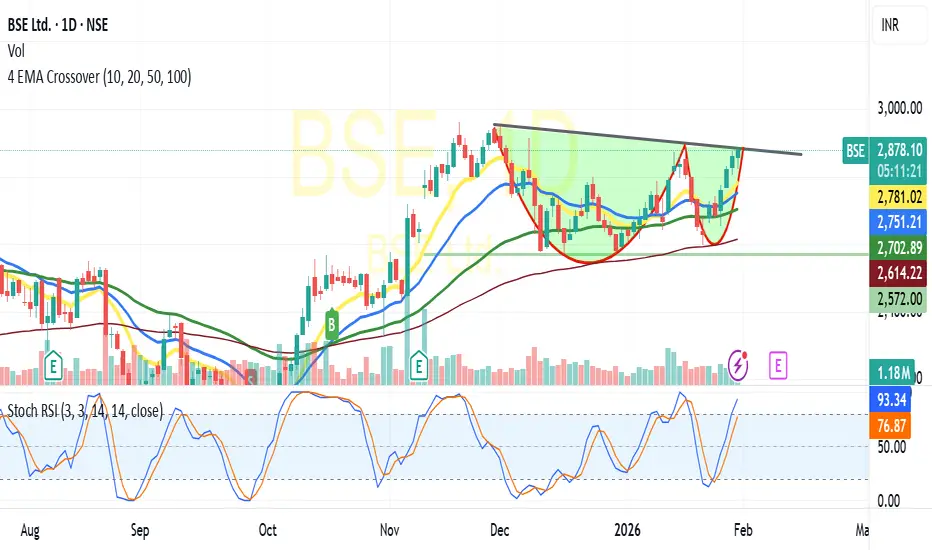
BSE: Short-Term Consolidation Breakout Confirmed!Technical Analysis:
BSE has been trading within a defined range for an extended period, and the chart now indicates a clear short-term breakout, suggesting a shift in momentum.
Key Highlights:
• Breakout Zone: The price has started sustaining above the 2,800–2,850 consolidation zone, highlighted in

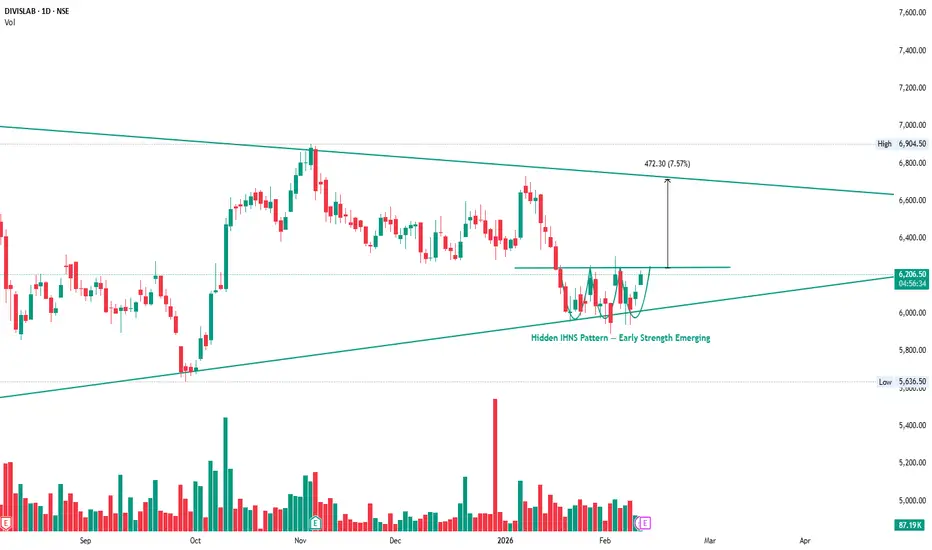
DIVISLAB : This Is Why Pattern Reading MattersThis is a hidden Inverse Head & Shoulders (IHNS) pattern forming near structure.
Price has already respected the neckline and higher lows are visible.
Such patterns usually appear before the crowd notices.
This is an early sign of strength, not a breakout chase.
Read the chart carefully — structur
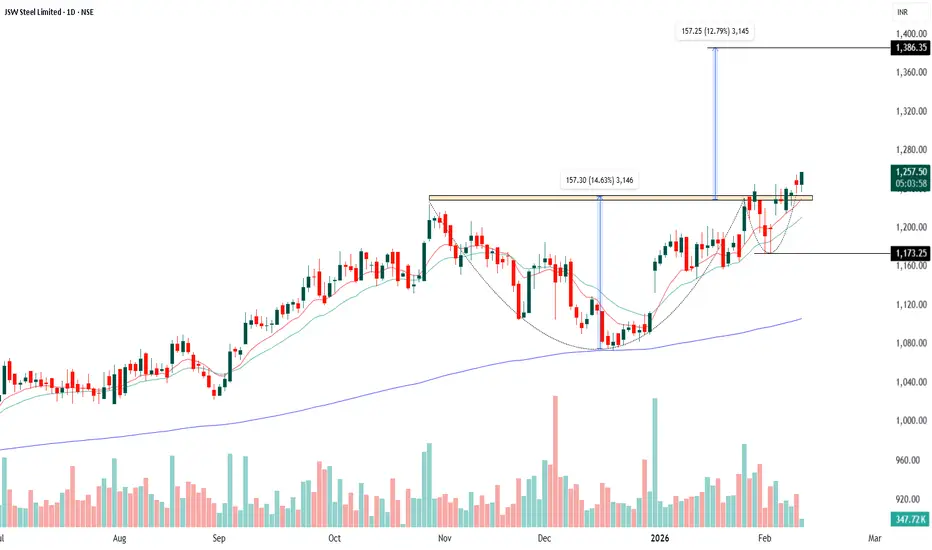
JSW STEEL - Cup and Handle - Daily The price formed a rounded bottom from November to early January, which is the cup. This shows gradual accumulation and exhaustion of selling pressure rather than panic selling.
After reaching the previous resistance zone near 1,240–1,250, the stock moved into a short, shallow pullback, forming the
Delta Corp – Support zone + reversal setup | Bottom FishingWe are looking at a major support area for Delta Corp and could be a great bet for Long term or swing trading.

CIEINDIA | BUY @ ₹420–₹440 | Multi-Year Breakout Swing📈 Setup (Monthly)
Range (multi-year): ₹40 – ₹384 (7.4 years)
Breakout confirmed above: ₹430 (monthly close)
Structure: Long-term base breakout with acceptance above range high
🎯 Trade Plan
Entry: ₹420 – ₹440
Stop-Loss (SL): ₹355 (weekly close basis)
💰 Targets (ABCD Profit Booking)
TP 1 (ABCD-1): ₹

Price Acceptance & Volume Distribution Study (PWL | 1H)Intraday Market Structure & Volume Profile Study (1H)
This idea presents an intraday market structure study of
PhysicsWallah Ltd. on the 1-hour timeframe, using Volume Profile
to analyze price acceptance and participation.
A Fixed Range Volume Profile has been applied from the onset of the
impuls

BSE has broken out of a horizontal range on daily chart BSE has broken out of a horizontal range on daily chart. On higher timeframes it is trading near previous high, that’s a structural bullish signal, not just noise. 🔥
Here’s how I’d read it from a technical lens:
What this usually means
Range → Expansion: Sideways markets store energy. A clean H

Max Financial Services - On the verge of a BO to a new level ?The stock has been consolidating for all more than 6 months after an up move. Finally, it looks like it is on the verge of a breakout to the next level above the ATH. All the indicators like Relative Strength, Absolute Strength, Money Flow are all positive. we can see that the moving averages are st

SBILIFE: "Change of Character" Signaling somethingThe Technical Breakdown (Educational Guide)
The chart displays a beautiful confluence of Smart Money Concepts (SMC) and Fibonacci retracement. If you’ve been looking for a textbook "Buy the Dip" setup, this is it! Here are 4 key educational points from this chart:
1. The Choch (Change of Character)
BSE-Likely Cup &Handle Break outBSE:
Trading at 2881 and above all its critical Moving averages Viz10/20/50/10 DEMA
In daily chart has formed C&H Pattern,
Based on the pattern and price volume suggests -breaking the Neckline resistance at 2880-2900 likely to test 2950/3000+ shortly(For educational purpose only)
See all stocks ideas
Tomorrow
IRCONIRCON International Ltd.
Actual
—
Estimate
2.00
INR
Tomorrow
IGPLIG Petrochemicals Ltd.
Actual
—
Estimate
—
Tomorrow
ORCHPHARMAOrchid Pharma Limited
Actual
—
Estimate
−0.30
INR
Tomorrow
PATANJALIPatanjali Foods Limited
Actual
—
Estimate
3.20
INR
Tomorrow
NOCILNOCIL Limited
Actual
—
Estimate
1.20
INR
Tomorrow
HERANBAHeranba Industries Limited
Actual
—
Estimate
—
Tomorrow
CAPACITECapacit'e Infraprojects Ltd.
Actual
—
Estimate
5.60
INR
Tomorrow
TBOTEKTBO Tek Ltd.
Actual
—
Estimate
5.95
INR
See more events
Community trends
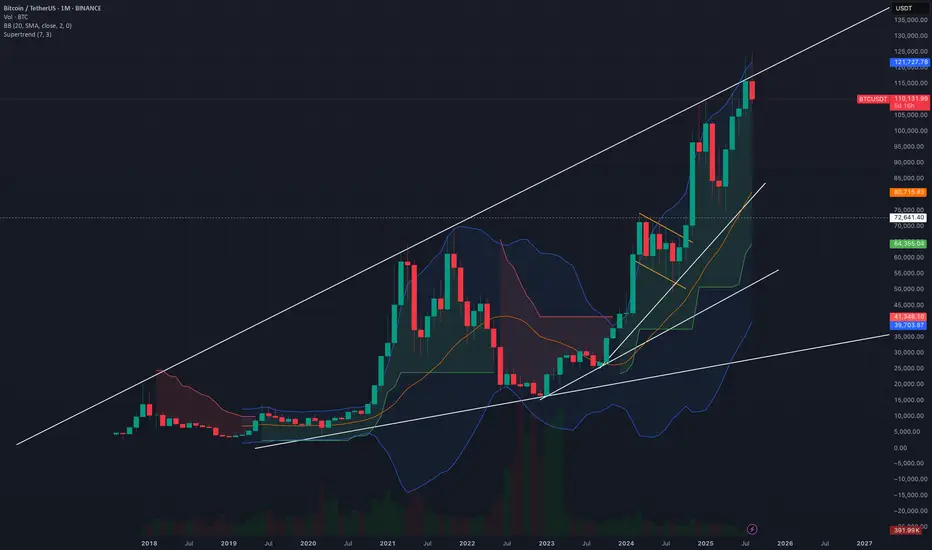
Weekly Analysis with buy/Sell scenarios in BTCAnother selling week. Price made low of 59977 and closed above ~70K. Overall BTC is still bearish and we may see further downfall after some pullback. ~74500 is critical level for pullback. ~55K is critical next level. We may witness a consolidation and reversals on 50K – 55K zone.
Price will remain

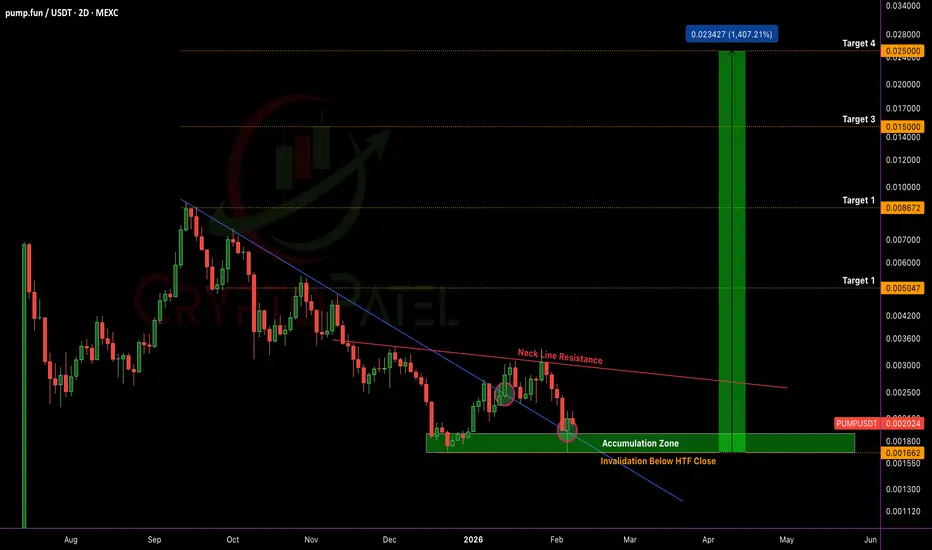
$PUMP PRICE PREDICTION | 15x UPSIDE POTENTIAL IF HTF BASE HOLDSNYSE:PUMP PRICE PREDICTION | 1,500% UPSIDE POTENTIAL IF HTF BASE HOLDS
#PUMP is trading inside a HTF Accumulation Zone after completing a long-term descending wedge, signaling a potential macro trend reversal.
Technical Structure Overview:
✅ Multi-month descending wedge breakout confirmed on 13th
Bitcoin Bybit chart analysis FEBURARY 9Hello
It's a Bitcoin Guide.
If you "follow"
You can receive real-time movement paths and comment notifications on major sections.
If my analysis was helpful,
Please click the booster button at the bottom.
This is a Bitcoin 30-minute chart.
There are no separate Nasdaq indicators.
When the re


BTCUSD ANALYSIS OVER H1 CHARTMonitoring BTCUSD for a potential short-term sell setup as price reacts around key resistance and structure.
Waiting for confirmation to define precise entry, targets, and risk levels.
Looking for a selling opportunity in BTC

BTC/USD: 1H Breakout Attempt After Base FormationBitcoin has formed a temporary base after a strong sell-off, followed by a steady recovery. Price is now testing a well-defined supply zone, where market reaction will decide the next directional move.
🔍 What the Chart Is Showing
➤ Strong bearish impulse followed by a sharp downside expansion
➤ V-

Hidden Bearish Divergence appears on 30m Time frameI have marked a red resistance line on RSI on 30m time frame. Which is looks like a class B Bearish Divergence. If it loses the support box expect a swift drop toward $68K.

BTCUSD (1H) – Range Support Bounce | Bullish Reversal SetupBTCUSD (1H) – Range Support Bounce | Bullish Reversal Setup
Bitcoin is trading on the 1-hour timeframe after completing a corrective decline and forming a clear range structure. Price has recently reacted strongly from the lower demand/support zone, indicating buyer interest at this level.
Technical

BitCoin? a bit down or big downBitcoin is loosing it fizz now and rally may be about to end.
as per chart reading i can see that it is on the resistance levels
and as now world economies are also settling it should be possible that crypto frenzy get no hype and for that Bitcoin may see a down pludge
Possibly for next 2-2.5 Yea
See all crypto ideas
Gold 4H, Concept to long trades.This chart documents multiple long executions, where most TP levels were systematically captured.
Entries were executed using scaled lot sizing ranging from 0.01 to 0.10, allowing partial position management and reduced drawdown.
The primary setup is a pennant continuation pattern, confirmed by st

Gold Trading Strategy for 10th February 2026📊 Intraday Trading Plan – Breakout Strategy (1-Hour Candle)
This strategy is based on 1-hour candle confirmation. Trades should be taken only after candle close, not during formation.
🔼 BUY SETUP (Bullish Breakout)
🟢 Condition:
Buy ABOVE the HIGH of the 1-hour candle
Candle must close above 510

Gold Price Update: Trendline Breakout with Clear Risk DefindGold has broken above the falling trendline, and this move is important not because of one candle, but because of the change in structure. After a prolonged corrective phase, price is now holding above the breakout level, which signals that buyers are starting to step in.
What I like about this set

XAUUSD/GOLD 1H BUY PROJECTION 10.02.26First, look at the market structure.
We can clearly see a Head and Shoulders pattern forming on the one-hour timeframe.
This is the left shoulder,
this is the head,
and now price is forming the right shoulder.
At the same time, the market has printed an Evening Star candlestick pattern near the to

We’re looking at Gold vs USD on the 1-hour chartPrice recently completed a deep pullback after a strong bullish leg.
That pullback formed a rounded / cyclical bottom (purple curve), which often signals trend continuation, not reversal.
🧠 Structure & Price Action
What stands out:
Higher low formed after the sell-off → bullish market structure

XAUUSD Price View with Supply, Demand and Risk ZonesGold price action shows a controlled recovery after a strong bearish move. Earlier, price found solid buying support in the demand zone around 4,650–4,700, where selling pressure reduced and the market stabilised. This zone remains an important support and a key area to watch if price moves lower ag

XAUUSD H1 – Compression before expansion? Key zones determine moGold is coiling inside a tightening structure — volatility expansion is approaching
📊 Market Structure & Technical Outlook (H1)
Price is trading inside a symmetrical compression formed by:
Descending trendline from prior high
Rising demand trendline from February lows
Previous CHOCH + BOS indic

XAUUSDXAUUSD has taken a bearish trend after strong consolidation and rejecting the Resistance and trend line.


Pullback Into Resistance, Sell-the-Rally Setup
Market Structure
Overall structure is bearish-to-range after a strong selloff.
Price made a rounded bottom from the Feb lows, then transitioned into a corrective rally.
The rally is retracing into a prior supply / resistance zone, not breaking structure yet.
Key Zones
Major Resistance / Supply

See all futures ideas
CADCHF-M15CAD/CHF has delivered a textbook sell-side liquidity raid beneath the Asian range, purging weak longs before staging an aggressive displacement higher. The reaction from the discount array suggests deliberate smart money activity, with price repricing toward equilibrium after leaving a clear imbalan

EURAUD MULTI TIMEFRAME ANALYSIS Scanning multiple forex pairs to filter high-quality trade setups. No trades are forced—only structure-based opportunities.
Note: There may be a delay in this video due to upload processing time.
Disclaimer: FX trading involves high leverage and substantial risk, and losses can exceed your initial

My EurUsd analysisMy Structure mapping + price action on 1Month tf. Could go wrong. Let's see how this draws out in coming weeks 🤞

AUDJPY Hourly 1:4 RRAs AUDJPY is in Uptrend
my idea to trade is mentioned in Chart
entry point OB rest at equilibrium of Dealing range
i will only enter after conformation of lower time frame (Upside Choch) in either one or five minutes
if it played well will get 1:4 RR Trade
#Forex #AUDJPY #FXtrade

USDCHF: Area defined to SellIf this pair retraces above then I will prefer to short in zone of 0.77180 - 0.77500
for target of 0.75500 and SL at upper edge of zone.

Long on GBPCAD , Wave 3 About to form........ ALERTTTGbpcad is about to unfold wave 3 , the price have reversed from the support zone and the structural breakout is about to occur.....
R2R = 2.5 : 1
Let's give a try on this high probability trade......

Bearish Displacement from HTF Supply | Targeting Sell-Side L
Price is finding heavy resistance at the current supply. Looking for the move down to the next high-probability demand zone. Trade safe!

USDCHF Is Not Weak – It’s Testing Support!USD/CHF is currently trading inside a well-defined rising channel, and the recent move lower looks more like a pullback into trend support rather than a breakdown.
For me, this is typical behavior in trending markets. Strong moves don’t continue in a straight line, price pulls back, tests support,

Gbpcad buy opportunity Price reacted from a base after taking trendline liquidity,fill the OB then market shifts the structure where it indicating to take the above liquidity .

EURGBP - Weekly Smart Money PlanMarket Context
EURGBP steps into the new week under strong macro influence as markets reprice Bank of England vs ECB rate expectations. Sticky UK inflation, mixed UK data, and growing speculation around ECB rate cuts are driving erratic flows rather than clean directional trends.
This backdrop fav

See all forex ideas
Trade directly on Supercharts through our supported, fully-verified, and user-reviewed brokers.


