NIFTY Set to Sign Off 2025 Quietly—Could 2026 Bring a Rally?As we enter the last week of 2025 and approach the first week of 2026, Nifty is doing something familiar—consolidating in a tight range.
Everything looks calm at first glance: volatility is very low (India VIX at 9.15), trading volumes are light, and price changes are small. But history shows that
Your 2025 space mission is here
Suit up and get ready to explore every highlight of your trading galaxy.


TATACONSUMStrong Breakout Candidates!
#TATACONSUM
1- Inverse head and shoulders pattern
2- Uptrend is Still Intact
3- Trading above all key moving averages
Keep on Radar.
Potential Upside Stocks!
#Disclaimer: View shared it for educational purposes only.
Follow for more upcoming charts.

Volume building to go longTimeframe: Daily
Trend: Uptrend
Structure:
• Support: 560
• Resistance: 625,645
• Key Level: 607
View:
If Price holding above 607 level. both targets are achievable
Target1: 625
Target 2: 645
Risk Note:
Invalidation below 560.
⚠️ Educational & analytical view only. No investment advice.

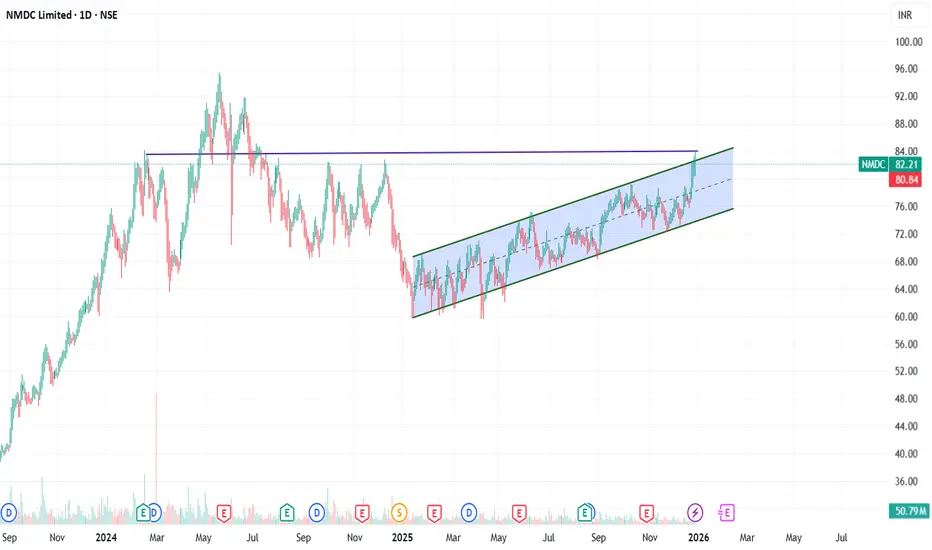
NMDC.. Can give breakout if moved out of this channell.MNDC is trading inside a channel as seen.. Tried to give breakout today but faced resistance at around 84.20..
Volume is building..
Need to hold above 84 for further movement.
If sustained then can go up to 90..
One can book profit at somewhere around 90 or trail the same..
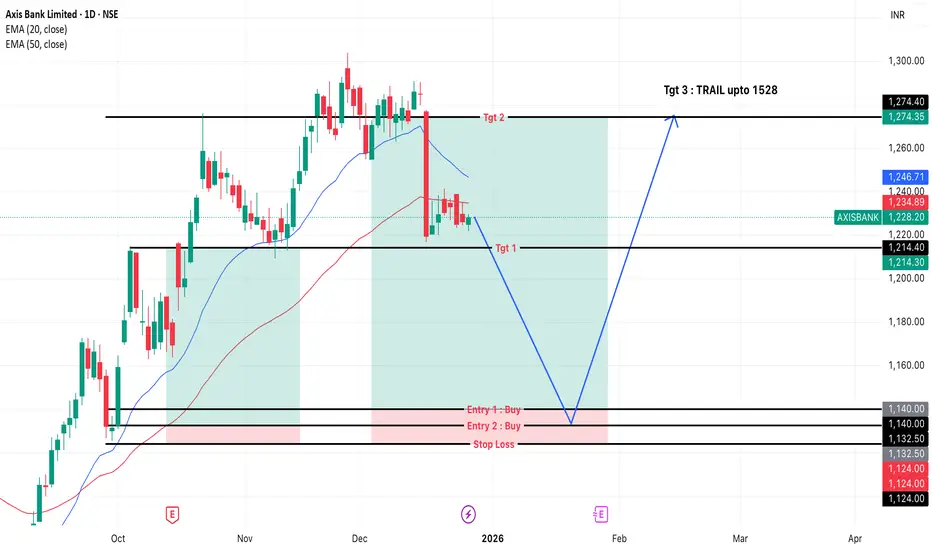
Axis Bank — Positional Long Setup | Plan the Pullback🟢 Long Plan – Buy the Dip Zone
🛒 Entry Zones
Entry 1: around ₹1140
Entry 2: around ₹1132–₹1124 (deeper fill zone)
⛔ Stop Loss
Below ₹1124 (decisive breakdown = setup invalid)
🎯 Upside Targets
Target 1: Previous support retest near ₹1214
Target 2: Resistance retest around ₹1274
Target 3: Trail the
Modern Insulators - Rounding Bottom PatternModern Insulator is heading towards a 100% gain. Factors:
1. Rounding Bottom Pattern on weekly time frame - look at last week's bullish candle
2. All Time High Breakout - ATH breakout from 2024 price, after so many rejections it has finally given a breakout
3. Company has shown growing revenue and

Strong bullishcase for NALCONational Aluminium Company Ltd | Weekly Elliott Wave Update
On the weekly timeframe, price has already exceeded the typical projection for Wave (5), confirming that the market is well into an ongoing impulsive phase, not a pending one.
Key structural observations:
Both Wave (2) and Wave (4) retra

Best to exit this counterUPL CMP 772
Elliott- The entire rally post the 2020 correction is corrective in rally. The current rally is also corrective in nature. The stock has reached its previous highs and is a natural resistance. To me a fresh set of three wave correction should start from here. The correction should be

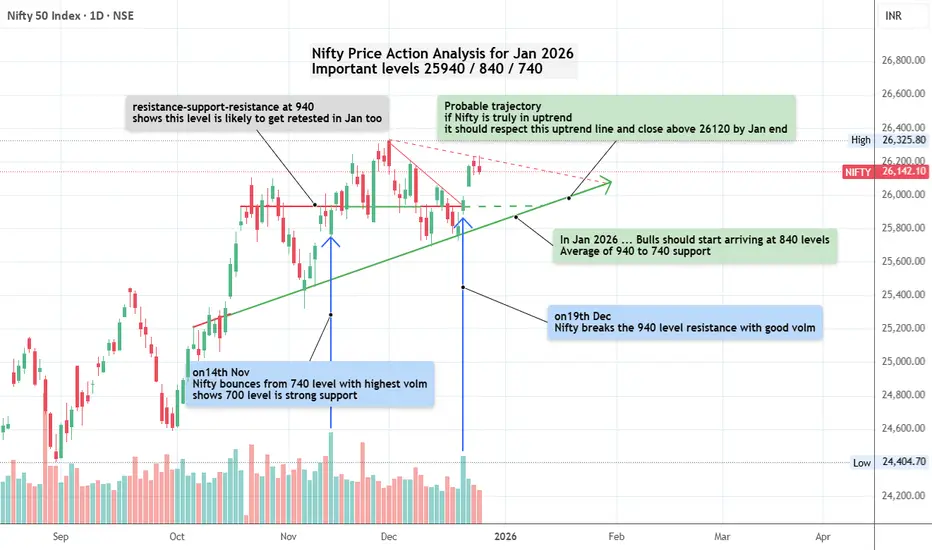
Nifty Price Action Analysis for Jan 2026Date: 25-Dec-2025
Nifty seems to show strong signs of making a new lifetime high in Jan 2026. The 25940 to 25740 levels will prove if bulls are entering long positions or not. Wait for it to correct and enter only when sellers show signs of weakness.
Uptrend line projected shows the likely path Nif
Bajaj auto in 2025 consolidated in a narrow range of 9500-7000 after making all time high at almost 13000 in sep 2024 .if start closing weekly strong candle above 9500 range high consider as a big breakout and opportunity to accumulate at retest /correction .for targets all time high .bullish view fails if wee

See all editors' picks ideas
Arbitrage Detector [LuxAlgo]The Arbitrage Detector unveils hidden spreads in the crypto and forex markets. It compares the same asset on the main crypto exchanges and forex brokers and displays both prices and volumes on a dashboard, as well as the maximum spread detected on a histogram divided by four user-selected percenti

Multi-Distribution Volume Profile (Zeiierman)█ Overview
Multi-Distribution Volume Profile (Zeiierman) is a flexible, structure-first volume profile tool that lets you reshape how volume is distributed across price, from classic uniform profiles to advanced statistical curves like Gaussian, Lognormal, Student-t, and more.
Instead of forcin

Multi-Ticker Anchored CandlesMulti-Ticker Anchored Candles (MTAC) is a simple tool for overlaying up to 3 tickers onto the same chart. This is achieved by interpreting each symbol's OHLC data as percentages, then plotting their candle points relative to the main chart's open. This allows for a simple comparison of tickers to tr

Vdubus Divergence Wave Pattern Generator V1The Vdubus Divergence Wave Theory
10 years in the making & now finally thanks to AI I have attempted to put my Trading strategy & logic into a visual representation of how I analyse and project market using Core price action & MacD. Enjoy :)
A Proprietary Structural & Momentum Confluence System

Per Bak Self-Organized CriticalityTL;DR: This indicator measures market fragility. It measures the system's vulnerability to cascade failures and phase transitions. I've added four independent stress vectors: tail risk, volatility regime, credit stress, and positioning extremes. This allows us to quantify how susceptible markets are

Volatility Risk PremiumTHE INSURANCE PREMIUM OF THE STOCK MARKET
Every day, millions of investors face a fundamental question that has puzzled economists for decades: how much should protection against market crashes cost? The answer lies in a phenomenon called the Volatility Risk Premium, and understanding it may fundam

Volume Gaps & Imbalances (Zeiierman)█ Overview
Volume Gaps & Imbalances (Zeiierman) is an advanced market-structure and order-flow visualizer that maps where the market traded, where it did not, and how buyer-vs-seller pressure accumulated across the entire price range.
The core of the indicator is a price-by-price volume prof

Match Finder [theUltimator5]Match Finder is the dating app of indicators. It takes your current ticker and finds the most compatible match over a recent time period. The match may not be Mr. right, but it is Mr. right now. It doesn't forecast future connection, but it tells you current compatibility for today.
Jokes aside,

Trend Line Methods (TLM)Trend Line Methods (TLM)
Overview
Trend Line Methods (TLM) is a visual study designed to help traders explore trend structure using two complementary, auto-drawn trend channels. The script focuses on how price interacts with rising or falling boundaries over time. It does not generate trade sign

Breakouts & Pullbacks [Trendoscope®]🎲 Breakouts & Pullbacks - All-Time High Breakout Analyzer
Probability-Based Post-Breakout Behavior Statistics | Real-Time Pullback & Runup Tracker
A professional-grade Pine Script v6 indicator designed specifically for analyzing the historical and real-time behavior of price after strong All-Ti

See all indicators and strategies
Community trends
#RVNL trendline breakout#RVNL trendline breakout now 388
ready for roar again for 20%
next level 501 (28%)
stoploss for traders 295

Axis Bank — Positional Long Setup | Plan the Pullback🟢 Long Plan – Buy the Dip Zone
🛒 Entry Zones
Entry 1: around ₹1140
Entry 2: around ₹1132–₹1124 (deeper fill zone)
⛔ Stop Loss
Below ₹1124 (decisive breakdown = setup invalid)
🎯 Upside Targets
Target 1: Previous support retest near ₹1214
Target 2: Resistance retest around ₹1274
Target 3: Trail the
NMDC.. Can give breakout if moved out of this channell.MNDC is trading inside a channel as seen.. Tried to give breakout today but faced resistance at around 84.20..
Volume is building..
Need to hold above 84 for further movement.
If sustained then can go up to 90..
One can book profit at somewhere around 90 or trail the same..
Hudco Cmp 211.25 dated 19-12-2025 Hammer Candle @ SupportHudco Cmp 211.25 dated 19-12-2025
1. Hammer Candle @ Support
2. Price reversed from support
3. RSI reversal
Buy @ cmp SL 204 target 215-218-220-223-225-228-230
It is just a view, please trade at your own risk.

Volume building to go longTimeframe: Daily
Trend: Uptrend
Structure:
• Support: 560
• Resistance: 625,645
• Key Level: 607
View:
If Price holding above 607 level. both targets are achievable
Target1: 625
Target 2: 645
Risk Note:
Invalidation below 560.
⚠️ Educational & analytical view only. No investment advice.
Titan breaout sustained above levelsTitan breaout sustained above levels it is an evergreen stock to buy for investing and for stort term also

ASIAN PAINT WEEKLY - EW ANALYSISAsian paint large gap stock still bearish view Expected target 100% extension of wave y risk reward above 1:3

TATACONSUMStrong Breakout Candidates!
#TATACONSUM
1- Inverse head and shoulders pattern
2- Uptrend is Still Intact
3- Trading above all key moving averages
Keep on Radar.
Potential Upside Stocks!
#Disclaimer: View shared it for educational purposes only.
Follow for more upcoming charts.
Modern Insulators - Rounding Bottom PatternModern Insulator is heading towards a 100% gain. Factors:
1. Rounding Bottom Pattern on weekly time frame - look at last week's bullish candle
2. All Time High Breakout - ATH breakout from 2024 price, after so many rejections it has finally given a breakout
3. Company has shown growing revenue and
Advance trade setupSimple trendline breakout at support region.
Support level. Trendline reversal expected

See all stocks ideas
Jan 6
GMBREWG.M. Breweries Ltd.
Actual
—
Estimate
—
Jan 8
GTPLGTPL Hathway Ltd
Actual
—
Estimate
—
Jan 8
JTLINDJTL Industries Limited
Actual
—
Estimate
—
Jan 9
ANANDRATHIAnand Rathi Wealth Ltd.
Actual
—
Estimate
—
Jan 9
BIRLAMONEYAditya Birla Money Limited
Actual
—
Estimate
—
Jan 9
JUSTDIALJust Dial Ltd.
Actual
—
Estimate
13.95
INR
Jan 12
GNAGNA Axles Ltd
Actual
—
Estimate
—
Jan 12
DMARTAvenue Supermarts Ltd.
Actual
—
Estimate
11.02
INR
See more events
Tomorrow
5
544562Gujarat Kidney & Super Speciality Ltd.
Exchange
NSE
Offer price
1.270
USD
Tomorrow
MAEDachepalli Publishers Limited
Exchange
BSE
Offer price
1.135
USD
Dec 31
544500Bai-Kakaji Polymers Limited
Exchange
BSE
Offer price
1.97 - 2.07
USD
Dec 31
601088Admach Systems Ltd.
Exchange
BSE
Offer price
2.53 - 2.67
USD
Dec 31
544599Apollo Techno Industries Limited
Exchange
BSE
Offer price
1.447
USD
Jan 7
544452Modern Diagnostic & Research Centre Ltd.
Exchange
BSE
Offer price
0.95 - 1.00
USD
See more events
Community trends
Symmetrical triangle chart pattern in BTCUSDA symmetrical triangle pattern formed in BTCUSD (Timeframe 4H).
Possible movement in next important training sessions. Look for price action which breaks this triangle.

$ETH at a Critical HTF Support Inflection.CRYPTOCAP:ETH at a Critical HTF Support Inflection.
$2,890 is the Structural Demand level.
Acceptance above this level Preserves Bullish Market Structure.
If Support Holds → Upside Continuation Toward $3,650 and $4,250.
Failure to Hold → Bullish Thesis Invalidated.
Binary Zone. Directional Expan


Bitcoin Bybit chart analysis December 23Hello
It's a Bitcoin Guide.
If you "follow"
You can receive real-time movement paths and comment notifications on major sections.
If my analysis was helpful,
Please click the booster button at the bottom.
This is the Nasdaq 30-minute chart.
Indicators will be released shortly at 10:30 AM and 1

BTCUSD BUY setupBTCUSD long trade placed with clear levels and disciplined execution.
Entry: 88,000
Stop Loss: 87,600
Target: 88,800
Risk was predefined and trade was managed step by step.
No chase, no panic — just following the plan.
#BTCUSD #BitcoinTrading #CryptoTrade #LongTrade #TradeRecap #TradingView #Pric

BTCUSD Shows Stability After Drop, Buyers ReturningBTCUSD earlier saw a strong fall and then reached a clear demand area. From this zone, selling pressure started to reduce. Recent candles suggest sellers are losing control and buyers are slowly coming back into the market. Price is now holding above this support, which is a positive sign.
The mark

$PI forming a potential double-bottom — patience still keyNASDAQ:PI forming a potential double-bottom — patience still key ⏳
After the sharp rejection from the highs, price formed Bottom 1, bounced, and is now revisiting a similar zone to print Bottom 2. This is a classic area where the market decides whether buyers step back in or the range breaks down.

Bears Lurking: Bitcoin Weekly Chart UpdatesA significant squeeze price action has been forming on the #Bitcoin chart, where we see a tight 4,000-point range occurring on a closing basis over the last five weeks.
Our bet remains on the price breakdown from the symmetrical triangle pattern, which is expected to occur this week.
Watch the v

BTC Broadening Bearish Formation Earlier, BTC was supposed to create a multi-week Rising Wage pattern, but that seems to have been rejected around 90.3k.
Note:
1. The past may or may not repeat
2. BTC might go to 81k, create bullish divergence on weekly or daily to retrace back to 100k before a major pullback
3. BTC will go to

AXAXUSD LONGAVAX has broken out of a range and has given a decent pullback can be looked for longs at the marked pice

See all crypto ideas
Breakout in Silver (Ag)...Chart is self explanatory. Levels of breakout, possible up-moves (where silver may find resistances) and support (close below which, setup will be invalidated) are clearly defined.
Disclaimer: This is for demonstration and educational purpose only. This is not buying or selling recommendations. I a

SILVER SPOT LONG TERM VIEWSilver Spot Now in Major resistance zone , if sell conform then
correction possible in this zone up to 61.80, 50.00
RESISTANCE 85.00 93.00
SUPPORT 50.00 39.00
View is for study purpose only , we are not recommend ant trade or investment
Always do your own analysis

SILVER | Monthly TA – High-Risk ZoneSILVER | Monthly TA – High-Risk Zone
#Silver is in a vertical Expansion Phase and Trading far above Long-Term Trend Support.
Price is testing a macro Supply / Distribution Zone after a Parabolic advance.
If Distribution Confirms:
→ Mean Reversion Toward 0.382–0.5 Fib ($39–$31)
→ Extended Correctio

Gold (XAUUSD) – 4H Chart Update | Breakout → Pullback Phase!Hello Everyone,, i hope you all will be doing good, let's check the updates of Gold as it has already done the hard part, the breakout above the previous resistance is in place. After the breakout, price pushed higher and is now doing what strong markets usually do: a pullback.
This pullback is not

Gold Trading Strategy for 29th December 2025🟡 GOLD TREND TRADING PLAN
📈 BUY SETUP (Trend Continuation)
🟢 Buy Above: 4566
🎯 Targets:
4577
4588
4599
📌 Logic:
If price sustains above 4566, it indicates bullish strength and continuation of the upward trend. Look for confirmation on higher time frames before entering.
📉 SELL SETUP (Trend Breakdo

NG : bullish for another highthere is a 5th wave which is pending. which will lead prices to another high in coming weeks or months

Gold Analysis & Trading Strategy | December 29
✅ Gold refreshed a new all-time high at 4549 during the US session on Friday, then pulled back to 4509, but never broke below the 4500 psychological level — confirming that bulls remain firmly in control.
✅ From the daily structure:
The moving averages maintain a perfect bullish alignment, and pri

Gold Futures | Bullish Reversal Setup from Demand ZoneThis chart shows a bullish setup on Gold Futures (GC1!) based on a pullback into a 2-Hour + 125-Minute Demand Zone confluence due to FII's pending orders.
I’m expecting the price to retrace back into the marked demand area before continuing higher toward the upside targets.
Plan
• Entry: Inside the

GOLDI am expecting the following price action on the gold chart.
This reflects my current market view based on the structure.
Sharing it here for reference and discussion.

XAUUSD 4H: Market Holding Positive StructureGold is moving with a stable bullish setup on the 4H chart. Price behaviour continues to show higher highs and higher lows, supported by consistent buying activity along the trend direction.
The current zone near 4533 is an important area to monitor. A normal retracement may take place, bringing pri

See all futures ideas
GBP/USD - Short - 15 MInIn this trade, the 4-hour timeframe supply order block was mitigated, followed by a clear Market Structure Shift (MSS). After confirming the MSS, we shifted to the lower timeframe to identify a valid order block. Price respected the LTF order block, providing a high-probability entry, with the marke

#USDJPY #FOREX #USDJPY
According to recent analysis, the pair has reached a local target of 157.77$ and is currently consolidating. There's a possibility of a corrective move towards 154.90$ before resuming the uptrend, with potential targets at 158.00$ and 161.00$
However, expecting a big breakout below 140$,

GBPJPY is taking support at 210.380 As we can see market is taking support at 210.380 if it breaks it will acts as resistance zone we can sell but if it not break we can buy in same direction.
Plan your trade accordingly

EUR/USD – Accumulation After Sell-Off, Structure-Based Long IdeaEUR/USD has seen a strong sell-off, followed by a sharp reaction from a well-defined support zone. This area has already proven its strength by absorbing selling pressure and pushing price higher.
After the bounce, price is now consolidating near support instead of breaking down further, indicatin


USDCHF – Buy from Discount Zone | Trendline Support + SMCTrade Description:
USDCHF has delivered a strong impulsive bearish move followed by sell-side liquidity sweep, and price is now reacting from a high-probability discount zone on the 1H timeframe.
The pair is currently holding descending channel support, where we can see price compression and reduc

Aud Cad Short-Term Downtrend: The short-term trend has been identified as being "DOWN" since December 10, 2025, indicating that minor, temporary corrections might occur within the larger bullish trend.
Resistance Zones: The price is testing strong resistance or supply zones around the 0.9140–0.9150 area, wh

GBP/USD Signals Trend Shift – Impulsive Upside ExpectedThe chart shows that GBP/USD has completed a full W–X–Y corrective pattern, with the final wave (y) and its C wave forming a clean bottom near the long-term support line. From that low, price has started a strong upward move, which looks like the beginning of a new impulsive Wave 1. The current pull

CHFJPY – Monthly Top Wick Expected This Week.Waiting for 2026CHFJPY is currently in a higher-timeframe bullish structure.
This week, price may form a top wick on the monthly candle, indicating short-term pause or consolidation.
From the second week of January, if volume supports the move, bullish continuation to the upside is expected.
This is a higher-time

AUD/USD bullish in 4hr time frameThe current chart represents strong bullish in 4hr time frame. As the correction of Flat is completed. Strong bullish with an target of 0.67070 is expected.

See all forex ideas
| - | - | - | - | - | - | - | - | ||
| - | - | - | - | - | - | - | - | ||
| - | - | - | - | - | - | - | - | ||
| - | - | - | - | - | - | - | - | ||
| - | - | - | - | - | - | - | - | ||
| - | - | - | - | - | - | - | - | ||
| - | - | - | - | - | - | - | - | ||
| - | - | - | - | - | - | - | - | ||
| - | - | - | - | - | - | - | - |
Trade directly on Supercharts through our supported, fully-verified, and user-reviewed brokers.


